EURUSD the Morning Star candlestick pattern And soon can pumpBased on our educational post:
Now we can expect local pump here for EURUSD based on two factors:
1. reversal and bullish candlestick pattern named Morning star.
2. so many stop losses hit when the price broke the daily support and it is a good sign too. (fake breakouts are a good reversal sign too)
DISCLAIMER: ((trade based on your own decision )) This post is actually a review of candlestick patterns that we had by example and is not financial advice on EURUSD so do your own research for your trades.
<>
Search in ideas for "CANDLESTICK"

Top 6 candlestick patternsHello traders, investors! First make sure to LIKE THE POST & FOLLOW TO NOT MISS THE UPDATES.
A candlestick is a way of displaying information about an asset’s price movement. Candlestick charts are one of the most popular components of technical analysis, enabling traders to interpret price information quickly and from just a few price bars.
Thanks for supporting!

GBPUSD - Do you know this candlestick pattern that I'm trading?The strong movement we had on Friday formed a very rare candlestick on GBPUSD hourly chart.
It is a candlestick that we have studied in the course on Udemy and we have seen that it can serve as a continuation pattern but also as a reversal in some market scenarios.
Do you know the name of it? :)

Descending Triange w/ an Evening Star Candlestick ConfirmationAs you can see in the picture, EURGBP respected the trendline and bounced off of the green support zone to form a Descending triangle. Then, it broke through, and retested it with a forming Evening star Candlestick confirmation. This trade is a good trade to lose, since the setup is so perfect and the orange line is a monthly resistance level so it's a fair area for it to potentially turn into a downtrend here. I am not an expert and don't take my advice for fact. Trade at your own risk.

Bitcoin Analyze (Candlestick Analysis)!!!hi, I hope that you took profits from my previous posts😊 (If Yes, please comment).
Today, I want to talk about some Candlesticks Patterns that we saw these days( Around one Month🌙).
Bitcoin Analyze ( BTCUSDT ) Timeframe Daily ⏰
Location: Still, Bitcoin is running on our Descending Triangle , and It close to the lower line of the Triangle (Support zone: 31620$ until 30960$ (Support + Cluster of Fibs+ the lower line of Descending Triangle ) == Heavy & important Support).
About Candlestick analysis : I was able to find Bearish Engulfing Pattern on the upper line of Triangle (Point C) + Morning Star Pattern on the Lower line of Triangle (Point D) + Evening Star Pattern at Point D (Fake Break) == All of these patterns were REVERSAL Pattern, but, now I can see Falling Three Method Pattern ( CONTINUATION Pattern) on the Lower line of Triangle (Point F), so I am expecting that Next Daily Candle will have RED Body.
RSI Analyze: RSI is running at Descending Channel, even we can see two fake breaks on this way, also I found Head and Shoulder Pattern on the upper line of our channel, if RSI breaks necking line, probably RSI will close to our Support Zone.👉https://www.tradingview.com/x/5F3N99fl/
MACD Analyze: we can see Bearish Confirmation Signal 🐻 👉
ADX = 38.6 >25 == Still we are on Downtrend.
Moving Averages MA200 & MA50 Passed from each other a few days ago.
I am deciding to share Bitcoin Long-term Analyze ( Monthly Time frame )📆 on each post that I will publish about Bitcoin: Please read this post carefully ( I ❤️LOVE ❤️THIS POST😀)👉https://www.tradingview.com/chart/BTCUSDT/PTviG7sS-Bitcoin-Long-term-Analyze-Monthly-Time-frame/
If you want to have more information about counting waves supports and resistances.....check this post 👉https://www.tradingview.com/chart/BTCUSDT/Ie6NTjBA-Bitcoin-Analyze-Playing-with-Harmonic-Patterns/
My Suggestion: please do NOT buy Coins for Midterm and Long-term investment until the market finds a way. At least you can wait for breaking our Descending Triangle (to UP).
Do not forget to put Stop loss for your positions (For every position you want to open).
Please follow your strategy , this is just my idea, and I will be glad to see your ideas in this post.
Please do not forget the ✅ 'like' ✅ button 🙏😊 & Share it with your friends, Thanks, and Trade safe.

EURUSD Candlesticks, Support and Resistance analysis The risk-reward ratio is not great if the market retraces and we have another bullish candlestick signal on the 4 hr chart then I will enter Long
EURUSD upside movement may be capped by EURJPY resistance through a gap

EURGBP Candlestick, Support and Resistance AnalysisIf the signal is long on a weekly timeframe- Trade bullish candlesticks, on daily and 4 hr charts Opp if its a sell signal.

Trade Pivot Point Indicator with Candlestick PatternFor a high probability trade using the pivot point indicator; wait for a rejection candlestick, pin bar, engulfing candlestick, or another bullish\bearish candlestick to form on the horizontal level.

CANDLESTICK PATTERNS EVERY TRADER SHOULD KNOWCANDLESTICK PATTERNS EVERY TRADER SHOULD KNOW
📍 Morning Star
This is a three-candle pattern. The first candle is a strong bearish candle following a downtrend. The second candle opens lower than the first candle’s close, has a small body and long wicks, reflecting market indecision. The third candle is a strong bullish candle, equal to or longer than the first candle, signalling the beginning of a new uptrend.
📍 Doji Candle
The Doji is a candle pattern that typically signals a potential reversal, whether bullish or bearish. It features long wicks and nearly equal open and close prices. Although not a strong standalone signal, it reflects market indecision and can indicate a possible upcoming reversal.
📍 Hammer Candle
This is a very simple yet powerful bullish reversal pattern, typically forming at the end of a downtrend. It has a small body and a long lower wick resembling a hammer. It signals strong rejection of lower prices and a potential upcoming uptrend. While it can sometimes be seen in upward reversals as well, it tends to be less reliable in those cases.
To trade effectively and become a more proactive professional trader, it’s helpful to study these candlestick patterns. When they appear, the market may be preparing to reverse — so it's essential to observe carefully in order to manage your current positions or find better entry opportunities.
Hopefully, this knowledge proves useful to you.
#ForexEducation #CandlestickPatterns #PriceActionTrading #TradingPsychology #TechnicalAnalysis #MorningStar #DojiCandle #HammerCandle #ForexUK #TradingTips #SmartTrading

Long Trade Plan for XTIUSD (Crude Oil), CandlesticksLong Trade Plan for XTIUSD (Crude Oil) on the basis of candlesticks and dow theory

Long on XAGUSD (SILVER), Candlesticks & Dow TheoryLong on XAGUSD (SILVER), Candlesticks & Dow Theory

Weekly candlestick.. Unbiased..Weekly candlestick on the bitcoin is looking not interesting as the close has left a lot of doubt on the market especially the confidence of the majority traders.
The reason is because of the latest weekly candlestick close which we see a wick to the upside rejecting the 200 MA as the claiming support. We did see the price tried to break above the 200 MA as the dynamic resistance but at the latest days before close, we see a huge bearish pressure and forming a wick.
We can't anticipate both bullish and bearish bias which current structure is still in the consolidation structure which both bulls and bears are in the similar strength level.
We might wait for another weekly candlestick closes to identify the clear bias on the market.

Doji Candlestick Menaces VisaVisa has trended steadily lower for the past year, and now some patterns may suggest that another peak has formed.
The first item on today’s chart is the attempted rally on July 27 following better-than-expected earnings. It looked like V could stay green for about half the day, but then it knifed down on heavy volume. The resulting higher high and lower low produced not only a large outside day but also a doji candlestick. That’s a potential bearish reversal pattern. (In addition, it left a hanging man candlestick on the weekly chart.)
Next, the potentially bearish price action occurred near a declining trendline that began in February.
Third, MACD is nearing a potential bearish crossover.
Finally, the 200-day simple moving average (SMA) has been falling. Also notice how V has struggled to remain above it since gapping downward in late October. Has the longer-term trend turned lower?
TradeStation has, for decades, advanced the trading industry, providing access to stocks, options, futures and cryptocurrencies. See our Overview for more.
Important Information
TradeStation Securities, Inc., TradeStation Crypto, Inc., and TradeStation Technologies, Inc. are each wholly owned subsidiaries of TradeStation Group, Inc., all operating, and providing products and services, under the TradeStation brand and trademark. You Can Trade, Inc. is also a wholly owned subsidiary of TradeStation Group, Inc., operating under its own brand and trademarks. TradeStation Crypto, Inc. offers to self-directed investors and traders cryptocurrency brokerage services. It is neither licensed with the SEC or the CFTC nor is it a Member of NFA. When applying for, or purchasing, accounts, subscriptions, products, and services, it is important that you know which company you will be dealing with. Please click here for further important information explaining what this means.
This content is for informational and educational purposes only. This is not a recommendation regarding any investment or investment strategy. Any opinions expressed herein are those of the author and do not represent the views or opinions of TradeStation or any of its affiliates.
Investing in cryptocurrencies involves significant risks. Please click here for TradeStation Crypto’s risk disclosures on investing and trading in cryptocurrencies.
Investing involves risks. Past performance, whether actual or indicated by historical tests of strategies, is no guarantee of future performance or success. There is a possibility that you may sustain a loss equal to or greater than your entire investment regardless of which asset class you trade (equities, options, futures, or digital assets); therefore, you should not invest or risk money that you cannot afford to lose. Before trading any asset class, first read the relevant risk disclosure statements on the Important Documents page, found here: www.tradestation.com .

Gold (XAUUSD) H1 Chart Analysis with D1 Doji Candlestick InsightGold (XAU/USD) H1 Chart Analysis with D1 Doji Candlestick Insight
1. **Resistance Zone ($3,050 - $3,060)**
- Gold is currently testing a **resistance level** around $3,050.
- A clear **break and hold above this level** could push prices towards $3,070 or higher.
2. **Support Levels to Watch:**
- **Immediate support:** $3,040 (near 21 EMA)
- **Stronger support zone:** $3,030 (highlighted in red on the chart)
- **Major support level:** $3,020 (Key demand area)
3. **Doji Candlestick on D1 Indicates Possible Pullback**
- Yesterday’s **Doji candle on the daily timeframe (D1)** signals **market indecision** and a possible **retracement** before a continuation.
- If today's session follows with a bearish close, Gold may **reject the resistance zone** and fall towards the **$3,030 - $3,020 support area**.
4. **Bullish & Bearish Scenarios:**
- **Bullish:** If price breaks **above $3,050** and holds, we could see a rally towards **$3,070 - $3,080**.
- **Bearish:** Failure to hold above **$3,050** and a break below **$3,040-$3,030** could confirm the Doji signal, leading to a deeper correction.

LINK - Three White Soldiers Candlestick PatternIn the weekly timeframe, a bullish candlestick pattern has formed on Chainlink.
The Three White Soldiers are characterized by three consecutive green candles. The higher the timeframe, the more powerful the pattern. We've recently observed an instance of the TWS pattern in the weekly, which was a precursor to a 136% increase:
However, the unfilled wick around $8 remains a concern - but also a potential for buying in / accumulating at a lower price.
_________________________
BINANCE:LINKUSDT

RECOGNIZING ENGULFING CANDLESTICK Hello traders!
- I want to present the engulfing candlestick pattern and will try to explain why it is important to recognize this pattern formation.
- The engulfing candlestick is a crucial tool in technical analysis for traders in financial markets. It serves as a powerful indicator of potential trend reversals or continuation, providing valuable insights into market sentiment and potential future price movements.
- Recognizing and interpreting these patterns can enhance the ability to spot potential trend reversals, confirm existing trends, and make informed trading decisions. However, like any technical analysis tool, it is important to use engulfing patterns in conjunction with other indicators and risk management techniques for a comprehensive approach to trading.
Follow, like, and comment to see the daily/weekly content:
www.tradingview.com

Bitcoin / Hanging Man CandlestickWhat is a Hanging Man Candlestick?
A hanging man candlestick occurs during an uptrend and warns that prices may start falling. The candle is composed of a small real body, a long lower shadow, and little or no upper shadow. The hanging man shows that selling interest is starting to increase. In order for the pattern to be valid, the candle following the hanging man must see the price of the asset decline.
....................................................................................................................
We are not registered or licensed in any jurisdiction whatsoever to provide investing advice or anything of an advisory or consultancy nature.
and are therefore are unqualified to give investment recommendations.
Always do your own research and consult with a licensed investment professional before investing.
This communication is never to be used as the basis of making investment decisions, and it is for entertainment purposes only.

AUDUSD - Candlestick Analysis Not my favorite opportunity of the week but one that could be sneaky good because of the associated risk to reward ratio. The AUDUSD has been bouncing back and fourth in a period of consolidation for a while now with the most recent move being a retracement into a high volume level.
We end last week with a very positive candlestick combination for the bears offering a potential short opportunity on the open.
If you have any questions or comments about the idea, or if you just want to share your own views, please leave it in the comment section below.
Akil

Ultimate Candlestick Cheat Sheet For CryptoHello, traders!
Here is the cheat sheet for the candlestick patterns. They are divided into five groups:
-Bullish Reversal
-Bullish Trend Continuation
-Bearish Reversal
-Bearish Trend Continuation
-Neutral
All these common formations you can see on the chart but first of all you should understand what has happened on the market. When you are looking at the candle a lot of useful information can be received.
For example if the candle have the long wick to the downside and short body ( hammer ), it means a huge bullish pressure and this is a reversal to the uptrend sign.
When you have three stars in the South formation it is can be noticed that the wicks to the downside are long and bodies became shorter. It means the weakness of the downtrend and also the sign of the potential reverse.
If the candle have a very small body ( doji ) this indicates that the market is in indefinite situation. Bulls and bears war did not lead to price changes and future price direction is unknown.
Do you use the candlestick patterns? Please write your comment and give us a support with like if you like such cheat sheets!
DISCLAMER: Information is provided only for educational purposes. Do your own study before taking any actions or decisions.

I SPY with my little eye : a RARE SPY candlestick patternGood day!
This is an unusual highlight, but I am so excited, and you would read on to find out why...
Previously outlined, on 3 August, I played the devil's advocate and looked at a counter trend scenario. In this scenario, the SPY was still below the weekly 55EMA, and could fail to break above, then break down much further. Thing is, the weekly SPY chart is bullish as ever, and it looked possible but somewhat remote.
At the beginning of the week, there appeared to be be some stalling and indecision on the SPY daily chart (yellow circle) and, over the last two days, with less than terrible data as expected, the SPY gapped up not once but twice. On Wednesday, the gap up was huge (see left 1H chart), and the day ended with what looked like a Gap and Run . This was followed by another gap up on Thursday, albeit a smaller gap. This was the first remote indication that the rocket to the the moon was about to sputter. As the day wore on, the SPY closed the gap... and very precisely closed the gap, in what is commonly known as Fading the Gap , or what I would prefer to call it - a Gap and Close . Technical indicators on the hourly SPY chart clearly shows a sputtering, perhaps expected from such a sharp rise over the last two days. So, in a Gap and Close, two common outcomes are either, a bullish reopening of the gap by ensuing price action or a bearish confirmation of the gap to remain closed.
Here is the more interesting part:
On the daily chart, the outcome is a rare candlestick pattern formed, called the Meeting Lines, and in this case, qualifies as a Bearish Meeting Line candlestick pattern , especially when it closed the gap precisely to meet at 419.99, at the apparent top of an uptrend. This is a presumed bearish reversal pattern, and requires a confirmation candle on Friday... yes, Friday, the end of the seemingly bullish week, the last day to determine the week's candle. Daily technical indicators are still territorially bullish but some waning signs are observed with the RPM crossing down, and a short term bearish divergence on the MACD. Furthermore, the volume (8MA, purple line) did not significantly increase nor trend up in support since mid-July.
So... Friday is the most indicative day.
Is the SPY going to break down (into the earlier gap range, below red support line) or find legs to bounce back and continue the bullish rally?
I would be be very cautious , given the above.
What do you think... and why?
PS. Leading indicators: JNK has a long legged doji, indicating indecision; TLT & TIP appear to have reversed.

Bullish candlestickPrice now at support trendline and shows bullish candlestick. Use proper money management and good luck

AUDCHF Trade Analysis Potential Inside Bar candlestick patternAUDCHF Trade Analysis Inside Bar candlestick pattern
Due to the correlation effect, DXY /dollar index that break lower key support zone had sent most of the USD pairs (AU/NU/EU/GU) going up
Potential Inside Bar candlestick pattern spotted
break and close above will showing bullish continuation for AUDCHF
Disclaimer
The content on this trade analysis is subject to change at any time without notice.
Any information provided here is only the personal opinion of the author.
This information is intended for educational purposes.

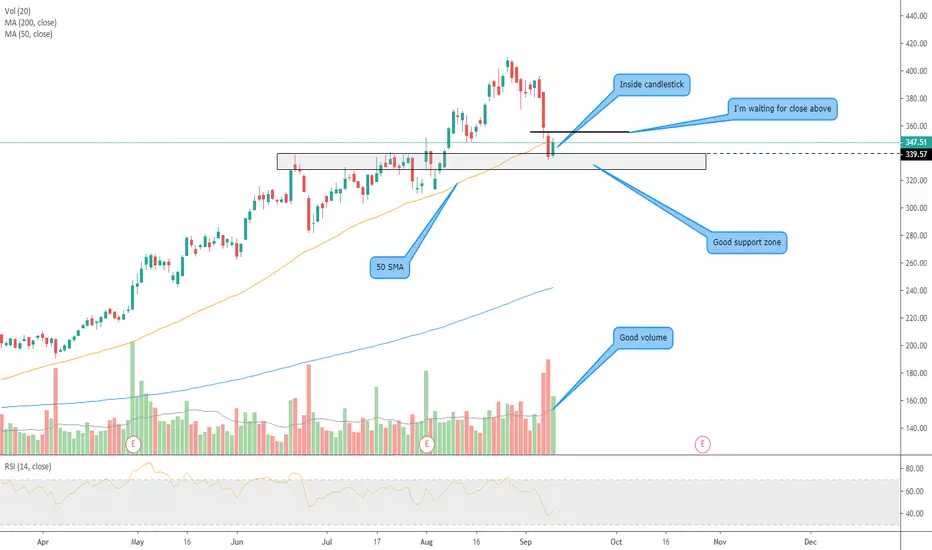
SHOP - Daily - Inside candlestick reversalIf you follow the stock market, and the big names in it, you will know that Shopify has been on a rampage. But, SHOP has recently pulled back into a zone that I think counts as solid support. In doing this it made an inside candlestick pattern yesterday.
Inside patterns are tricky ... they can be continuation or reversals. However, this particular inside candlestick is right at good support (what I think is good support anyways), and it had good volume. This tells me that this particular inside pattern is leaning to to the reversal side for SHOP. I will keep my eyes open and look for a close above the big candle. If it does that, I may enter long and ride it up to its all-time high.