DIVIS LABS - PINBAR CANDLESTICK PATTERN STRATEGY The pinbar candlesticks indicates rejection of prices on high levels and also indicates selling pressure at resistance levels. In the above chart, 1380 -1350 acting as resistance zone where we can see rejection of prices due to high selling pressure. The prices may go down to the previous 52 Week high levels to regain buyers in the momentum and also confirmed it as a new support levels.
It is also worth to note that the previous high levels where our target is placed is at 61.8 retracement levels that also indicates the importance of the said levels
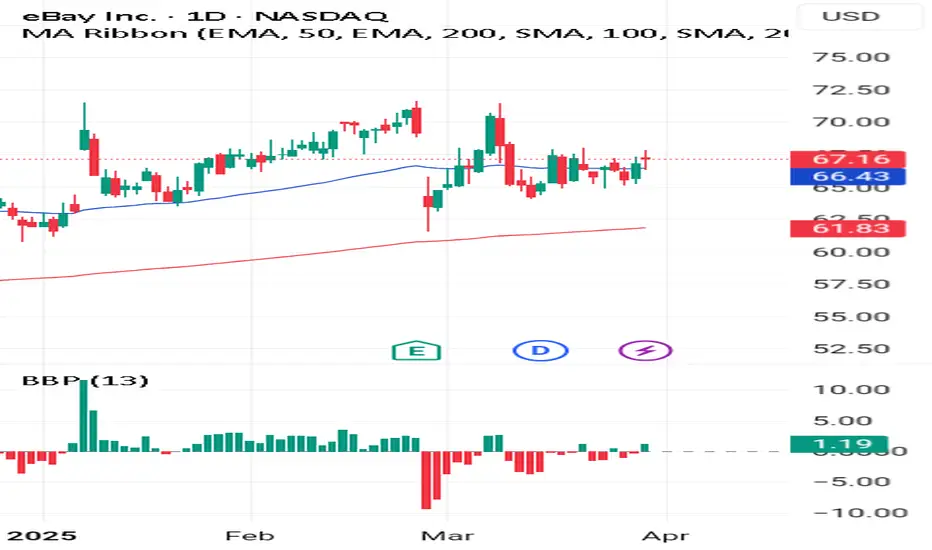
Search in ideas for "CANDLESTICK"

GBPUSD: Candlesticks Tell A Story...or I'm Just CrazyMY APOLOGIES AS IT LOOKS LIKE I ERASED THE DRAWINGS THAT I HAD ON THE CHART MY ACCIDENT
I went through the pairs in my trading portfolio this morning, along with a dozen or so more that are not and this was the only trading opportunity that I was able to find. This was an aggressive structure short based purely off on the candlestick formation with very aggressive stops and very conservative targets.
Whenever the markets are slow, we tend to have some good conversations in my Live Trading Room and yesterday we discussed the evolution of a trader from having a lack of discipline with very lose rules to being extremely disciplined with very strict rules to being extremely disciplined with very strict principles and looser rules. Hmm sounds like a good topic for tomorrow's video LET ME KNOW IF YOU'D BE INTERESTED BY LEAVING A COMMENT BELOW.
Syndicate members as mentioned on the Trade Floor I'll shoot you a video explaining this trade a little later in more detail but the point is the more reps you get in the market and the more experience you earn throughout your journey, the more you start to noticed the hidden clues that the market will leave you.
Akil Stokes
Chief Currency Analyst & Trading Coach
www.TradeEmpowered.com

ZILUSDT, Jack Jumped Over the CandlestickZILUSDT, Jack Jumped Over the Candlestick!
This volume saved the day for further dip in price.
Flame shining bright and green!
Price may again drop further still it exist the channel.

Potential Bottom SP500 Using simple Candlestick ChartingHi Everyone,
I believe we may have reach a bottom. Review my Candlestick charting video and let me know what you guys think. I will look for conformation with the RSI but this may be the bottom. I'm not saying we are going to go in "v" shape up, we may go sideways for a while and retest the lows. Review and let me know your thoughts.
Points i'm trying to make:
1) Doji candle stick shows indecision by the market yesterday March 23rd.
2) Even-though the stimulus bill has not been passed by the US senate, traders and insiders tool their positions already.
3) Line Break chart shows trend reversal.
4) Bottom may be retested in the future
5) I will be looking for RSI for bottom conformation.

AUDCAD Weekly Butterfly with RSI DivergenceCandlesticks are indicating reversal by showing pinbar that just barely touches a good support, declining volume indicates a reversal

Daily time frame looking BULLISH AFCandlesticks analysis on the daily time frame suggests that this pair may want to go up for at least the next few days.

What Is The #1 Candlestick Pattern?When I decide to help the Trading community I think about which market news gets the most "organic" likes I noticed it was the Dow Jones industrial Average (US30).
Because of this i decided to help you trade them now my expertise is in buying Bitcoin,Gold & Silver.
So learning to trade stock options was going to be a challenge.
I decided to learn 3 things:
#1-So I started by learning about the "3 Step-Rocket Booster Strategy"
#2 -Then I learned about the Candlestick Patterns
#3 -Then I learned about how to use oscillators
--
What Is The Rocket Booster Strategy?
--
This is a strategy used in trend analysis it has 3 Steps
--
1)The price has to be above the 50 EMA
2)The price has to be above the 200 EMA
3)The price has to Gap up
Remember the last step is very important because that step is what you need in order to execute the best candlestick pattern
-
What Is The #1 Candlestick Pattern?
-
They are alot of candlestick patterns and you have to choose your favorite in this case I chose to use the "long lower shadow"
If you want to learn more about candlestick patterns read Steve Nissan's Book about Japanese Candlestick Patterns
-
What is The Best Oscillator ?
-
Now the most common one is called MACD.
But I prefer to use Bull Power
Because this is the oscillator I first used when I was learning about forex trading and lost when I didn't understand how to use it.
Now thanks to the new TradingView Screener I have been able to use in stock options trading.
I will try to make a video tomorrow demonstrating how to trade stock options on US 30 Dow Jones Industrial Average
As today I was so exhausted from a very long walk and day from yesterday.
Stay tuned for a video demo tomorrow
Rocket boost this content to learn more
Disclaimer ⚠️ Trading is risky please learn risk management and profit taking strategies and feel free to use a simulation trading account before you use real money.
Top 3 Candlestick Patterns You Could Use Finding a candlestick pattern:
Morning star
Bullish engulfing
Hammer
These strategies help you detect if a price is in an uptrend or not.
The problem is if you enter when the pattern is not touching support.
Make sure
Price is above 50 EMA
Price is above 200 EMA
Price is indicating a candlestick
Now sometimes the price will not go up immediately.If that's the case you need to exit your position.
Also consider looking at it like the price is a consolidation or range this means volatility kicking in.
So try to give your position atleast 2 weeks also set stop loss positions
to exit when you feel you are not
Able to risk all your capital.
It will take time to master trading.
Rocket 🚀 Boost This Content To Learn More.
Disclaimer ⚠️ Trading is risky please learn about risk management and profit taking strategies and feel free to use a simulation trading account before you use real money.
Rising Three methods Candlestick Prior Uptrend in the script and again a Candlestick pattern found in this .
Rising Three Methods
The Rising Three Methods candlestick pattern is formed by five candles.
Here’s how to identify the Rising Three Methods candlestick pattern:
Initially, you want to see a big green candle
Followed by three small red candles
The red candles don’t break the high of the first green candle
Finally, another big green candle, closing above the other candles.
All the best.
Gratify if you appreciate the practice then you can like it, share it and
If you want me to investigate any chart for you then would cherish doing that for you.
Thank you for your time and support.
Stay safe.

An Uptrend Divergence in Candlestick Pattern!The candlestick pattern indicates a divergence signal where the price closed above the MA20 line. The results in volume were minimal due to yet to cross above the MA20 line.
MACD and RSI indicators indicate a positive trend which aligned with the candlestick pattern.
Let's save SUNVIEW in WL and watch out for significant price movement where the result in volume exceeds the MA20 line.
R 0.800, 0.840
S 0.695

DXY index growth by Bullish Engulfing Candlestick Pattern🚀Hi everyone👋 (Reading time less than 2 minutes⏰) .
It is better first to take a look at the daily chart of the DXY index.
As you can see in the chart below, DXY has managed to form a Piercing Line Candlestick Pattern near the 🟢 heavy support zone($ 101.640-$ 100.80) 🟢.
📚 Piercing Line Candlestick Pattern is a two-day, candlestick price pattern that marks a potential short-term reversal from a downward trend to an upward trend. The pattern includes the first day opening near the high and closing near the low with an average or larger-sized trading range.
In the 4-hour time frame⏰, DXY has managed to form a Bullish Engulfing Candlestick Pattern in the s🟢 support zone($ 102.230-$ 101.910) 🟢 (it should be noted that the formed pattern is one of the valid and strong return patterns).
Also, Regular Divergence (RD+) can be seen between two successive valleys.
🔔I expect that in the coming days, DXY will take a bullish position after breaking the downtrend line and even breaking the 🔴 resistance zone($ 102.86-$102.67) 🔴.
U.S.Dollar Currency Index ( DXYUSD ) Analyze, 4-hour time frame⏰.
Do not forget to put Stop loss for your positions (For every position you want to open).
Please follow your strategy, this is just my Idea, and I will be glad to see your ideas in this post.
Please do not forget the ✅' like '✅ button 🙏😊 & Share it with your friends; thanks, and Trade safe.

GOLD SELL ANALYSIS+CANDLESTICK BEHAVIORgood day traders...on GOLD monthly timeframe I see a retest and another thing I am looking at is that the monthly candlestick does not have a shadow so it might tank down to give the monthly candlestick a shadow and respect the retest. On the remaining 9 days of this month I am expecting to see sells on gold

EURUSD - Short - LL LH - Bearish CandlestickEURUSD - Short - LL LH - Bearish Candlestick
1. LL LH bearish trend
2. Bearish Candlestick on trendline and Daily Major Resistance (Bearish Engulfing)
Entry @ 1.03107
SL @ 1.03500
TP1 @ 1.02700
R:R @ 1
Sell Lot @ 1.0

Bearish Engulfing candlestick has formed on Weekly EUR/USD chartA Bearish Engulfing candlestick pattern has formed on the Weekly EUR/USD chart. I just posted a Dark Cloud Cover candlestick pattern the other day. EUR/USD seems to want to trade sideways right now, after moving down after the FED raised rates. Happy Trading!! Happy Holidays!

NZDCHF 1H Looking for Candlestick Patterns to improve Entries Bullish Reversal
NZDCHF 1H Looking for Candlestick Patterns to improve Entries

Inverted Bull Hammer candlestick pattern (weekly chart)Nike has confluence with the RSI already going on up and both MACD and Signal line at the 0 line as well. Strong support is shown at the 70's level and already rebounding upwards, just like when Nike fell through mid 2024.
The Inverted Hammer candlestick formation occurs mainly at the bottom of downtrends and can act as a warning of a potential bullish reversal pattern. What happens on the next day after the Inverted Hammer pattern is what gives traders an idea as to whether or not prices will go higher or lower.
The Inverted Hammer formation is created when the open, low, and close are roughly the same price. Also, there is a long upper shadow which should be at least twice the length of the real body.
After a long downtrend, the formation of an Inverted Hammer is bullish because prices hesitated to move downward during the day. Sellers pushed prices back to where they were at the open, but increasing prices shows that bulls are testing the power of the bears.
Read more at: commodity.com

Engulfing Candlestick Pattern: XAGUSD: Enter at closing priceEngulfing Candlestick formed at resistance level at price 29.79800. Enter short positions at the closing price of the engulfing candle.

DXY Index is Ready to Pump by 🌄Morning Candlestick Pattern🌄🏃♂️DXY Index is moving near the 🟢 Support zone($104.27-$103.90) 🟢, and 200_SMA(Daily) and 100_SMA(Daily) , and the lower line of the ascending channel .
💡Also, the Morning Candlestick Pattern is clearly visible.
🌊According to the theory of Elliott waves , it seems that the DXY Index has completed the Double Three Correction(WXY) in the support zone .
🔔I expect the DXY Index to rise to at least the Resistance line .
U.S.Dollar Currency Index ( DXYUSD ) Analyze, 4-hour time frame⏰.
Do not forget to put Stop loss for your positions (For every position you want to open).
Please follow your strategy; this is just my Idea, and I will gladly see your ideas in this post.
Please do not forget the ✅' like '✅ button 🙏😊 & Share it with your friends; thanks, and Trade safe.

🥇Gold🥇Will Go Down by Evening Star Candlestick Pattern📈 Gold failed to break the 🔴 Resistance zone($2,052_$2,043) 🔴and finally lost its Uptrend line.
💫 Gold has completed its pullback to the Uptrend line with an Evening Star Candlestick Pattern .
🔔I expect Gold to continue falling after breaking the Support lines , at least to the 🟢 Support zone($2,010_$2,004) 🟢.
Gold Analyze ( XAUUSD ), 4-hour time frame ⏰.
Do not forget to put Stop loss for your positions (For every position you want to open).
Please follow your strategy; this is just my idea, and I will gladly see your ideas in this post.
Please do not forget the ✅' like '✅ button 🙏😊 & Share it with your friends; thanks, and Trade safe.

AUDCAD - Bear Cypher + Reading Candlestick CluesWe're looking at 2 things here on the AUDCAD.
Starting on the daily chart we have a couple of candlestick formations that have left us clues about how price may react if it's able to get to that level once again.
Going down to a lower timeframe we also have a potential advanced pattern formation setting up with it's completion point directly at the start of that previous zone.
If you have any question, comments or just want to share your analysis on this chart, leave it below & I'll be sure to give it a look.
As always make sure you SMASH that BOOST button before heading out.
Akil

🥇Gold🥇 Falling with Bearish Engulfing Candlestick PatternGold has been moving in an ascending channel for over 5 days.
Gold was able to break the lower line of ascending channel.
In the last 16 hours, gold started to complete a pullback to the ascending channel, the 💡sign💡 of the completion of the pullback is the formation of a Bearish Engulfing Candlestick Pattern .
I expect gold to fall to at least a 🟢 heavy support zone($1904-$1886.40) 🟢 after breaking the 🟢 support zone($1922.6-$1919.60) 🟢
I expect gold to continue its decline to the 🎯 targets 🎯 I specified in the chart.
Gold Analyze ( XAUUSD ), 4-hour time frame ⏰.
Do not forget to put Stop loss for your positions (For every position you want to open).
Please follow your strategy, this is just my idea, and I will gladly see your ideas in this post.
Please do not forget the ✅' like '✅ button 🙏😊 & Share it with your friends; thanks, and Trade safe.

USDCAD will go DOWN with Three Black Crows Candlestick Pattern!USDCAD again reacted to the downtrend line and failed to break this line.
Also, the USDCAD reaction led to the formation of the Three Black Crows Candlestick Pattern .
In addition, we can see between two consecutive peaks of Hidden Divergence(HD-).
I expect USDCAD to drop down to the next 🟢 support zone 🟢.
🔅U.S.Dollar/Canadian Dollar (USDCAD), 4-hour time frame ⏰.
Do not forget to put Stop loss for your positions (For every position you want to open).
Please follow your strategy, this is just my idea, and I will gladly see your ideas in this post.
Please do not forget the ✅' like '✅ button 🙏😊 & Share it with your friends; thanks, and Trade safe

EURGBP falls again with ⭐️Evening Star⭐️Candlestick Pattern!!!EURGBP has attacked the resistance line several times, but it seems that the 💡sign💡 of the failure of this attack can be the formation of the Evening Star Candlestick Pattern on the resistance line and near the 🟡 Price Reversal Zone(PRZ) 🟡.
I expect EURGBP to fall to the 🎯targets🎯 I specified in the chart; I also shared a short position with RR=2.28 with you, but be sure to trade according to your own strategy and don't forget capital management.
🔅Euro/British Pound Analyze ( EURGBP ), 4-hour time frame ⏰.
Do not forget to put Stop loss for your positions (For every position you want to open).
Please follow your strategy, this is just my idea, and I will gladly see your ideas in this post.
Please do not forget the ✅' like '✅ button 🙏😊 & Share it with your friends; thanks, and Trade safe.
