GBPJPY Short . Hanging Man CandlestickGBPJPY Tto be sold after spotting Hanging man candlestick on the chart.
Search in ideas for "CANDLESTICK"

Bullish candlestickRejection candle and shows bullish candlestick on daily timeframe. Break nearest daily resistance. Use proper money management

Trading Dragonfly Doji CandlestickDragonfly doji candlestick has same opening and closing price with a long shadow below the closing price.

TOPGLOV Not every candlestick pattern "count". where/when.28/11/TopGlove.. Not every candlestick pattern "counts" Depend on where/when it was "found"...Is is a "valid" counts?. A "doji"? A "Pin Bar" A "Good" Morning Star? on not 1 minute but monthly chart..?..( Wait,, Not yet), wait until it closed monthly bar after 30/Nov/21

Hanging man candlestick on NasdaqHanging man candlestick on Nasdaq
I am looking for a short if this candle closes like that. stoploss above the wick of todays candle

Aggressive and early short on US30 due to candlestick formationTaking an aggressive and risky short position on US30 due to candlestick formation at all time high.

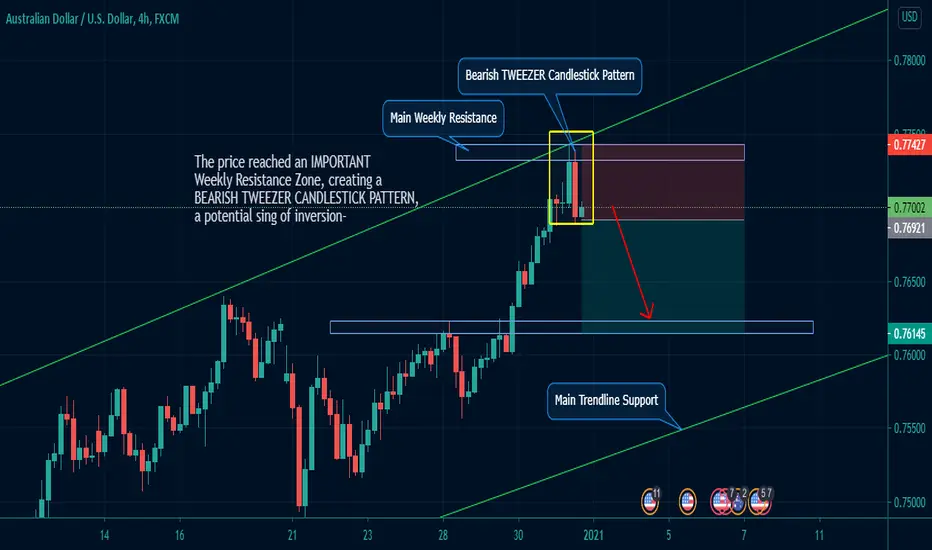
AUDUSD (H4): SHORT NOW on the TWEEZER Candlestick Pattern!Hi traders and welcome to my channel, if you enjoy my FREE Technical Analysis, support the idea with a big LIKE👍 and don't forget to SUBSCRIBE my channel, you won't miss anything!
In my previous analysis I explained the reasons I believe the market is going to fall down soon, you could check it out on my "Link to Relates Ideas" or clicking on the link below:
Let's focus now only on the area that interests us:
As we can see, the price reached an important resistance zone, that rejected the price many time in the past. It actually created a clear Bearish Tweezer Candlestick Pattern;
IF THE PRICE will continue on the same trend (let's wait the next candle to have a confirmation before opening any position), you could place a short trade:
ENTRY POINT: 0.76500
TAKE PROFIT: 0.76153
STOP LOSS: 0.77437
RISK/REWARD RATIO: 1.53
AAVE - Taking a Look at the Weekly and Daily Candlestick ChartsI take a look at the weekly and daily charts in AAVEUSD and point out a few bullish candlestick setups that have formed over the past few weeks.

Morning star candlestick pattern (bullish) Potentially a morning star candlestick forming on 2 hour timeframe (bullish). Will wait till open for confirmation.

GBPUSD Daily Resistance Rejection + Candlestick Signal Price went up in the last weeks to Resistance level and it is being rejected. It firmed a candlestick signal showing that there could be a trend reversal back into the Bullish channel formed. What are your thoughts? Drop a comment, like and follow.

Falling star candlestick suggests QQQ may pull backThe technology-heavy Nasdaq index has been greatly outperforming the S&P 500, as investors flee to the relative safe haven of technology stocks. However, tech stocks have gotten fairly expensive, and it's hard to see more investors piling into companies like Apple or Microsoft as these companies close their retail locations. I think tech will continue to outperform other sectors like banks, travel, and energy, but it's still probably due a good 10% pullback from here. In terms of technicals, we got a falling star candlestick on the weekly chart and what looks like a fairly large bearish divergence. The daily chart also shows bear divergence:
Tech might return to strength during the mid-July earnings season. Tech companies tend to outperform analyst earnings expectations, and early guidance has so far looked good. Meanwhile, there could be slaughter in other sectors as companies loaded with debt offer weak guidance for the year ahead. Thus, I will treat a Nasdaq pullback in the next two weeks as an opportunity to buy into earnings season. I'll probably focus on some tech sector-specific ETFs like SOXX and EWCO.

RTX looks great here on the weekly candlestick!My custom-coded candlstick alerts are pointing to a bullish few weeks for RTX! I'm in. Daily candlestick alert was about 4 trading days ago.

NZDCAD Daily Closes Finaly With A Bullish CandleStick Formation About 2 Weeks Ago NZDCAD Broke Out of Its Wedge Pattern At A Weekly Major Support (See Previous Posts On NZDCAD)
Since Then We Have Had 2 Chances To Get In, 1st When It Broke Out 2nd Was At A Trend Line Break, Now We Have A 3rd One, The Daily Closed With A Bullish Engulfing Candlestick Formation (See Yellow Circle on The Candle) With A Counter Trend Line Break, And On The Lower Time Frames The Market Took Out Some Highs As Well,
It Looks Like The Market Is Finally Ready For Take Off.
We Also Have The RBNZD Rate Decision Coming Out Soon, Lets See How That Will Affect The Market.

Bitcoin - Buy on Bullish Candlestick SignalWe're at the bottom of the grey down-sloping Fib Channel, resting on Phi 144. A bullish candlestick here is likely a high probability trade.

ICXBTC long, weekly candlestick confirmationVery nice weekly bullish candlestick reconfirmed the previous buy signal on the daily chart (engulfing bar of 29 June). Confluence with bottom of channel trend line and 1.618 fib level. Good place to enter a medium term long position.

BITCOIN touched the third bounce. Candlestick analysis. My long trade published yesterday was touched to the Tee and the close of the 4H candle was a doji , perfectly align with my zone and 78.60% As always use stop losses because the market right now is deciding what to do, but in the mean time you can play with the zones and with candlestick analysis to find confluence in the market.
"Enter correctly, let your profit run and cut your losses fast"
Remember: get profits out the table! This is a profession and you earn it, enjoy the profit my friends!

Distribution Candlestick BTC/USDWe are seeing a distribution candlestick on the Daily chart of the COINBASE:BTCUSD . Even though the candle is not closed yet, but it is very likely that this will be the candle once it's closed.
As all of you all know, BTC has spiked since the 3k zone, approximately 150% gain without a significant retracement!
FOMO has kicked in and you know the history in 2017.
Targeting a retracement of 30-40% from the current peak.

EOS 1H CANDLESTICK PATTERN. The candlestick pattern is showing that EOS is going up and will at least test the resistance if you buy at 10488 is aprox. 3% profit.

Hammer Candlestick hitting the Buy zone, 4hour chart. Hammer candlestick has hit the buy zone FX:GBPUSD and the bearish pattern looks like its reversing and breaking the trendline . Next support will be around 1.33085 , if we break this level I expect it to near 1.34400 again.

CADCHF 1D we have candlestick approve. Lets sellCADCHF 1D we have candlestick approve. Lets sell. After such long loss chf should get back on foot. Have some risk since OIL situation around world.

NZDJPY Candlestick AnalysisThis pair has printed a candlestick formation known for reversals at daily chart.
We are following the trendline breakout and pullback for joining long side.
Thank you for your support. Good Luck.

$QQQ Nasdaq Double Top - Bearish Hanging Man Candlestick$QQQ Nasdaq Double Top - Bearish Hanging Man Candlestick

Bearish up-thrust forming evening star candlestick patternWide spread up-thrust on very high volume forming an evening star candlestick pattern, signalling the forthcoming end to the current bullish trend
