Copper Equities Breaking Down, Is tthe economy?Copper is very close to losing criyical support.
If this daily chart trendline breaks, there is a big move down into the next support.
Copper Equity stocks are already teing us aa likely breakdown in the commodity is coming.
Is this base metal signaling weaker economic demand & growth?
Search in ideas for "COMMODITY"

A Bit More Downside For Silver In The Near Term?Although recently we saw a price rebound in EASYMARKETS:XAGUSD , still, the commodity remains below our 200-day EMA and a short-term downside resistance line drawn from the high of December 3rd. That said, in order to continue aiming lower, a break below the 22.51 hurdle, marked near the lows of December 13th and January 11th, would be needed. Until then, we will take a cautiously bearish approach in the near term.
If, eventually, we do see a price-drop below the 22.51 zone, this will confirm a forthcoming lower low, possibly clearing the path towards the next key support area, at 21.88, which is the lowest point of November 2023. If the bears cannot stop there, the next potential target for EASYMARKETS:XAGUSD might be near the medium-term tentative upside support line taken from the lowest point of March 2023.
Alternatively, a break of the previously mentioned downside line and a push above the 23.54 barrier may attract more buying interest. EASYMARKETS:XAGUSD could then travel to the 24.60 territory, marked by the high of December 22nd, where a temporary hold-up might occur. If the bulls continue to charge, this may result in a further move north, potentially aiming for the highest point of December, at 25.92.
Disclaimer:
easyMarkets Account on TradingView allows you to combine easyMarkets industry leading conditions, regulated trading and tight fixed spreads with TradingView's powerful social network for traders, advanced charting and analytics. Access no slippage on limit orders, tight fixed spreads, negative balance protection, no hidden fees or commission, and seamless integration.
Any opinions, news, research, analyses, prices, other information, or links to third-party sites contained on this website are provided on an "as-is" basis, are intended only to be informative, is not an advice nor a recommendation, nor research, or a record of our trading prices, or an offer of, or solicitation for a transaction in any financial instrument and thus should not be treated as such. The information provided does not involve any specific investment objectives, financial situation and needs of any specific person who may receive it. Please be aware, that past performance is not a reliable indicator of future performance and/or results. Past Performance or Forward-looking scenarios based upon the reasonable beliefs of the third-party provider are not a guarantee of future performance. Actual results may differ materially from those anticipated in forward-looking or past performance statements. easyMarkets makes no representation or warranty and assumes no liability as to the accuracy or completeness of the information provided, nor any loss arising from any investment based on a recommendation, forecast or any information supplied by any third-party.

Supercycles in commodities - i.e. Bitcoin, UraniumSupercycle - a term which is gaining popularity these days, applies to commodities. Basically what happens is surge in demand, which current supply struggles to cover, causes prices to sky-rocket from being under-valued to highly over-valued.
In my opinion Bitcoin and its' four-year cycle is the best example. The main event of the cycle is halving (halving the rewards of mining bitcoin), which is causing supply-shock and aftermath in the form of speculative bubble.
I strongly believe we are about to see a supercycle in Uranium in the following years. Spot price of that commodity is right now under-valued to such an extent Cameco (one of its largest global providers) is buying it from the spot market in order to meet the contracts and keeping some of its mines closed (waiting for the prices to rise). Currently there are about 440 active nuclear reactors and 50 being constructed (more than 10% of the actual number) mainly in China and India (respectively 16 and 6 as of March 2021). Interesting pair, isn't it? If the rest of the world does not want to stay behind they will have no choice but to follow that direction.
Nuclear energy is not opponent of wind and solar energy. It is their carbon-free companion versus the coal.
Technicals:
We are confirming the falling wedge break-out right now. If price action will succeed to do so, there might be rally much quicker than I expected when I first opened position.

Is Platinum Ready To Break Out?Looking at the technical picture of EASYMARKETS:XPTUSD on our daily chart, after reversing higher in mid-November, the commodity started forming higher lows. That said, it is struggling to build up higher highs, at the moment. However, that might change, if the price overshoots its key resistance area, roughly between the 944 and 952 levels. Until then, we will take a cautiously bullish stance.
A break above the aforementioned resistance area would confirm a forthcoming higher high, potentially clearing the path towards higher hurdles, as more buyers might see this as a good opportunity to step in. We will then target the 989 and the 995 levels, which mark the highest points of August and July respectively.
Alternatively, a break below a short-term tentative upside support line, drawn from the lowest point of November, could result in a further price drop, as it might spook some bulls from the field. Our next possible target could be the 890 zone, which is the current lowest point of December.
Disclaimer:
easyMarkets Account on TradingView allows you to combine easyMarkets industry leading conditions, regulated trading and tight fixed spreads with TradingView's powerful social network for traders, advanced charting and analytics. Access no slippage on limit orders, tight fixed spreads, negative balance protection, no hidden fees or commission, and seamless integration.
Any opinions, news, research, analyses, prices, other information, or links to third-party sites contained on this website are provided on an "as-is" basis, are intended only to be informative, is not an advice nor a recommendation, nor research, or a record of our trading prices, or an offer of, or solicitation for a transaction in any financial instrument and thus should not be treated as such. The information provided does not involve any specific investment objectives, financial situation and needs of any specific person who may receive it. Please be aware, that past performance is not a reliable indicator of future performance and/or results. Past Performance or Forward-looking scenarios based upon the reasonable beliefs of the third-party provider are not a guarantee of future performance. Actual results may differ materially from those anticipated in forward-looking or past performance statements. easyMarkets makes no representation or warranty and assumes no liability as to the accuracy or completeness of the information provided, nor any loss arising from any investment based on a recommendation, forecast or any information supplied by any third-party.

Explosion In Gold. Where To Next?It has been quite a volatile year for EASYMARKETS:XAUUSD and, judging by end of November and beginning of December activity, it continuous to be a volatile one, as we get closer to the new year. On the 4th of December we saw EASYMARKETS:XAUUSD hitting a new historic high, reaching the area near the 2144-dollar mark. This way the precious metal surpassed its previous all-time high, near the 2082-dollar mark, reached in April of this year. That said, before the EU market open on the 4th of December, the yellow metal fell back below that previous high and at the time of writing it is struggling to get back above that barrier. If EASYMARKETS:XAUUSD continues to trade below that 2082 zone, we may see a slight correction back down. That said, we may class that correction as a temporary one, before another leg of buying, as long as the price stays somewhere above a long-term tentative upside support line drawn from the lowest point of November 2022.
As mentioned above, if the price is able to stay somewhere above the 2082 hurdle, this may attract more buying interest, possibly dragging EASYMARKETS:XAUUSD towards the newly-established all-time high, at 2144. If that hurdle gets broken, this will confirm a forthcoming higher high, placing the commodity into an uncharted territory. That’s when we will use the help of our Fibonacci extension tool, in order to try and find our next possible resistance target. As we can see from our chart, the next potential target is at 61.8% extension, which is around the 2180 level.
Alternatively, a drop back below the 2048 zone could signal a possible larger correction lower. In that scenario we will start aiming for the 2009 hurdle, marked by the highest point of October. If that hurdle is not able to halt the slide, we may see EASYMARKETS:XAUUSD drifting below the psychological 2000 area, towards the 1933 level. That level marks the lowest point of November.
Disclaimer:
easyMarkets Account on TradingView allows you to combine easyMarkets industry leading conditions, regulated trading and tight fixed spreads with TradingView's powerful social network for traders, advanced charting and analytics. Access no slippage on limit orders, tight fixed spreads, negative balance protection, no hidden fees or commission, and seamless integration.
Any opinions, news, research, analyses, prices, other information, or links to third-party sites contained on this website are provided on an "as-is" basis, are intended only to be informative, is not an advice nor a recommendation, nor research, or a record of our trading prices, or an offer of, or solicitation for a transaction in any financial instrument and thus should not be treated as such. The information provided does not involve any specific investment objectives, financial situation and needs of any specific person who may receive it. Please be aware, that past performance is not a reliable indicator of future performance and/or results. Past Performance or Forward-looking scenarios based upon the reasonable beliefs of the third-party provider are not a guarantee of future performance. Actual results may differ materially from those anticipated in forward-looking or past performance statements. easyMarkets makes no representation or warranty and assumes no liability as to the accuracy or completeness of the information provided, nor any loss arising from any investment based on a recommendation, forecast or any information supplied by any third-party.

Natural Gas Commodity USANatural Gas Commodity USA, is surely a hidden gem for the next, it will sky rocket in the coming days.
#debadipb #profitsolutions

Multi Commodity Exchange Ltd.*Multi Commodity Exchange Ltd*
*MCX*
C&H Formation on Decadal Basis.
RB Formation on Monthly Basis.
Price BreakOut Needed to be Sustained.
Resistance @2136 to be Watched.
Accumulation > Distribution, Continued BuiltUp To be Watched.
*Trail SL with Upside*
*Book Profit as per Risk Appetite*
Do Your Own Research as well. This is an Opinion.
Happy Investing 😇

DJP - Commodity Index H&SHead and Shoulder formation on the Bloomberg iShares Commodity Index. Attractive trade also in the current inflationary environment for one's currency to maintain purchasing power. Target @ 37.50 corresponds to high in Aug 22.

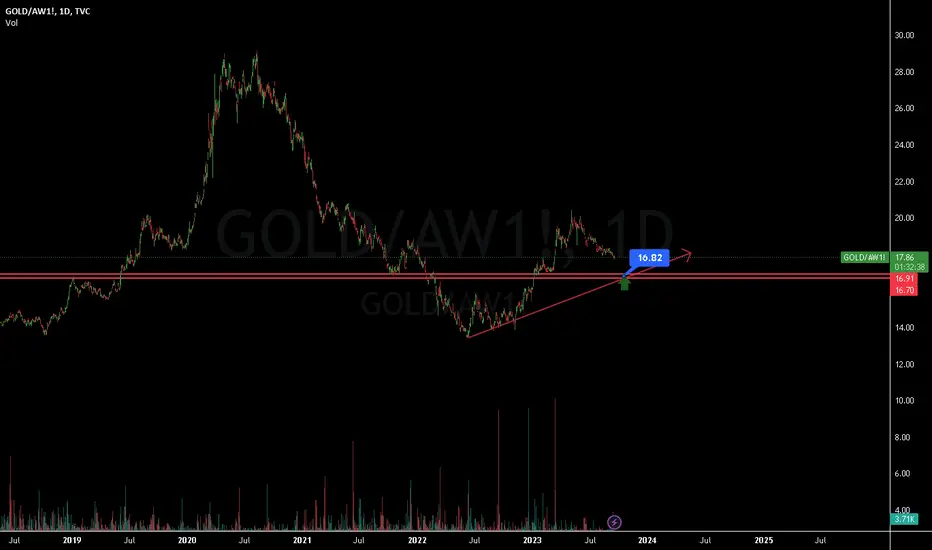
GOLD/BLOOMBERG COMMODITY INDEX Hi my SUPPORTERS , if you divide GOLD chart to BLOOOMBERG COMMODITY INDEX you clearly can see the best point to buy GOLD rather than other precious metals .......
Gooood Luuuuuck
Wheat - H4 - LongWheat is a commodity and seasons affect the wheat price.
in August wheat usually drops to the lower prices.
Now, due to the supply problems and by looking at the chart , if it is below 650$ you can buy and keep it until 685$.

SPGSCI(COMMODITY INDEX)Hi Guys look at that pretty surge up in all commodities like silver and gold .....SPGCI is commodity index.
based on my last analysis look at that how i sent you buying signal in commodities ....i have said you maybe 10Y yield and DXY is reaching resistance and we likely to see bounce in commodities here you are enjoy and please share and boost let them know what we are doing here ...
:https://www.tradingview.com/chart/US10Y/9PKF0Xs7-US10Y/
Good luck

GOLD → still bearishhello guys...
this commodity made a sharp movement and will make a three-drive pattern.
target 1: 1889
target 2: 1885
target 3: 1881
_______________________________
always do your research.
If you have any questions, you can write them in the comments below, and I will answer them.
And please don't forget to support this idea with your likes and comment

Commodities Are Waking Up From The SupportCommodities are waking up from the support with the help of China stocks and there's room for more upside.
Bloomberg commodity index with ticker AW made a nice three-wave (A)-(B)-(C) correction with the wedge pattern into wave (C). Unless it has alternatively unfolded a leading diagonal from the highs. Anyway, in both cases we can expect a recovery, at least for a temporary period of time.
Currently we can see it nicely breaking out of projected wedge pattern, which indicates for a bigger recovery, at least back to the starting point of the that wedge pattern near 120 area, or maybe even higher if correction is completed.

Gold (XAUUSD) Commodity 02/07/2021Technical Analysis :
As you can see, Gold has moved in the ascending channel. After finishing its Bearish Divergence moving, We believe that XAUUSD is accumulating and consolidating on the 61.8% Fibonacci level and get ready to shoot for the defined targets and the targets are defined with Fibonacci projection of the impulsive waves.

Natural Gas crash?Natural gas has crashed when comparing it to the DBC commodity ETF.
If a recession takes hold, demand destruction always prevails and it looks like Nat gas is pricing this in.
This price action could be a leading indicator that many other commodities may be vulnerable to a pullback.
Since Natural Gas is one of the smaller components of this ETF, it can see a large influx of capital that has to stay long by rotating out of other overbought commodities. Natural gas has broken out before the DBC and it has bottomed before the DBC. Nat Gas has the largest divergence from its peers.

Natural Gas: Commodity DivergencesThe correlation between DBC (orange line) and Nat Gas is strong.
However, Nat Gas gas does have price history where it diverges, leads & lags the average DBC price action. The white arrows on the screen display the periods where Nat Gas And DBC (in orange) diverge. Some of the divergences have lead to steep pops & drops of mean reversion.
What were seeing now is a massive divergence of about -33%, Nat gas has crashed and is the number one underperforming commodity in this basket.
Nat gas has retraced back to the Pre Covid low levels. Looking at the DBC ETF its about 33% off the Pre Covid Lows.
Over history the correlation usually tightens up and it has a long way to go to close the gap divergence. This presents one of 3 scenarios..
1. Other commodities in the basket collapse
2. Natural Gas Rallies
3. Both options (Our Base Case)

S&P 500 Commodity index / S&P 500S&P 500 Commodity index / S&P 500 Index
It is a ratio of the two indexes

Goldman Sachs Commodity index, WEEKLY TIME FRAMEIn review of Goldman Sachs commodity index on a weekly time frame, price action from the year 2000- 2008 is regarded as an impulse that is recognized on the chart as an A, followed by corrective price action resulting in a triangle formation (ABCDE) from the year 2008 to 2020, end of which is marked by B. As the principle of market structure highlights the significance of (impulse, correction, impulse) in completing a market cycle. 2020 onwards to a foreseeable future it is expected that an impulse is in formation resulting in C leg that is projected in the chart. It is noteworthy that an impulse should have at least 5 waves with 2 and 4 being corrective legs, and 3rd being the strongest out of 5 waves as indicated in A leg of the structure. The uptrend of an A leg is followed by a corrective price action, in this case the corrective structure put in place consisting of (ABCDE) came into play as a triangle. A fib retracement of A leg found corrective support at .786 which in my experience is often institutional way of taking out stop losses before continuation of the trend, as witnessed a strong upward price action that broke out of triangle to continue the c leg, it’s worth highlighting that traditional target of breaking out of a triangle structure in in confluence with C leg target of a bigger trend. As C leg is of an impulse, it means there should be a minimum of 5 waves inside it as projected on the chart. Although the upward trend is intact on higher time frames, I believe we are in 4th wave of c leg, meaning a correction is due before continuation of an uptrend to give us the finish of c leg. The analysis above on higher time frames compliments the price action on smaller time frames as evident below. A corrective structure of ABC is in play in the 4th leg before continuation of the uptrend. One of the characteristics of 4th leg is that it should not go below .38 fib level of the entire move. Therefore, more downside is projected to complete the ongoing structure. Ideally, we would like to see a strong bounce at the .38 fib zone followed by sideways movement as a confirmation of continuation of an uptrend.

Gold Outlook 20th March 2023Gold traded significantly higher last week, due to several key events;
1) gross market uncertainty increased as banks collapse (SVB and Credit Suisse).
2) flight toward the reserve commodity
3) weakness in the DXY
Currently, the price is retracing and is trading along the 1973 price level, with further downside expected. The price is likely to test the support level of 1956 which sits between the 23.60% and 38.20% Fibonacci retracement levels.
However, as the uptrend of Gold remains strong, anticipate the retracement to be brief with the price likely to rebound from the support to trade higher again.
The next key resistance level is at the round number level of 2,000 which was last visited in April 2022

easyMarkets Silver Daily - Quick Technical OverviewOn February 15th we mentioned there might be a possible falling wedge pattern forming, meaning that we could see some short-term advances. Indeed, the commodity broke out higher, however, in order to continue with the upside, a push above the 21.82 barrier would be needed. But even then we would only aim for the 200-day EMA, or even the 100-day EMA.
Disclaimer:
easyMarkets Account on TradingView allows you to combine easyMarkets industry leading conditions, regulated trading and tight fixed spreads with TradingView's powerful social network for traders, advanced charting and analytics. Access no slippage on limit orders, tight fixed spreads, negative balance protection, no hidden fees or commission, and seamless integration.
Any opinions, news, research, analyses, prices, other information, or links to third-party sites contained on this website are provided on an "as-is" basis, are intended only to be informative, is not an advice nor a recommendation, nor research, or a record of our trading prices, or an offer of, or solicitation for a transaction in any financial instrument and thus should not be treated as such. The information provided does not involve any specific investment objectives, financial situation and needs of any specific person who may receive it. Please be aware, that past performance is not a reliable indicator of future performance and/or results. Past Performance or Forward-looking scenarios based upon the reasonable beliefs of the third-party provider are not a guarantee of future performance. Actual results may differ materially from those anticipated in forward-looking or past performance statements. easyMarkets makes no representation or warranty and assumes no liability as to the accuracy or completeness of the information provided, nor any loss arising from any investment based on a recommendation, forecast or any information supplied by any third-party.

easyMarkets Gold Daily - Quick Technical OverviewAfter another week of declining, Gold has reached one of our targets, near the 100-day EMA. On Monday we mentioned the target in our quick morning analysis. If the commodity today remains above the that EMA, we may see a slightly rebound towards the short-term tentative downside resistance line. However, a decent fall below the 1825 hurdle could clear the path towards the 200-day EMA.
Disclaimer:
easyMarkets Account on TradingView allows you to combine easyMarkets industry leading conditions, regulated trading and tight fixed spreads with TradingView's powerful social network for traders, advanced charting and analytics. Access no slippage on limit orders, tight fixed spreads, negative balance protection, no hidden fees or commission, and seamless integration.
Any opinions, news, research, analyses, prices, other information, or links to third-party sites contained on this website are provided on an "as-is" basis, are intended only to be informative, is not an advice nor a recommendation, nor research, or a record of our trading prices, or an offer of, or solicitation for a transaction in any financial instrument and thus should not be treated as such. The information provided does not involve any specific investment objectives, financial situation and needs of any specific person who may receive it. Please be aware, that past performance is not a reliable indicator of future performance and/or results. Past Performance or Forward-looking scenarios based upon the reasonable beliefs of the third-party provider are not a guarantee of future performance. Actual results may differ materially from those anticipated in forward-looking or past performance statements. easyMarkets makes no representation or warranty and assumes no liability as to the accuracy or completeness of the information provided, nor any loss arising from any investment based on a recommendation, forecast or any information supplied by any third-party.

Copper & Stocks DivergingCopper and S&P500 is making a divergence.
Could this mean that we are going to be seeing weakness creep into the real estate market with Lumber and copper falling recently?
SPY has tracked copper closely with the rise & fall in inflation and yields.
The most used commodity in the world should provide pivotal insights into the next turn in the market.
If we do enter disinflation/deflation that's typically not positive for equties despite the "soft landing" narrative.

Ag Sector (DE and AGCO) trading inline with Ag Commodity FuturesThe peak highs in DE and AGCO during bullish markets tend to coincide with the highs in Corn Futures.
DE (Deer & Co) and AGCO are attractive growth and dividend paying stocks that do well in steady to strong economies even without strong Ag futures markets because of their exposure to the construction and infrastructure sectors . They tend to over-perform in years of Bullish Commodity Markets and Inflationary driven markets just as they have done since the 2020 lows. But just like Ag Futures, the stocks rise Fast and Fall hard. If the Funds decide to leave one (either equities or futures), the other seems to follow lower.
