Weekly coffee market 11/16/2020.Support us by consulting our free daily magazines with color stock charts and weather maps on our commodity-market-review.com website.
TECHNICAL ANALYSIS OF ARABICA COFFEE
Last week, ICE US coffee futures closed higher at 112.20 ct/lb.
Hopes for a vaccine are fuelling the markets, Moderna announced on Monday very encouraging results. The pandemic continues unabated, we have just surpassed 54 million cases worldwide, with more than 1.320 million deaths. Faced with the second wave, Europe has been confined. The United States is the most affected country with more than 246,000 deaths and more than 11 million cases, and is also taking restrictive measures such as in New Jersey and Michigan.
The end of the year marks the arrival of production from Central American countries, or Colombia, which adds downward pressure to the market.
Arabica coffee production in Colombia amounted to 1.159 million 60-kg bags, down 15% in October, compared to 2019.
In Brazil, forecasts for the next harvest are down due to the effects of drought this summer, particularly in Minas Gerais.
According to the International Coffee Organization, world coffee exports in 2019/20 fell by 4.9% to 126.9 million bags. Production in 2019/20 is estimated at 168.84 million bags, down 2.5%, and consumption is estimated to fall by 0.9% to 167.59 million bags. This would lead to a surplus of 1.24 million bags.
The price of Arabica coffee is also benefiting from concerns about the supply of Robusta coffee. Indeed, Vietnam, the largest producer of this type of coffee, is experiencing very heavy rainfall following the passage of several typhoons, which makes harvesting difficult and threatens to damage the crop.
WEATHER IN BRAZIL
90% of Brazilian coffee is grown in 4 regions: Minas Gerais, Espirito Santo, Sao Paulo and Parana.
Rainfall was below normal in October in the Brazilian coffee belt. The rains were late in coming and irreversible damage is feared for the next harvest. The rainy season has now begun. Last week the rains were below normal. It fell by 25 to 50 mm. According to the forecast, next week the rains will be in line with normal with a probability of more than 50 mm.
ICE US CERTIFIED COFFEE STOCKS
Coffee stocks are up to 1.198 million 60 kg bags, compared to 1.170 the previous week. ICE US stocks of Arabica coffee are below the five-year average. The low stocks may provide some support to the coffee price on futures contracts.
THE DOLLAR
The DXY index representing the Dollar against a basket of foreign currencies closed last week up to 92.755, after a sharp decline in early November. The U.S. elections will continue to bring volatility to the currency market. Joe Biden will be sworn in on January 20, the Senate remains Republican for now, but a second round will be held on January 5 in Georgia. There is still a lot of uncertainty about the size and date of the famous plan to support the American economy. The Fed has announced that it will increase its "firepower" if necessary. Forex traders therefore anticipate an increase in the money supply.
The pandemic is not weakening, Europe has reconfirmed itself in the face of the second wave, the United States is also taking new measures of restrictions in some states. The hope of a vaccine, with the announcement of Pfizer, calms the markets and prevents for the moment the dollar from playing its role as a safe haven. Caution is still called for, however, as many questions about vaccines remain unanswered. The dollar has a strong influence on the price of raw materials, and it will be very difficult to predict its evolution in the coming months.
Yesterday, the Brazilian Real closed lower at 0.1828. The Dollar's fall allowed the Brazilian Real to rebound. The BRL/USD pair is positively correlated with coffee futures prices. A weak Real increases the competitiveness of Brazilian producers, and encourages them to export.
Search in ideas for "COMMODITY"

Weekly cocoa market 11/16/2020.Support us by consulting our free daily magazines with color stock charts and weather maps on our commodity-market-review.com website.
TECHNICAL ANALYSIS OF COCOA
Last week, ICE U.S. cocoa futures closed higher at $2,388 a ton.
Hopes for a vaccine are fuelling markets, Moderna announced very encouraging results on Monday. The pandemic is not weakening, we have just surpassed 54 million cases worldwide, with more than 1.320 million deaths. Faced with the second wave, Europe has been confined. The United States is the most affected country with more than 246,000 deaths and more than 11 million cases, and is also taking restrictive measures such as in New Jersey and Michigan.
The 2020/21 season is off to a strong start with arrivals in Ivorian ports of 485K tons as of November 8, against 362K tons at the same period the previous season. The dry period in West Africa begins in mid-November and producers are confident. Moisture in the soils should allow for an abundant harvest until the end of January-February. Crushing reports for the third quarter were down 4.7% in Europe, down 4.02% in the USA, and down 10.1% in Asia. Reconfinement and the closure of bars and restaurants in Europe will undoubtedly weigh on the fourth quarter.
Tensions in Ivory Coast following the presidential election have resulted in 85 deaths and 500 injured since August. President Ouattara was re-elected with more than 94% of the votes. The opposition does not recognize this election, deeming a third term unconstitutional, and to call for a transitional government. The government sent police units to surround the homes of opposition leaders, including that of Henri Konan Bédié, the former president. Guillaume Soro, in exile in France, called for an army uprising. Opposition spokesman Affi N'Guessan was arrested and investigated for "conspiracy against the authority of the state" and "acts of terrorism". The Constitutional Council officially validated the election. President Ouattara and Henri Bédié, former president and opposition leader, met for an exchange of about 40 minutes, both wanting to work for peace. Ouattara noted the handing over of a passport to Laurent Gbagbo, a further step toward reconciliation.
WEATHER IN WEST AFRICA
Ivory Coast and Ghana experienced above normal rainfall in October with an average of more than 150mm. Last week's rains were also above the five-year average in most of Ivory Coast's cocoa-producing regions, with about 25-50 mm of rainfall. Forecasts in Ivory Coast and Ghana are now normal for next week, with rainfall probabilities of 25 to 50 mm. It should also be noted that the dry season usually starts in mid-November, early December.
ICE US CERTIFIED COCOA STOCKS
Cocoa stocks are down to 3254 against 3361 thousand 60 kg bags the previous week. ICE US and EU cocoa stocks rose above last season's stocks at the same time.
THE DOLLAR
The DXY index representing the Dollar against a basket of foreign currencies closed last week up to 92.755, after a sharp decline in early November. The U.S. elections will continue to bring volatility to the currency market. Joe Biden will be sworn in on January 20, the Senate remains Republican for now, but a second round will be held on January 5 in Georgia. There is still a lot of uncertainty about the size and date of the famous plan to support the American economy. The Fed has announced that it will increase its "firepower" if necessary. Forex traders therefore anticipate an increase in the money supply.
The pandemic is not weakening, Europe has reconfirmed itself in the face of the second wave, the United States is also taking new measures of restrictions in certain states. The hope of a vaccine, with the announcement of Pfizer, calms the markets and prevents for the moment the dollar from playing its role as a safe haven. Caution is still called for, however, as many questions about vaccines remain unanswered. The dollar has a strong influence on the price of raw materials, and it will be very difficult to predict its evolution in the coming months.
A low dollar is generally favorable to the dollar-denominated raw materials market.

Commodity CAD & SNB Optimism CADCHF AnalysisToday, the Swiss National Bank left its key interest rate unchanged at -0.75%. The Swiss Franc grew on optimistic Monetary Policy Assessment.
The SNB stated that “the SNB is revising down its growth forecast for the coming quarters. Over the short term, international momentum is likely to be modest. However, in the medium term the SNB expects the global economy to pick up again, not least due to monetary policy easing measures. Inflation is then expected to rise again gradually”. They also stated that “The Swiss economy continued to grow at a moderate rate in the second quarter. Developments on the labour market also remained positive. Employment figures continued to rise, and the unemployment rate remained stable at a low level.”
As a result, CADCHF saw bearish momentum. The pair has since retraced about 50% of the movement and the Canadian dollar grew due to an increase in oil prices, because of re-newed uncertainties about the risk of supply. The Canadian Dollar is a 'commodity currency' because Canada exports a large amount of natural resources, notably oil.
On the economic calendar for tomorrow there is the release of Canadian Core Retail Sales at 12:30GMT.
On the technical front, on a 4HTF, the price re-entered the Ichimoku Cloud and we failed to get a TK cross to the downside. We see that the price is very respectful to the 61.8% Fibo level around 0.74493.
We also want to note, that the price rebounded from a strong area of resistance on September the 11th when the pair formed the head on a head and shoulders pattern.
Short positions may be considered after the pair breaks the 61.8% fibo level at 0.74493, down. Target areas will become areas of resistance turned support at 0.74178, then 0.73785 followed by 0.73609.
Targets up are at the 23.6% Fibo 0.75201 and then our trend line around 0.75600.

Commodity and fianacial spreads. 17h40Hello
I am up at the moment after a few weeks. Patience. I will keep it for the time being but close just a bit.
I may have been on the wrong side somehow for this last month or so.
There is a book named - The encyclopedia of Commodity and financial spreads by Moore Research Center.
It is a good book and it can help you to fall asleep. 8-)
But i will use it as a reference somehow to open spreads. I recommend it . It talks about seasonality .
As this si a demo ac, i can not trade the futures contracts in 2019, 2020 etc. That s OK. I will use the cash market instead.


Commodity Currencies Bid into Month-End - USDCAD, AUDUSD, NZDUSDAs week, month, quarter and half year all conclude, the key commodity currencies have all breached key psychological levels today. USDCAD has slipped under 1.3100, AUDUSD has broken 0.7000 and NZDUSD has broken 0.6700.
The Loonie has had a strong month on the back of the rising Oil price. Technically USDCAD last breached the 20-day moving average back on June 3, (1.3435) and despite retracing to this key level mid-month, has since turned lower again breaching 1.3300, 1.3200 and 1.3100. It is down for a fifth consecutive day and what is now the third weekly decline out of the last four weeks, today printing a new trend low (so far) at 1.3085 and the key 161.8 Fibonacci extension. That is the lowest level seen since late January. The new low reaffirms the bear trend that’s been unfolding since early May. There could be further downside bias if the Fed remains on its overall dovish course and US-Iran tensions remain elevated, which should in turn keep oil prices underpinned. Next Support sits at 1.3050 and Resistance at 1.3170. The 200-day moving average is some significant distance away at 1.3260 and the RSI has reached the oversold zone, trading under 30.00.
The Aussie only breached the 20-day moving average this week. However, it has followed through, rising for its ninth consecutive day and trading over the previous resistance of the 50-day moving average. 0.7000 is a key level for AUDUSD, RSI is 60 and rising and with the MACD looking to close the month over the 0 Line for the first time since April 23, momentum appears to be with the AUD.
The Kiwi has had a volatile week following the RBNZ decision to leave rates unchanged on Tuesday. However, once again the momentum has rallied into month-end. Following a prolonged move down, the NZDUSD bounced from a double bottom low at 0.6490 after last week’s announcement from the FOMC. The move stalled ahead of the RBNZ, at the 38.2 Fibonacci level and key round number at 0.6550. A breach of the June high at 0.6680 has seen further moves to the 50.0 Fibonacci and 200-day Moving Average resistance zone at 0.6700-20 . Support sits at the 50-day moving average and psychological 0.6600 and 0.6525.

COMMODITY TRACKER ETF BUY + HOLDIn current market conditions we are expecting higher volatility in equities due to ongoing issues, during times like this diversification is key.
See commodity tracking fund index above for security + growth over coming months
Expecting to see $18 in the near future
I am still dollar cost averaging in equities but adding this index to portfolio is key to balancing gains going forward...

Commodity check up.A number of Commodities have been dragged lower as victims of the recent Trade War debate and some are trading down near major support. Sugar and Soybeans were two that came up as a topic at our Sydney Chapter meeting of the 'Australian Technical Analysts Association' (ATAA).
This conversation prompted me to review some commodities and my chart findings are posted in the link below. I gave Trading View a great plug at this meeting as many of the older traders were not familiar with this platform. One guy, looking over my shoulder whilst I was scrolling through the Commodities, was quite shocked to see just how extensive the list was! I am new to the platform myself and slowly getting used to it.
The link to my post is here: Commodity check up : an open post for all traders: wp.me $DBC

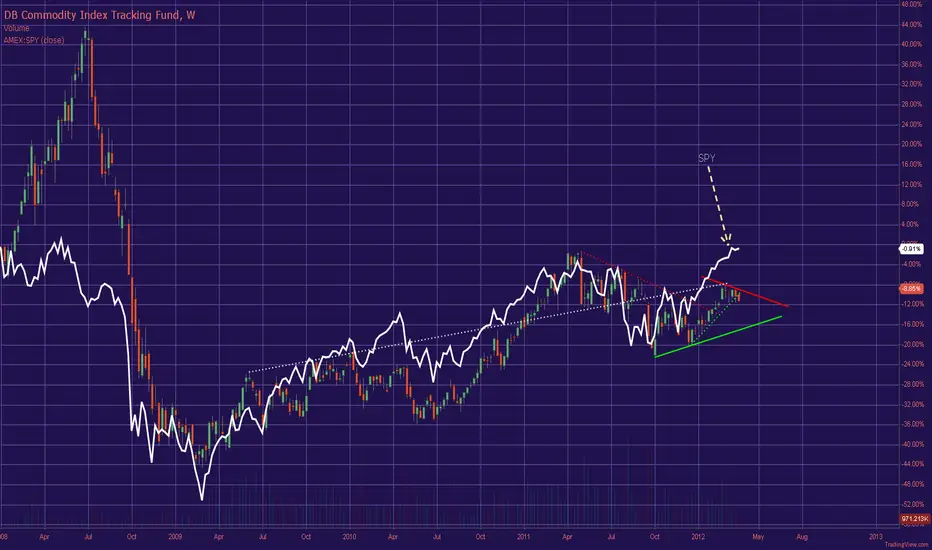
Commodity Index Analysis DBC, the commodity index ETF, is sending mix signals. The correlation between DBC and the S&P is pretty good, but while the S&P is trading about 3 % above it's 2011 high, DBC is still about 17 % below is 2011 high. It also broke it's"short" term up-trend line. Not sure what to make of this is it sending valid signals about the state of the economy or the correlation between the two is simply deteriorating ?......
CC1! @ daily @ nearest commodity (of 32) to ATL still not a buyThis is only a trading capability - no recommendation !!!
Buying/Selling or even only watching is always your own responsibility ...
.zip (with PDF`s) @ my Google Drive
4XSetUps for next wee - friday close (32 Commodities)
drive.google.com
Best regards :)
Aaron

KC1! @ daily @ nearest commodity (of 32) to ATH back on trackThis is only a trading capability - no recommendation !!!
Buying/Selling or even only watching is always your own responsibility ...
.zip (with PDF`s) @ my Google Drive
4XSetUps for next wee - friday close (32 Commodities)
drive.google.com
Best regards :)
Aaron

NG1! @ daily @ highest H/L-Range commodity (of 32) still bullishThis is only a trading capability - no recommendation !!!
Buying/Selling or even only watching is always your own responsibility ...
.zip (with PDF`s) @ my Google Drive
4XSetUps for next wee - friday close (32 Commodities)
drive.google.com
Best regards :)
Aaron

Bloomber Commodity Index - Monthly; Despite all the noise...... the song remains the same.
It is (still) all about the USD and Gold!
... because otherwise the world is swimming in over-supply!

When Might The Price Of Natural Gas Decompress?Traders that have taken a long position on Natural Gas will have been feeling lighter than air for the better part of 2021. Remarkably, the trading price of Natural Gas has rocketed up 115% since the beginning of the year, outperforming price increases in other commodities currently sitting close to record highs, Oats (up by 63.83% YTD), Copper (up by 19.65% YTD), and steel (up by 38.27% YTD). As of writing, Natural Gas is trading at $5.592 per million British thermal units, a thirteen year high for the commodity.
What Is The Reason For The Meteoric Rise In Natural Gas
An unusually scorching 2021 summer in the US drove demand for air conditioning and Natural Gas beyond normal levels, resulting in a lower stockpile of the commodity for an unusually cold winter. Following this, extreme weather conditions, such as Hurricane Ida, interrupted Natural Gas extraction in the Gulf of Mexico’s most productive zone.
Will The Price Of Natural Gas Recede?
Typically, when the price of a commodity rises, new investment will enter the market to scoop up the high prices. Regarding Natural Gas, the new investment could be from gas companies lifting output at existing gas wells or exploring new wells that will raise production. Counter-productively, the new investment and resulting lift in gas supply would help suppress the price rises in the commodity.
New investment in Natural Gas has stalled as of late. While fossil fuels will still be needed for a long time, so-called ‘Zero Carbon’ policies from governing bodies worldwide are disincentivising Natural Gas exploration. The long-term prospects of Natural Gas wells are less certain and less attractive when contending with the likes of the Biden Administration throwing its full support behind renewable energy sources as the US engages in a wide-scale upgrade to its infrastructure. One project for the Biden Administration is for the US electric grid to be powered by 50% solar within the next thirty years. Achieving this goal would severely squeeze demand for Natural Gas, which, according to the EPA, generated approximately 40% of the country’s electricity in 2020.

OJ1! @ daily @ highest H/L-Range commodity (of 32) while 2017This is only a trading capability - no recommendation !!!
Buying/Selling or even only watching is always your own responsibility ...
.zip (with PDF`s) @ my Google Drive
4XSetUps for next wee - friday close (32 Commodities)
drive.google.com
Best regards :)
Aaron

Another Move Higher for Brent Crude Oil, Towards 89.25Trend Analysis
The main view of this trade idea is on the 2-Hour Chart. The commodity Brent Crude Oil (BCO) has been in a rangebound movement since mid-October 2021, with resistance around the 86.50 price level and support observed around the 83.55 price level. Expectations are for a breakout higher towards 89.25. Failure of this move will be seen if BCO breaks below 83.
On the longer termed Daily chart, BCO has had quite a rally thus far, with a low around the 65.213 price level, the commodity is 31.7% higher. A change in trend will be determined if BCO were to decline below 81.693.
Technical Indicators
BCO is currently trading above its short (50-MA), medium (100-MA) and long (200-MA) fractal moving averages. The commodity is currently in an uptrend. The RSI is trading above 50 and there has been a positive crossover on the KST. This suggests another move higher for the commodity.
Recommendation
The recommendation will be to go long at market, with a stop loss at 83.00 and a target of 89.25. This produces a risk/reward ratio of 1.14
Disclaimer
The views expressed are mine and do not represent the views of my employers and business partners. Persons acting on these recommendations are doing so at their own risk. These recommendations are not a solicitation to buy or to sell but are for purely discussion purposes.

#SUGAR The Sweet Life is Over. A Forecast for 2025-2040Hello colleagues!
Today (May 25, 2025), another article on food and the commodities market will be released, specifically focusing on sugar ICEUS:SB1! To all newcomers, welcome to my virtual den, where I dissect markets without rose-tinted glasses or any of that nonsense peddled by infogurus and mainstream analysts. This article will be long and a bit tedious, where we'll first need to quickly skim through the history of this commodity to identify the main pricing trends over the last ten centuries. Then, we'll somehow link old data and translate it into current money. And all this must first be done to understand the overall picture of the development of sugarcane and then beet sugar production, and to have at least some idea of how its price fluctuated, so that in the end, we can get a more or less objective analysis with a forecast for the next 10-15 years. In other words, to more clearly understand what awaits us in the future, we must first study the past. The text will be divided into three smoothly flowing parts:
📘 Historical Data
📊 Charts and Forecast for 2025-2040
📝 Geopolitical Scenario of Events
📖 So, let's go. A very brief history of the sugar industry over the last 1000 years:
◽️ 11th-15th Centuries (1000-1500): Spread from Asia and Medieval Europe
Origin in South Asia: Sugarcane was first cultivated in South Asia (likely India) long before this period. By the 11th century, the technology for producing unrefined sugar was relatively developed in this region. Sugar originated in South Asia, where, apparently, someone was so fed up with bland life that they decided to sweeten it. And so it began...
Spread to the Middle East and Mediterranean: Arab conquests facilitated the spread of sugarcane and its processing technologies to the Middle East, North Africa, and some regions of the Mediterranean (e.g., Sicily and Spain).
Rare and Expensive in Europe : In medieval Europe, sugar remained a rare and extremely expensive commodity, accessible only to nobility and wealthy merchants. It was primarily used as a spice and medicine. Sugar trade was controlled by Arab and Italian intermediaries. Sugar was so valuable that it was not only eaten but also used as medicine. Probably, out of a sense of its own importance.
◽️ 16th-18th Centuries (1500-1800): Expansion into the New World and the Era of Slavery
Transfer of Production to America: European colonizers began actively developing sugarcane plantations in the tropical and subtropical regions of the New World (Caribbean, Brazil). Europeans realized sugar wouldn't grow in the Old World and decided to create their "sweet El Dorado" in the New World. With other people's hands, of course.
Key Role of Slavery: Sugar production was closely linked to the transatlantic slave trade. Vast numbers of Africans were forcibly transported to colonies to work on plantations. Brutal working conditions were the norm. Slavery and sugar – these were the two inseparable "partners" of that era. Sweetness was built on others' bitterness.
Caribbean – Production Hub: The Caribbean islands became the main global center for sugarcane production. Sugar expansion went hand in hand with colonial expansion. Europeans weren't just discovering new lands; they were looking for more places to plant this damn cane.
High Value of Sugar: Sugar remained an expensive and prestigious commodity, mainly accessible to the upper echelons of society in Europe. It was used as a sweetener, spice, and even medicine.
Increased Accessibility in Europe: Increased production in the colonies made sugar more accessible in Europe, though it still remained relatively expensive.
Discovery of Beet Sugar: In the 18th century, sucrose was discovered in sugar beet, laying the groundwork for an alternative source.
◽️ 19th Century (1800-1900): The Beet Sugar Revolution and Abolition of Slavery
Triumph of Sugar Beet: A key development was the growth and spread of sugar production from sugar beet in Europe. The discovery by chemist Andreas Marggraf in the 18th century and subsequent developments led to the creation of industrial technology. This allowed European countries to reduce their dependence on colonial cane sugar. Beet replaced cane like diesel replaced steam — less romantic, but far more efficient. Colonial planters gnashed their teeth.
Abolition of Slavery: Throughout the 19th century, slavery was gradually abolished in most colonies, leading to changes in labor organization on cane plantations. The abolition of slavery, of course, was an act of humanitarianism, but it also hiked production costs. Free labor, you know, costs money.
Increased Production and Price Decline: Thanks to beet sugar, overall global sugar production increased significantly, leading to a gradual decline in prices and making it more accessible to broader segments of the population.
Development of Transport Infrastructure: The construction of railways and steamships facilitated the transportation of both cane and beet sugar.
Emergence of the Sugar Industry: Large sugar factories and companies specializing in sugar production and trade were formed.
◽️ 20th-21st Centuries (1900-Present): Globalization, Technologies, and New Challenges
Market Globalization: Global sugar trade became intensive, and international agreements emerged.
Development of Agrotechnologies: Mechanization, variety selection, and fertilizers dramatically increased yields.
Dominance in the Food Industry: Sugar became a key ingredient in the production of a vast number of food and beverage products. Today, sugar is crammed everywhere – from ketchup to bread. Apparently, manufacturers believe our lives aren't "sweet" enough without it.
Consumption Growth: Sugar became an integral part of diets in many countries, used in the food industry to produce a huge variety of products.
Focus on Sustainability and Health: Modern trends include combating overconsumption, seeking sustainable production methods, and developing the market for alternative sweeteners.
◽️ 21st Century (2000-Present): New Trends and the Future
Combating Overconsumption: Governments and health organizations in many countries introduce measures to limit sugar consumption (e.g., taxes on sugary drinks, product labeling). Combating overconsumption? That's like tobacco companies releasing "light" cigarettes. Hypocrisy in its purest form.
Growing Demand for Natural Sweeteners: Consumers show greater interest in natural sugar alternatives such as stevia, erythritol, xylitol.
Market Volatility: Sugar prices remain subject to fluctuations due to weather conditions, political factors, and changes in global supply and demand.
Biotechnologies: Research in biotechnologies may lead to new ways of producing sugar or its substitutes.
📌 Summary: Over the last 1000 years, sugar has come a long way from a rare Eastern spice to one of the most common commodities in the world, playing a significant role in the history of trade, colonization, slavery, and the development of the food industry. Today, the industry faces new challenges related to consumer health and production sustainability. Corporations first cram us with sugar, and then preach about a healthy lifestyle. Funny, isn't it? This brief history shows how the sugar industry has gone from an exclusive colonial commodity produced by slave labor to a global industry with many players and challenges.
⬜️ We've covered the very condensed history of sugar production and the general development of the global sugar industry. Now, for a broader understanding, it's also useful to know how pricing has changed over the last few centuries. Over the past 400 years, sugar prices have undergone significant fluctuations influenced by many historical events. Here are the key moments that had a substantial impact:
Era of Colonialism and Slave Trade (16th-19th centuries). Expansion of Plantations in the New World and Reduction of Production Costs and Prices: From the 16th century, European powers actively developed sugarcane plantations in their colonies in the Caribbean and South America. The massive influx of cheap (virtually free) slave labor from Africa led to a significant increase in sugar production. Mass production using slave labor made sugar more accessible in Europe, though it still remained a relatively expensive commodity.
Napoleonic Wars (early 19th century). Disruptions in Cane Sugar Supplies and Development of Beet Sugar: Conflicts in Europe disrupted maritime trade routes and sugar supplies from colonies. The need for alternative sources led to the active development of sugar production from sugar beet in continental Europe. This was an important step towards reducing dependence on cane sugar and laid the groundwork for future price reductions.
Abolition of Slavery (19th century). Increased Production Costs: The gradual abolition of slavery in the colonies led to increased labor costs on cane plantations, which could temporarily raise prices. However, it also stimulated the search for more efficient agricultural methods.
Development of Production and Transportation Technologies (19th-20th centuries). Mechanization, Variety Selection, Agrotechnologies, and Transport Improvement: The introduction of steam engines and other equipment in sugar mills and on plantations significantly increased production efficiency. The development of railways and steamships made it easier and cheaper to transport sugar both within countries and between continents, contributing to price reduction. Improvements in sugarcane and beet varieties, as well as the development of agronomic methods, led to increased yields.
World Wars (20th century). Government Regulation and Disruptions in Production and Trade : Both World War I and World War II disrupted agricultural production, transport networks, and international trade, leading to shortages and rising sugar prices. During wars, governments often imposed price controls and rationing of sugar.
Government Policy and Trade Agreements (20th-21st centuries). International Sugar Agreements, Subsidies, and Tariffs: Government support for domestic sugar beet producers and the imposition of import tariffs on cane sugar in several countries artificially maintained higher prices in the domestic market. Attempts to regulate the global sugar market through international agreements had mixed success but influenced price stability.
Changes in Supply and Demand (20th-21st centuries). Consumption Growth, Weather Conditions, and Ethanol Production Development: Increased global population and changing dietary habits (growing consumption of processed foods and beverages) led to increased demand for sugar. Droughts, floods, and other adverse weather events in key producing regions can significantly reduce harvests and cause sharp price increases. In Brazil, a significant portion of sugarcane is used for ethanol production. Changes in oil demand and prices can affect sugar production volumes and, consequently, its price.
Emergence of Sugar Substitutes and Changes in Consumer Preferences (late 20th - early 21st century): Increased awareness of the harm of excessive sugar consumption led to a growing demand for alternative sweeteners, which can have a dampening effect on sugar price increases. Consumers' growing desire for healthier lifestyles and reduced sugar consumption may, in the long term, affect demand and prices.
◻️ These key historical moments illustrate the complex interplay of political, economic, social, and technological factors that have shaped the price of this important commodity over centuries. So, from the above factors, we can identify general trends:
1200-1500s: During these centuries, sugar in Europe was an exotic import, mainly from the Middle East and Mediterranean regions. It was a luxury item, costing very dearly in relation to precious metals like silver. The amount of sugar one could buy for an ounce of silver was negligible.
1500-1600s: With the beginning of sugarcane cultivation in the New World, especially by the Portuguese and Spanish, sugar supply in Europe gradually increased. However, it remained relatively expensive.
1600-1700s: The expansion of sugar plantations in the Caribbean, based on slave labor, led to a more significant increase in sugar production and availability in Europe. This era likely marked a more noticeable decline in sugar's price relative to silver compared to previous centuries. Research shows that in the latter part of this period, especially in places like London and Amsterdam, more detailed price records, expressed in silver weight per kilogram of sugar, began to appear.
1700-1800s: The trend of increasing sugar production and declining relative price likely continued into the 18th century. The growth of colonial economies, largely based on sugar production, made it more accessible.
1800-1900s: The 19th century witnessed the rise of beet sugar production in Europe and further expansion of cane sugar cultivation. This led to a significant drop in sugar prices relative to precious metals. Silver retained its value, while sugar became a mass-market commodity. By the end of this period, a significant amount of sugar could be bought for an ounce of silver compared to earlier centuries.
2000s: In the modern era, sugar is a widely produced and relatively inexpensive commodity. The amount of sugar that could be bought for an ounce of silver would be very substantial compared to any of the earlier periods.
The general trend shows a sharp decline in the relative price of sugar to silver over recent centuries, from an extremely rare and expensive commodity to a widely available one. The most significant shifts occurred after the colonization of America and the rise of beet sugar production.
⬜️ So, to get at least some approximate idea of changes in sugar prices over the past few centuries, let's try to mentally exchange weight for weight, i.e., exchange the commodity – SUGAR – for eternal real money – SILVER. To do this, we need to extract historical data on sugar price changes on the London and Amsterdam exchanges from 1650 to 1820.
For analysis, I've used a chart of refined sugar , which is more stable and shows prices in London and Amsterdam from 1650 to 1820, expressed in grams of silver per kilogram of sugar . That is, the chart shows how many grams of silver one kilogram of sugar cost. If you carefully study the chart, you can conclude that the price of refined sugar in London from 1650 to 1790 was relatively stable, fluctuating around 10-15 grams of silver per 1 kg of sugar. In such cases, one could say that 1 kg of sugar in London cost 0.3-0.5 ounces of silver. Let's convert this to current money:
🧮 Conversion to ounces:
One ounce contains 31.1035 grams of silver.
If 1 kg of sugar cost 10 grams of silver, that is 10 / 31.1035 ≈ 0.32 ounces of silver per 1 kg of sugar.
If 1 kg of sugar cost 15 grams of silver, that is 15 / 31.1035 ≈ 0.48 ounces of silver per 1 kg of sugar.
🧮 Conversion to current money:
As of today, the price of one ounce of silver is approximately 33 US dollars.
If 1 kg of sugar cost 0.32 ounces of silver, then in current money terms, it would be 0.32 * 33 ≈ 10.56 US dollars per 1 kg of sugar.
If 1 kg of sugar cost 0.48 ounces of silver, then in current money terms, it would be 0.48 * 33 ≈ 15.84 US dollars per 1 kg of sugar.
Summary: Based on the assumption that in the 1700s, 1 kg of refined sugar in London cost, on average, between 10 and 15 grams of silver, and using the current silver price, one can roughly estimate the cost of 1 kg of sugar in London to be equivalent to approximately $10.56 to 15.84USD, which is very expensive compared to the current 0.40/kg. It is important to emphasize that this is a very rough estimate and it does not account for many factors, such as:
Purchasing power of silver in the 1700s: Silver had a completely different purchasing power 300 years ago compared to today.
Gold to silver ratio: Today, the gold to silver ratio is much higher than in the 18th century, and for the last 20 years, it has fluctuated around ⚖️70-100:1, compared to when it was around ⚖️15:1 then. This indicates that silver is 5-6 times cheaper relative to gold now than it was in the 1700s-1800s.
Quality of sugar: Refined sugar 300 years ago might have differed in quality from modern sugar.
Regional differences: Prices could vary significantly in different parts of the world.
Transportation costs and taxes: These factors could significantly affect the final price of sugar.
Nevertheless, the calculation provides some insight into how expensive refined sugar was in those times compared to today, when it has become a much more accessible commodity.
◻️ Let's continue. Analyzing these two historical charts, it's also worth commenting on the jump in the price of refined sugar on the London exchange during the Napoleonic Wars (early 1800s) to around 20 grams of silver per 1 kg of sugar. Based on historical contexts and general trends of commodity markets during wars, it's important to say that military conflicts often lead to disruptions in trade routes, commodity shortages, and, as a consequence, rising prices. Now let's convert the maximum price of those distant times into current money:
🧮 Price in silver: 20 grams per 1 kg of sugar.
Conversion to ounces: 20 grams / 31.10 grams/ounce ≈ 0.64 ounces of silver per 1 kg of sugar.
Conversion to US dollars (at current silver price): 0.64 ounces * $33/ounce ≈ $21.22 US dollars per 1 kg of sugar.
📌 Thus, if we assume that the price of refined sugar in London during the Napoleonic Wars indeed rose to 20 grams of silver per 1 kg, then in current money terms, this would amount to approximately $21 US dollars per 1 kg of sugar. Consequently, the conclusion about a range of $20-23 US dollars per 1 kg of sugar in current money for peak prices during the Napoleonic Wars seems quite reasonable, based on the analysis of the historical chart and the current silver price. This once again emphasizes how expensive sugar was in those times compared to today. And here, we won't even attempt to fairly equalize the cost of sugar further by adjusting the silver to gold ratio to its normal historical values of ⚖️20:1, as that would then require multiplying $20-23 US dollars by another five times. The gold/silver ratio of 100:1 today is a slap in the face of history, when silver was valued much higher. This is another sign of the impending revaluation of everything! But nonetheless, we can make a modest mark on the current price chart, where approximately $23 is the ATH (all-time high) since the early 1800s.
⬜️ Silver is noble, of course, but let's come down to earth and look at prices in the currency we (still, for now) all pay with 💵💶. Another historical chart I found online (on Trading Economics) provides a historical chart of sugar prices from 1912 to the present, displaying data in cents per pound. Evaluating sugar prices in US dollars since the creation of the Federal Reserve System (Fed) is more justified than theoretical calculations with conversions to current money, and for good reasons. Here's why:
1. Objectivity of historical data in US dollars:
▫️ Actual market prices: The chart displaying prices in cents per pound from 1912 to the present represents a record of actual market prices that prevailed in the US during that period. This data reflects the real supply and demand relationship, as well as the impact of various economic and political events at that time.
▫️ Avoiding conversion problems: Converting old prices in grams of silver to modern dollars involves many complexities and assumptions related to changes in currency purchasing power and the relative value of commodities over centuries. US dollar data, recorded at that historical moment, is a more direct reflection of sugar's value in the economy of that time.
2. Significance of the US dollar after the Fed's creation:
▫️ Currency stabilization (relatively): The Federal Reserve System was created in 1913 to ensure the stability of the US financial system. Although the US dollar has experienced inflation and devaluation since its creation, its value has been more centrally regulated compared to previous periods when the banking system was more decentralized and prone to panics.
▫️ World reserve currency: The US dollar gradually became the world's reserve currency, especially after World War II. This makes prices expressed in US dollars more significant for understanding global trade and the value of commodities, including sugar, in the long term.
▫️ Data comparability: Using the US dollar as a single currency to track prices over a long period (from 1912 to the present) ensures better data comparability and allows for a clearer view of the real dynamics of sugar prices within one economic system.
3. Limitations of theoretical calculations:
▫️ Changing purchasing power: Converting prices expressed in silver weight in the 1700s to modern dollars using the current silver price does not account for the vast changes in the purchasing power of both silver and the dollar over the past centuries. Silver in the 18th century might have had a completely different value relative to other goods and services than it does today.
▫️ Different economic systems: The economic systems of the 18th and 21st centuries differ fundamentally. Comparing prices directly, based solely on the current exchange rate, is incorrect, as it doesn't account for living standards, average incomes, the cost of other goods and services, etc.
▫️ Sugar market specifics: The sugar market over the past centuries has undergone enormous changes in production, trade, regulation, and consumption. Theoretical conversions cannot always adequately reflect these transformations.
📌 Conclusion: Using historical data on sugar prices, expressed in US dollars since the Fed's creation, is indeed a more objective and justified approach for analyzing the long-term dynamics of this commodity's prices in the American and global economy. This data reflects actual market conditions and avoids many complexities and assumptions associated with converting prices from other currencies or commodity equivalents (e.g., silver) into modern dollars. In short, today, trusting old prices in silver is like trying to understand Bitcoin's exchange rate from Sumerian tablets. Dollar data is at least somewhat anchored to the reality of the last hundred years. But nonetheless, all these data provide a general overview and a broader understanding of sugar price fluctuations over the past 300 years, and the closer the data is to our time, the more accurate and objective it is.
📈 Chart: La dolce vita è finita
Okay, enough digging in the dust of centuries. Let's look at live charts where the past screams about our future! I tried to combine a linear historical chart showing the price in cents per pound with a logarithmic chart of ICEUS:SB1! So, first, we need to highlight the following: from 1912 onwards, there was generally a decline in sugar prices, where from peak values of around 20 cents per pound of sugar in 1919, the price decreased for a long time, reaching a minimum in 1966 at 1.3 cents. In half a century, from 1919 to 1966, sugar prices fell by -93%, after which they began to reverse (correct) upwards. Then, from 1966 to 1974, the price surged by +4000%, meaning that in just eight years, the price rose 40-fold from its 1966 lows to its 1974 highs. This wave of growth, within the framework of Elliott Wave Theory, should be regarded as the first corrective wave (A) .
Next, from 1974 to the present day, a narrowing sideways consolidation has been developing, which can safely be interpreted as a wave (B) triangle . Roughly speaking, for the last 50 years, sugar prices have been "marinating" in a narrowing sideways range, which is highly likely to complete the formation of all internal waves in 2025-2026.
After which, another explosive wave of growth within wave (C) of the presumed corrective zigzag, developing since 1966, should be expected, with targets around three dollars per pound of sugar. For the expected sharp rise à la 1966-1974, a time frame up to 2040 is allocated, i.e., 15 years, but the price surge could happen faster. The broad range highlighted above, $1-5 per pound of sugar, is an approximate target to aim for over a 10-15 year horizon. In other words, over the next 10-15 years, a sharp jump in sugar prices of approximately +1000-2000%, or 10-20 times, should be expected.
📈 Additional analysis of Cocoa and Coffee charts
Few people today realize that we are entering a new 10-20 year supercycle of growth in the commodity sector and a decline/sideways movement in the high-risk stock market. And as examples to my assertion that "the sweet life" is over, it's worth considering two additional commodity charts: specifically, cocoa and coffee. These three commodity charts: ICEUS:SB1! , ICEUS:CC1! and ICEUS:KC1! , traded since the 1970s-1980s, are very similar in their wave structure, which can all be equally marked as a large 40-50 year narrowing sideways consolidation.
The main difference is only that the price of cocoa has already sharply surged upward from its forty-year sideways range by +480% since late 2022, while the price of coffee is only trying to consolidate above its resistance zone, which began forming in 1977. Since early 2024, coffee prices have also shown an explosive growth of +200%.
These two commodity charts indirectly indicate the future direction for sugar prices as well. But as always, there's a small "but." Locally, within a year or year and a half (2025-2026), against the backdrop of officially recognized recession, stock market collapse, liquidity problems in the eurodollar system, and economic downturn in developed Western economies, a correction in the food commodity market of -30-40% should first be expected. Only after the money printer is turned on (QE), can we confidently expect a new wave of growth across the entire commodities market and a new wave of inflation, respectively.
Coffee and cocoa have already shown which way the wind is blowing. Sugar is next on the runway. The rise in coffee, cocoa, and sugar prices, and indeed the expected wave of price increases in the commodities market in general, should not be viewed as a local and seemingly unrelated increase in the prices of food commodities, raw materials, and precious metals against the US dollar, but rather as the depreciation of money in an era of global debt crisis culmination, geopolitical instability, high inflation, and the reformatting of the old liberal world order. With the transition to a new digital economy, a new currency world, and a new world order.
📈 Analyzing the Main Chart
Let's move on. Now it's time to switch to more familiar units of measurement and weight for residents of Europe. For this, the main live chart presented displays the price of sugar in dollars per kilogram. On this chart, for a general understanding of price dynamics, we should mark two points: 1800 and 1966. To determine the minimum price in 1966, let's solve a small problem:
🧮 We know that the minimum price in 1966 was 1.3 cents per 1 pound.
1 pound = 0.4535 kilograms.
First, let's find the cost of 1 kg in cents:
1.3 cents / 0.4535 kg ≈ 2.86 cents per kg.
Now, let's convert cents to dollars:
2.86 cents / 100 = 0.0286 dollars per kg.
Thus, 1.3 cents per pound is equivalent to approximately 0.0287 dollars per kilogram of sugar in 1966.
So, let's establish this: around 1800, the price of refined sugar on the London exchange reached its peak (ATH), which is equivalent to approximately $21-23 US dollars per 1kg when converted to current money. And in 1966, the minimum price for sugar in the USA was a pproximately $0.03 per 1kg . Thus, two important time points with approximate prices have been determined:
📍 1800 (ATH): ≈ $23 per 1 kg
📍 1966 (minimum): ≈ $0.03 per 1 kg
📍 2025 (present): ≈ $0.40
This shows a colossal difference in sugar prices over this period, reflecting changes in production, trade, accessibility, and the purchasing power of money. Sugar, from a relatively expensive commodity in the early 19th century, became significantly cheaper by the mid-20th century.
◻️Now, let's solve one last problem that will finally put all the pieces together: how much did one kg of sugar cost in grams of silver in 1966, and how much does it cost today? So:
🧮 Calculating the cost of 1 kg of sugar in grams of silver in 1966:
The price of sugar (SB1) in 1966 was 1.3 cents/pound or ∼0.03 per 1 kg.
The price of silver (XAG) in 1966 was 1.30 per ounce.
1 ounce of silver = 31.10 grams.
If 31.1 grams of silver cost 1.30, then 1 gram of silver cost 1.30/31.1 grams≈0.041 $/gram.
How many grams of silver could you buy for 0.03 (the cost of 1 kg of sugar)?
0.03$/0.041$/gram≈0.7177 grams of silver.
Summary: If in 1966, 1 kg of sugar cost $0.03, and silver was $1.30 per ounce, then 1 kilogram of sugar cost approximately 0.72 grams of silver . In any case, 0.72 grams of silver per kilogram of sugar is extremely low compared to historical prices of 10-20 grams of silver per kilogram. This only strengthens the argument about how drastically the price of sugar plummeted by the mid-20th century when measured in (real money) grams of silver. Let's move on; now we'll find out how many grams of silver 1 kg of sugar costs today:
🧮 Calculating the cost of 1 kg of sugar in grams of silver today:
Price of silver (XAG): $33 per ounce.
Price of sugar (SB1): 17.5 cents per pound or ≈0.38/kg.
1 ounce of silver = 31.10 grams.
If 31.10 grams of silver cost $33, then 1 gram of silver costs: 33$/ounce/31.10 grams/ounce≈1.061 $/gram.
How many grams of silver can be bought for 0.38 (the cost of 1 kg of sugar)?
Cost of 1 kg of sugar in grams of silver: 0.38$/kg/1.061$/gram≈0.36 grams of silver/kg.
Final Conclusion: In 1966, 1 kilogram of sugar cost approximately 0.72 grams of silver. Today, at current prices (May 2025), 1 kilogram of sugar costs approximately 0.36 grams of silver. Paradox! It turns out that even now, after the rise in sugar prices in dollars, 1 kg of sugar still costs significantly less silver (by weight) than in 1966. Okay, let's mark this important historical moment!
🔀The Sugar Price Phenomenon: Dollars VS Silver
In US dollars: From 1966 (when the price was $0.03/kg) to today (approximately $0.38/kg), sugar has risen by more than +1000% or twelve times, which seems like an enormous increase.
In grams of silver: But over the same period, sugar has fallen by half, from 0.72 grams of silver in 1966 to 0.36 grams of silver per 1kg of sugar today.
Thus, important time points for the ⚖️silver/sugar ratio are defined:
📍 1800: ≈ 20 grams of silver per 1 kg
📍 1966: ≈ 0.72 grams of silver per 1 kg
📍 2025: ≈ 0.36 grams per 1 kg of sugar
❓ What does this mean?
This contrast is a powerful argument showing that the nominal price increase in US dollars is, in essence, nothing more than the depreciation of the dollar itself ! While the real value of sugar, measured in precious metal (which has maintained its purchasing power for centuries), has actually fallen. This further reinforces the idea of how "undervalued" sugar is historically; it remains extremely cheap compared to its purchasing power in silver in 1966. Furthermore, all these examples demonstratively highlight how severely silver is undervalued today and how distorted the ⚖️silver to gold ratio is, as well as how perverted the weight-for-weight barter valuation has become—that is, the exchange of real commodity sugar for real silver weight, without the involvement of cut green paper 💵 or zeros on screens 💳.
📌Conclusion of the Second Part of the Article
We can confidently state that from $\sim$1800, the cost of sugar continuously declined, reaching its bottom in 1966 at 3 cents per 1kg. Now, the 1966 minimum can be considered the starting point from which the price surged by $\sim$5000%, establishing a maximum at the end of 1974 at $1.45 per kilogram of sugar. This entire rise should be interpreted as wave (A) of a large correction to the decline from 1800. For the next 50 years, the price was confined in a sideways consolidation, which should be interpreted as a massive triangle within wave (B), whose internal structures are almost fully complete. This "sweet slumber" lasting half a century is coming to an end.
In the next 10-15 years, a sharp breakout upwards from this narrowing consolidation should be expected, with targets around $5 per kilogram of sugar. The expected sharp price increase from 2025-2026, from $0.30 into the $3-10 range—that is, by +1000-3000%—will be considered wave (C) of the large correction that began in 1966. In other words, after a prolonged 150-year wave of declining sugar prices (from $\sim$1800 to 1966), a counter-trend upward movement began in 1966 as part of a correction to the decline, whose final targets are roughly forecasted around five dollars by 2040, which would collectively amount to 70-80 years of growth from the 1966 minimum, if the entire growth from 0.03 is considered within the framework of a correction to the decline from the 1800 ATH.
Based on all of the above, we can move on to the forecast for the next 10-15 years. The rise in sugar prices from 1966 can be seen as the end of the "sweet life," where after the first wave of growth from 0.03 to 1.45—a 40-fold increase—a fifty-year lull followed, depicted on the chart as a narrowing triangle. Next, we should expect a sharp uncoiling of this "spring" that lasted half a century, with prices soaring from approximately $0.30 per 1kg into the range of $5 US dollars. The highlighted range of $3 to $10 above is the projected long-term target for where the price will head in the future.
📊 Geopolitical Forecast for 2025-2040
Forecasts are thankless, but the current situation leaves no doubt: sugar prices will skyrocket! So-called "climate change", rising inflation, and geopolitical bacchanalia are the perfect catalysts for a price explosion between 2025 and 2040, mirroring the dynamics observed in 1966-1974. The global sugar market is known for its volatility, and several potential triggers could cause significant price surges. Given the escalating factors of uncertainty, such as the global debt crisis, rising inflation and unemployment, the conduct of a hybrid World War III proxy war, the probable blockage of maritime trade routes, new pandemics, "climate change," and so on, the likelihood of sharp sugar price increases in the coming decades appears very high.
◻️ Possible Triggers and Causes:
Climate Change and Extreme Weather Events: Droughts, floods, hurricanes, and other extreme weather events can severely damage sugarcane and sugar beet crops in key producing regions (Brazil, India, Thailand, EU). Climate change can lead to long-term shifts in weather patterns, making sugar production more unstable. Mother Nature, or whoever controls the weather, clearly decided not to be bored.
Geopolitical Instability and Conflicts: Wars, regional conflicts, and political instability in producing countries or transit regions can disrupt supply chains and lead to sugar shortages in the global market. Sanctions and trade wars can limit sugar exports from key countries. When cannons speak, logistics go silent. And prices rise.
Energy Crisis and Oil Prices: A sharp rise in oil prices can increase the cost of sugar production and transportation. Higher oil prices can also stimulate ethanol production from sugarcane, especially in Brazil, leading to a reduction in sugar supply for the food industry.
Global Demand Growth: Continued global population growth, especially in developing countries, can increase demand for sugar. Changes in dietary habits and increased consumption of processed foods also contribute to rising demand.
Supply and Logistics Problems: Pandemics or other global crises can disrupt port operations, transport networks, and supply chains, leading to delays and increased costs for sugar delivery.
Government Policies and Trade Restrictions: Changes in government policy, such as the introduction of export restrictions, increased import tariffs, or the abolition of subsidies, can affect world sugar prices.
Plant Diseases, Mold, and Pests: The spread of new diseases and pests resistant to existing control methods, as well as prolonged "traffic jams" at sea, can lead to significant crop losses and spoilage of goods.
Market Speculation: The activity of large speculative funds can amplify price fluctuations in the sugar market, especially in conditions of uncertainty. And of course, let's not forget our "friends" the speculators, who won't miss a chance to throw fuel on this inflationary fire.
◽️ Currently, the top 10 global sugar producers are:
Brazil: Traditionally the largest producer and exporter of sugar in the world. Sugar production in Brazil is closely linked to ethanol production from sugarcane.
India: In recent years, India has also risen to a leading position in sugar production, even surpassing Brazil in some years. India is also a major consumer of sugar.
European Union: The combined production of EU countries makes it a significant player in the global sugar market, mainly from sugar beet.
China: A major producer but also a large importer of sugar due to high domestic demand.
Thailand: Holds an important place among the largest global sugar exporters.
USA: Sugar production in the US comes from both sugar beet and sugarcane.
Pakistan: A significant sugar producer, primarily from sugarcane.
Russia: The main sugar production comes from sugar beet.
Mexico: An important sugar producer and exporter.
Australia: A major producer and exporter of cane sugar.
◽️ Key Points:
Global Production: World sugar production fluctuates around 170-190 million tons per year.
Traded Market: Approximately 30-40% of total world sugar production is traded on the global market. This traded portion is almost exclusively transported by sea for international deliveries.
Major Exporters: Countries like Brazil and Thailand, being leading exporters, ship the vast majority of their export volumes by sea.
◽️ Approximate Estimate:
Given that approximately 30-40% of global production enters the international trade market, and the primary method for international transportation of large volumes of raw materials is sea transport, we can assume that approximately 30-40% of all produced sugar is transported by sea.
🚢 Blocking maritime trade channels can have a significant impact on sugar delivery and its price, as, as we have already discussed, a significant portion of the world's sugar is transported by sea. Here are the main consequences:
Impact on Sugar Delivery:
▫️ Supply Delays: Blocking key maritime routes will lead to significant delays in sugar delivery from exporting to importing countries. This will disrupt established logistical chains.
▫️ Route Diversion: Ships will have to seek alternative, longer sea routes. This will increase transit times and, consequently, the delivery times for sugar to consumers.
▫️ Increased Transportation Costs: Longer routes mean higher fuel consumption, increased insurance premiums (especially in high-risk areas), and possible additional charges for passage through alternative channels.
▫️ Risk of Cargo Spoilage: Increased transit time can raise the risk of sugar spoilage, especially under improper storage conditions or adverse weather.
▫️ Reduced Availability: Delays and disruptions can lead to a temporary decrease in sugar availability in importing countries' markets.
Impact on Sugar Price:
▫️ Price Increase: Increased transportation costs will inevitably lead to higher prices for imported sugar. These costs will be passed on to wholesalers and retailers, and ultimately to consumers.
▫️ Supply Shortage: Supply delays and reduced sugar availability can create shortages in markets, which will also contribute to price increases. Speculators may exploit the situation, further driving up prices.
▫️ Market Volatility: The blocking of trade routes will create uncertainty in the market, leading to increased volatility in sugar prices.
▫️ Regional Price Differences: Depending on which maritime channels are blocked and which countries face the most significant supply difficulties, sugar prices can vary significantly in different regions of the world. Countries heavily dependent on imports through blocked channels will suffer the most.
▫️ Impact on the Food Industry: Rising sugar prices will impact food and beverage manufacturers who use sugar as a primary ingredient. This could lead to increased prices for finished products or the search for cheaper alternatives (e.g., artificial sweeteners).
⚓️ Examples of Critical and Key Maritime Channels:
Suez Canal: The most important route connecting Asia and Europe. Blockage could cause serious delays in sugar supplies from countries like India and Thailand to Europe and the Mediterranean. Remember the farce with the Ever Given in March 2021? That was just a rehearsal.
Strait of Malacca: A key strait for shipping goods from the Indian Ocean to the Pacific Ocean, including sugar from Thailand and Australia to China and other East Asian countries.
Panama Canal: Important for trade between the Atlantic and Pacific Oceans, affecting sugar supplies between North and South America.
Bab-el-Mandeb Strait and the Red Sea: Recently, this region has become an area of increased instability, and blockage or threats to shipping can affect sugar supplies through this important route.
Summary: The blocking (in bottlenecks) of global maritime trade channels can have serious negative consequences for sugar delivery, leading to delays, increased costs, and reduced availability, which in turn will cause a significant increase in prices in the global market. In short, the more global chaos, the sweeter life will be for sugar owners, and the more bitter for everyone else.
◻️ Scenario: Military Conflict between India and Pakistan (2025-2030)
In addition to the already described factors of geopolitical instability and climate change, a full-scale or prolonged military conflict between India and Pakistan could have a significant and multifaceted impact on global sugar prices, becoming a powerful additional trigger for their rise. As if we didn't have enough other problems, right?
Impact on Sugar Production:
▫️ Production Disruption in Key Regions: Both states are major producers of sugarcane. Military actions can directly disrupt agricultural work, the logistics of harvesting and transporting crops in border regions that may be important for sugarcane cultivation.
▫️ Resource Diversion: Military needs can lead to the diversion of financial and material resources from agriculture, including sugar production (e.g., fuel, labor, fertilizers).
▫️ Population Migration: Conflict can cause mass migration of populations from combat zones, leading to labor shortages on plantations and processing plants.
▫️ Infrastructure Destruction: Combat operations can damage or destroy key infrastructure related to the sugar industry, such as roads, railways, bridges, ports, and sugar factories.
Impact on Trade and Logistics:
▫️ Disruption of Regional and Global Supply Chains: Given India and Pakistan's strategic location and their role in regional trade, conflict could disrupt broader logistics chains in Asia, including maritime routes used to transport sugar from other countries (e.g., Thailand) to East Asia and beyond. War is the best way to create a global shortage.
▫️ Closure or Restriction of Transport Corridors: Hostilities could lead to the closure or restriction of key land and sea transport corridors used for transporting raw materials, including sugar, resulting in delays, increased transport costs, and insurance premiums.
▫️ Increased Risks for Shipping: Military presence in regional waters could increase risks for commercial shipping, including vessels carrying sugar, leading to higher freight and insurance costs.
Impact on the World Market:
▫️ Reduction in Global Supply: The combined reduction in production and disruption of exports from India and Pakistan, as major producers, will lead to a reduction in the overall global sugar supply.
▫️ Increased Speculation: Military instability in a region affecting major food producers will cause concerns in global markets and trigger speculative sugar purchases, further fueling price increases.
▫️ Increased Price Volatility: The uncertainty caused by military conflict will lead to sharp fluctuations in sugar prices on global commodity exchanges.
▫️ Regional Imbalances: Countries dependent on sugar imports from India or through regional logistics chains may face shortages and sharp price increases in their domestic markets.
◻️ Scenario: Recession, Market Collapse, and Monetary Inflation as a Factor in Rising Sugar Prices (2025-2030) – Or how economic "saviors" will gut your wallet.
There are strong reasons to believe that in 2025-2026, Western economies will finally officially enter a recession, which will be accompanied by a sharp collapse in stock markets. In response, regulators (central banks such as the Fed, ECB, and Bank of England) will take decisive measures: sharply cut interest rates and launch quantitative easing (QE) programs, effectively turning on the "money printing press." Although initially, these measures aim to stabilize the financial system and stimulate the economy, they could trigger a new wave of monetary inflation between 2026 and 2030, putting additional pressure on sugar prices. And this inflation, as always, will fall on the shoulders of ordinary mortals addicted to sweets.
Initial Impact of Recession and Market Collapse (2025):
▫️ Reduced Demand: Recession leads to a decrease in consumer activity and business confidence. This can temporarily reduce demand for many goods, including sugar, especially from industrial consumers (beverage manufacturers, confectioners, etc.).
▫️ Temporary Dollar Strengthening: In conditions of global uncertainty, the US dollar often acts as a "safe-haven currency," which can temporarily make dollar-denominated commodities relatively more expensive for buyers with other currencies.
Impact of Monetary Policy (2026-2030):
▫️ Depreciation of Paper Money: Sharp cuts in interest rates and massive money emission (QE) lead to the weakening of currencies against other assets, including real assets such as raw materials. This makes sugar, traded on international markets, more expensive when converted into these currencies.
▫️ Rising Inflationary Expectations: An increase in the money supply in circulation and low interest rates can create inflationary expectations among businesses and consumers. This can lead sugar producers and sellers to factor higher inflationary risks into their prices.
▫️ Increased Production Costs: Monetary inflation leads to rising prices for energy, fertilizers, transport, and labor — key components of the cost of producing sugarcane and sugar beet. This cost pressure will be passed on to the final price of sugar.
🔁 Interaction with Other Factors:
The presented scenarios of geopolitical instability, climate change, and potential military conflict between India and Pakistan will not develop in isolation from the macroeconomic situation. A recession in Western economies and subsequent monetary stimulus can significantly amplify or alter sugar price dynamics:
Increased Inflationary Pressure: Monetary inflation caused by regulatory actions can multiply the price pressure already present due to supply problems caused by climate anomalies or geopolitical conflicts. Reduced supply amid depreciating currencies will lead to an even sharper rise in imported sugar prices.
Limited Investment in Production: Recession can lead to reduced investment in expanding and modernizing the sugar industry due to decreased business activity and uncertain economic prospects. This can limit the market's ability to respond to growing demand or supply disruptions, exacerbating shortages and pushing prices up.
Impact on Purchasing Power: Recession and rising unemployment reduce the purchasing power of the population. Amid rising sugar prices, this could lead to reduced consumption, but also trigger social discontent and pressure on governments to regulate prices, which could create additional market imbalances.
Speculative Capital: Loose monetary policy with low interest rates can direct speculative capital into commodity markets, including the sugar market, in search of higher returns or protection against inflation. This can lead to artificial price inflation unrelated to fundamental supply and demand factors.
Energy Crisis and Monetary Inflation: If an energy crisis coincides with a period of monetary inflation, the cost of producing and transporting sugar will rise even more sharply, putting additional pressure on final prices. Higher oil prices, stimulating ethanol production, could further reduce sugar supply for the food industry during inflation.
Interaction with Trade Route Blockades: In conditions of monetary inflation, the blocking of key maritime trade routes will lead to an even more significant rise in sugar prices due to increased shipping costs and limited supply. Countries dependent on imports will face sharp price increases in their national currency due to the weakening of that currency against the dollar (the commodity trading currency).
📝 Basic Scenario: Sugar Price Surge (2025-2040) - An Echo of 1966-1974
This scenario posits a period of escalating global instability and environmental pressure that disrupts sugar production and trade, leading to sustained price increases, similar in trajectory (though not necessarily in magnitude) to the 1966-1974 period.
◽️ Phase 1: Escalation of Global Instability and Production Concerns (2025-2030)
Geopolitical Tensions and Conflicts: Persistent regional conflicts intensify, and new hotspots of instability emerge, including potential escalation of tensions in key producing regions and transit zones. The risk of military conflict between India and Pakistan poses an additional threat to regional production and logistics.
Increased Impact of "Climate Change": Extreme weather events (droughts, floods, hurricanes) become more frequent and intense in major sugarcane and sugar beet growing regions (Brazil, India, Thailand, EU), leading to reduced yields and crop losses.
Energy Crisis and Oil Prices: Volatility and potential increases in energy prices raise the cost of agricultural production, harvesting, and sugar transportation. High oil prices incentivize ethanol production from sugarcane, reducing sugar supply for the food industry.
Supply and Logistics Problems: Persistent consequences of pandemics and geopolitical tensions can lead to disruptions in port operations, transport networks, and increased shipping costs. The risk of blockades of key maritime trade routes (Suez, Malacca, Panama, Bab-el-Mandeb Straits) increases, causing delays, ship rerouting, and a sharp increase in transport expenses.
Recession in Western Economies (beginning of the period): A decline in consumer demand amid a recession may initially exert a dampening effect on prices, but this will be a temporary factor. But don't be fooled, this will only be a brief respite before the real circus begins.
◽️ Phase 2: Supply Shortages and Accelerating Price Growth (2030-2035)
Continued Production Problems: Several consecutive years of adverse weather conditions and potential military conflicts lead to a sustained decline in global sugar production and depletion of stocks.
Trade and Logistics Disruptions: Blockades of maritime routes and regional instability create significant obstacles for international sugar trade, leading to shortages in importing countries.
Growing Global Demand: Continued population growth and economic development in developing countries increase global demand for sugar.
Monetary Inflation: Central banks' actions to stimulate the economy after the recession (interest rate cuts, QE) begin to manifest as monetary inflation, weakening currencies and increasing the cost of raw materials.
Speculative Buying: Concerns about supply shortages and inflationary expectations stimulate speculative buying in commodity markets, amplifying price growth.
◽️ Phase 3: Peak Prices and Substitution Potential (2035-2040)
Sugar Becomes (Relatively) a Luxury: Persistently high prices make sugar a significant expense item for the food industry and consumers.
Increased Use of Alternatives: The high cost of sugar stimulates broader use of artificial and natural sweeteners, as well as changes in food and beverage recipes. Your body will "welcome" new chemical experiments instead of familiar sweetness.
Government Intervention : Governments of importing countries may attempt to regulate prices or introduce subsidies to mitigate the effects of high food inflation.
Impact of Military Conflict: A prolonged or expanding military conflict between India and Pakistan could lead to a catastrophic reduction in supply from this region and a further explosive price increase.
📌 Final Forecast: The presented scenario paints a picture of a potential significant increase in sugar prices between 2025 and 2040, by 10-20 times. The combination of escalating geopolitical instability, the intensifying impact of climate change, potential military conflict in a key region, and loose monetary policy after a recession creates conditions for a significant and sustained rise in sugar prices during the 2025-2040 period. While the exact scale of the increase is difficult to predict, a repetition of the price dynamics observed in 1966-1974 (a multiple increase in value) seems quite likely. Global debt is a ticking time bomb, inflation is the cancer of the economy, wars are man-made chaos, and route blockades are a chokehold on global trade. And all this will merge into a perfect storm for sugar prices!
📊 Conclusion: "The Sweet Life" Has Ended
This article, created by me (with the help of artificial intelligence), and the analysis of historical sugar price dynamics — from its exotic status to a mass-consumed commodity — and the consideration of potential triggers in the current unstable global environment, suggest that the multi-year era of relatively low sugar prices is coming to an end.
The analogy with the 70s is not just a historical reference; it's a clear scenario of what's to come. The sugar market is preparing for a repeat of that explosive growth, and you will either ride the wave or be buried beneath it. The combination of intensifying geopolitical tensions, the destabilizing impact of climate weapons climate change on global agriculture, the vulnerability of global logistics chains, rising global demand, and potential monetary inflation creates a perfect storm capable of provoking a significant and sustained increase in the price of this key commodity in the next 10-15 years. The projected ten to twenty-fold increase in prices by 2040 does not seem excessive, given the historical volatility of the sugar market and the potential strength of the interaction of the factors mentioned above. The blocking of critically important maritime trade routes could be the catalyst that pushes prices to a fundamentally new level, highlighting the vulnerability of global commodity trade.
Summarizing all discussed aspects, we can confidently state that the "sweet life", in terms of low prices for this "white powder" is over in the foreseeable future. It's time to reconsider our perception of the value of this everyday, yet strategically important commodity, and be ready for potentially significant changes in its pricing in the coming decades.
🙏 Thank you for your attention and 🚀 for the idea.
☘️ Good luck, take care!
📟 Stay in touch.

Natural Gas’s Price Is As Combustible as the Energy CommodityVolatility in markets creates opportunity, but as risk is always a function of reward, the more the upside, the greater the potential for losses. Since natural gas futures began trading on the NYMEX in 1990, more than a few market participants have lost fortunes in the market that has traded as low as $1.02 and as high as $15.65 per MMBtu.
Over five times higher since June 2020
US LNG to Asia was sold out for more than a decade
A very volatile energy commodity
Europe’s dependence on Russia causes supply issues
If prices in Europe are a guide, we could see a challenge to the 2008 and 2005 highs
The high came in 2005 when a devastating hurricane destroyed natural gas infrastructure along the US Gulf Coast at the NYMEX delivery point at the Henry Hub in Erath, Louisiana. Another storm in 2008 took the price above the $10 per MMBtu level but to a lower high. Over the next twelve years, the natural gas market changed. Massive discoveries of quadrillions of cubic feet of natural gas in the US Marcellus and Utica shale regions and technological advances in fracking and extracting natural gas from the earth’s crust caused the supplies to soar and the price to decline.
Since necessity is the mother of invention, two new demand verticals developed. Natural gas replaced coal in the US for power generation. Meanwhile, turning gas into liquid for transport beyond the US pipeline network created an export market for the energy commodity.
In 2020, the price fell to the lowest level since 1995 at below $1.50 per MMBtu. Since then, the bear has transformed into a bull.
Over five times higher since June 2020
The most recent peak in the natural gas futures arena took the price to $8.0650 on April 18.
The weekly chart shows the explosive move from the $1.44 level in late June 2020 to the April 18 high, over five and one-half times higher in less than two years. Moving to a multi-year high as the peak season for demand approaches is one thing, but this rally comes as the peak season ended in March.
US LNG to Asia was sold out for more than a decade
The natural gas price in Asia has been far above US prices for years. The domestic US natural gas market’s transformation and expanding the addressable market far beyond the US pipeline network has made the energy commodity and NYMEX natural gas futures market more sensitive to international prices and supply and demand fundamentals.
Cheniere Energy (LNG) is a leading supplier of liquefied natural gas that travels worldwide on ocean vessels. In 2021, Cheniere’s CEO told CNBC that the company was sold out of LNG for more than a decade after signing long-term supply contracts with Asian consumers. Asian prices were multiples of US prices, making the business highly profitable. Cheniere’s share price has reflected the booming demand for LNG.
LNG shares rose from $27.06 in March 2020 to the most recent high of $149.42 in March 2022. At the $135.70 level on April 22, LNG shares reflect the growing demand for their energy product. While the shares and revenues exploded higher, earnings have been elusive.
The chart shows the negative earnings trend since Q1 2021. A survey of twenty analysts on Yahoo Finance has an average price target of $149.50 for LNG shares, with forecasts ranging from $61 to $180 per share.
LNG is a leader, but the EPS issue could cause the stock to become as volatile as the natural gas price over the past week.
A very volatile energy commodity
While price ranges tend to widen at higher levels, natural gas volatility was head-spinning over the past week.
As the daily chart of May NYMEX natural gas futures highlights, after trading to a high of $8.065 per MMBtu on April 18, the price moved below the $7 level on April 19. Natural gas has never been for the faint of heart as the price has ranged from $1.02 to $15.65 per MMBtu since trading on NYMEX began in 1990. However, after over a decade of lower highs and lower lows, the trend changed in June 2020.
The long-term chart illustrates the trend changed when natural gas futures moved above the 2018 $4.929 per MMBtu high, ushering in a bullish path of least resistance for the energy commodity. The quarterly price ranges since mid-2021 are the broadest since 2008, the last time the energy commodity eclipsed the $10 per MMBtu level.
Europe’s dependence on Russia causes supply issues
The previous administration warned Germany and the EU about depending on Russia for natural gas supplies. Meanwhile, US energy policy shifted from “drill-baby-drill” and “frack-baby-frack” in January 2021 when the Biden Administration began fulfilling its campaign pledge to address climate change.
Stricter regulations, canceling pipelines, and bans on fracking and drilling on federal lands caused oil and gas output to decline. While it handed the pricing power in the oil market back to the international oil cartel and Russia, it also limited Europe’s options for natural gas supplies. While the administration took a hard line against US production, it supported a Russian natural gas pipeline to supply Europe with the energy commodity.
The February 24, 2022, invasion of Ukraine changed the world. While the US, European, and other allied countries came together with severe sanctions, Europe’s dependence on Russian gas remains a window of opportunity for the Putin government. Retaliating for other sanctions, Russia is now demanding rubles for natural gas supplies, boosting the currency despite other stringent sanctions.
The US government has leaned on companies like Cheniere to divert supplies from Asia to Europe. However, the administration’s energy policy has not supported the new US terminals to liquefy natural gas and increase supply capacity. Russia remains in the driver’s seat in European natural gas requirements and is free to drive the price higher.
If prices in Europe are a guide, we could see a challenge to the 2008 and 2005 highs
At the recent $8+ high, US natural gas futures rose to the highest price since 2008. Meanwhile, European prices have screamed higher in 2022.
The long-term chart shows ICE UK natural gas futures rose to $800 in March. Before 2021, the all-time high was at the $117 level in 2005. At $171.39 at the end of last week, European natural gas prices remain at lofty levels above the pre-2021 record peak.
Natural gas has transformed into a far more international commodity. The US lost an opportunity to supply Europe and remove cash flow from Russia before the first Russian soldier crossed Ukraine’s border on February 24. The revenue from natural gas sales to Europe is funding the first major European war since WW II.
Rising natural gas prices will fuel inflation and hit consumers in their pocketbooks in the US. Natural gas is another victim of inflation, the war in Ukraine, and US energy policy. Addressing climate change is a noble cause, but fossil fuels continue to power the world. The shift from hydrocarbons to alternative and renewable fuels is a multi-decade, not a multi-month process. The economic and geopolitical landscapes and US energy policy shift ignited a very bullish fuse in a very combustible commodity. Natural gas price explosions and implosions could be the norm instead of the exception over the coming months and years.
--
Trading advice given in this communication, if any, is based on information taken from trades and statistical services and other sources that we believe are reliable. The author does not guarantee that such information is accurate or complete and it should not be relied upon as such. Trading advice reflects the author’s good faith judgment at a specific time and is subject to change without notice. There is no guarantee that the advice the author provides will result in profitable trades. There is risk of loss in all futures and options trading. Any investment involves substantial risks, including, but not limited to, pricing volatility, inadequate liquidity, and the potential complete loss of principal. This article does not in any way constitute an offer or solicitation of an offer to buy or sell any investment, security, or commodity discussed herein, or any security in any jurisdiction in which such an offer would be unlawful under the securities laws of such jurisdiction.

CORN Bulls in Control? Retest Pullback Confirms Trend Bias🌽 CORN Institutional Edge Plan (Swing/Day Trade Setup)
🔍 Market Context
CORN (CFD on US Corn Futures) is showing signs of bullish momentum after testing a key resistance area. Institutional order flow hints at accumulation in the mid-420s region — a potential pullback zone before continuation higher.
🧭 Thief Strategy Plan — Layered Entries
This setup follows the “Thief Strategy”, a layered entry approach using multiple buy limit orders to capture volatility and improve average entry cost.
📈 Layered Buy Zones:
1️⃣ 428
2️⃣ 430
3️⃣ 432
(Traders may extend layers based on risk appetite and confirmation signals.)
🛑 Protective Stop (Thief SL): Around 424
🎯 Profit Zone (Thief TP): Around 445
🧠 Plan Insight
Expecting a resistance retest pullback to confirm the bullish structure.
Momentum aligns with higher-timeframe bias after institutional demand emerged near 420s.
Targets align with overbought resistance and prior liquidity traps — best to secure profits and protect gains as price nears 445.
💡 Note: Each trader should manage risk independently. This setup is educational only — showing how to structure a layered “Thief-style” plan, not a recommendation to buy/sell.
🔗 Correlated Assets to Watch
OANDA:WHEATUSD – Often mirrors agricultural flow shifts.
$SOYBEANUSD – Moves inversely at times; watch for divergence.
TVC:DXY – A stronger dollar can pressure commodity prices.
OANDA:SPX500USD – Risk appetite correlation; strong equities can support commodity demand.
🕵️♂️ Thief’s Key Notes
Dear Ladies & Gentlemen (Thief OG’s) — this plan shows how I structure entries, not where you should trade.
You can make money — then take money — at your own risk.
Manage your own stop-loss, target, and position sizing like a pro.
✨ “If you find value in my analysis, a 👍 and 🚀 boost is much appreciated — it helps me share more setups with the community!”
📜 Disclaimer:
This is a Thief-style trading strategy created just for fun and educational purposes.
Not financial advice. Trade responsibly.
#CORN #Commodities #Futures #InstitutionalTrading #SwingTrade #DayTrading #LayeredEntries #ThiefStrategy #SmartMoney #PriceAction #CommodityMarket #Agriculture #DXY #WHEAT #SOYBEAN #TradingView #ThiefTrader

Silver Expected to Breakout Towards 24.75Trend Analysis
The main view of this trade idea is on the 2-Hour Chart. The commodity Silver appears to have broken above 23.20 resistance from an ascending triangle setup. The support trend line was made with the higher lows of 21.50 and 22.35. Expectations are for Silver to head higher towards 24.75. Indicative stop loss is set around 22.15.
Technical Indicators
Silver is currently trading above its short (50-MA), medium (100-MA) and long (200-MA) fractal moving averages. There has been positive crossovers on the respective MAs, indicating a bullish trend move. The RSI is also currently above 50 with the KST in a positive mode.
Recommendation
The recommendation will be to go long at market, with a stop loss at 22.15 and a target of 24.75. This produces a risk/reward ratio of 1.31.
Disclaimer
The views expressed are mine and do not represent the views of my employers and business partners. Persons acting on these recommendations are doing so at their own risk. These recommendations are not a solicitation to buy or to sell but are for purely discussion purposes. I currently have a position in Silver.

XAL/USD "ALUMINIUM" Metal Market Heist Plan on Bullish🌟Hi! Hola! Ola! Bonjour! Hallo!🌟
Dear Money Makers & Robbers, 🤑 💰
Based on 🔥Thief Trading style technical and fundamental analysis🔥, here is our master plan to heist the XAL/USD "ALUMINIUM" Metal market. Please adhere to the strategy I've outlined in the chart, which emphasizes long entry. Our aim is the high-risk Red Zone. Risky level, overbought market, consolidation, trend reversal, trap at the level where traders and bearish robbers are stronger. Be wealthy and safe trade.💪🏆🎉
Entry 📈 : Traders & Thieves with New Entry A bull trade can be initiated at any price level.
However I advise placing Buy limit orders within a 15 or 30 minute timeframe. Entry from the most recent or closest low or high level should be in retest.
Stop Loss 🛑: Using the 2H period, the recent / nearest low or high level.
Goal 🎯: 2750.000 (or) Escape Before the Target
Scalpers, take note 👀 : only scalp on the Long side. If you have a lot of money, you can go straight away; if not, you can join swing traders and carry out the robbery plan. Use trailing SL to safeguard your money 💰.
Fundamental & Macro Outlook 📰🗞️
Based on the fundamental & macro analysis, I would expecting a bullish outlook for XAL/USD (Aluminum)
Demand and Supply: Aluminum demand has been rising due to its increasing use in the automotive, construction, and packaging industries. However, supply has also been growing, mainly driven by China's production.
Inventory Levels: Global aluminum inventories have been declining, which could support prices.
Production Costs: Aluminum production costs have been rising due to increasing energy costs, particularly in China.
Trade Tensions: Trade tensions between the US and China have been impacting aluminum prices, as China is a significant producer and consumer of aluminum.
Macro Analysis---
Global Economy: The global economy has been slowing down, which could negatively impact aluminum demand.
Interest Rates: Low interest rates in major economies could support aluminum prices by increasing demand for commodities.
Commodity Prices: Other commodity prices, such as copper and zinc, have been rising, which could support aluminum prices.
Currency: The US dollar has been appreciating, which could negatively impact aluminum prices.
Sentiment Metrics---
Sentiment Score: 0.15 (neutral)
Bullish Sentiment Index: 45 (out of 100)
Bearish Sentiment Index: 30 (out of 100)
Neutral Sentiment Index: 25 (out of 100)
Insights:
The overall sentiment is neutral, indicating that market participants are uncertain about the future direction of aluminum prices.
The bullish sentiment is slightly higher than the bearish sentiment, suggesting that some market participants are optimistic about aluminum prices.
The neutral sentiment is significant, indicating that many market participants are waiting for clearer market signals before making a decision.
Recommendation---
Based on the sentiment analysis, it's recommended to adopt a neutral stance on XAL/USD, with a slight bias towards a bullish trend. However, it's essential to continue monitoring market developments and adjust your strategy accordingly.
Disclaimer---Sentiment analysis is subjective and based on publicly available data. It should not be considered as investment advice. Trading commodities involves risk, and you could lose some or all of your investment. Always do your own research and consider multiple sources before making a trade.
Trading Alert⚠️ : News Releases and Position Management 📰 🗞️ 🚫🚏
As a reminder, news releases can have a significant impact on market prices and volatility. To minimize potential losses and protect your running positions,
we recommend the following:
Avoid taking new trades during news releases
Use trailing stop-loss orders to protect your running positions and lock in profits
Please note that this is a general analysis and not personalized investment advice. It's essential to consider your own risk tolerance and market analysis before making any investment decisions.
Keep in mind that these factors can change rapidly, and it's essential to stay up-to-date with market developments and adjust your analysis accordingly.
💖Supporting our robbery plan will enable us to effortlessly make and steal money 💰💵 Tell your friends, Colleagues and family to follow, like, and share. Boost the strength of our robbery team. Every day in this market make money with ease by using the Thief Trading Style.🏆💪🤝❤️🎉🚀
I'll see you soon with another heist plan, so stay tuned 🫂

SILVER Downtrend Alert! Short Trade Setup Ready for Major ProfitSILVER Commodity Technical Analysis (INDIAN Market):
On the 1-hour timeframe, Silver (Commodity) is showing a clear bearish pattern, validating a short trade entry at 95437. The price is approaching key target levels, with TP1 (92725) nearly achieved, suggesting a continuation of the downtrend in the short term.
Trade Summary:
Entry Level: 95437
SILVER Target Levels:
TP1: 92725 (nearly hit)
TP2: 88337
TP3: 83948
TP4: 81236
Stop Loss: 97631
The Risological Dotted Trendline adds further confirmation to the bearish sentiment, guiding this setup toward anticipated targets. Silver’s momentum suggests traders should watch closely as it edges toward additional profit-taking levels!
For extra safe traders, the Trailing Stop for this position is at 96,160

Corn Futures Expected to Move Lower Towards 563'4Disclaimer
The views expressed are mine and do not represent the views of my employers and business partners. Persons acting on these recommendations are doing so at their own risk. These recommendations are not a solicitation to buy or to sell but are for purely discussion purposes. At the time publishing, I have a position in Corn Futures ( ZC1!).
Trend Analysis
The main view of this trade idea is on the 2-Hour chart. ZC1! Hit some resistance around the 572’2 price level and is expected to move lower in the short term. This resistance is a lower high on the commodity and is expected to make another leg lower.
Technical Indicators
ZC1! is currently above its short (25-SMA), medium (75-SMA) and fractal moving averages. This price increase appears to be a counter trend move of an overall decline in the commodity. The RSI was overbought and is now trending lower towards the 50 level. Moreover, the KST is also displaying negative divergence as the indicator had a negative crossover.
Recommendation
The recommendation will be to go short at market. At the time of publishing ZC1! is trading around 563’4. The short- term target price is observed around the 548’6 price level, towards the medium term SMA. A stop loss is set at 572’2. This produces a risk reward ratio of 1.56.
