RUSSELL 2000 1D RANGE TRADESRanges, Descending Triangles, Triangles, & Ascending Triangle are repeatable trading chart patterns.
Triangles and ranges are consolidation chart patterns that can breakout either direction.
Ascending and descending chart patterns will have a directional bias depending on the previous incoming trend.
Each chart pattern will have defining trendlines of the support/resistance levels creating the pattern.
What ever time frame you are trading this chart pattern, wait for a candle close outside of the trendline in the direction of the breakout candle. (Our time frame preference is the Daily chart).
Add volume indicator - Volume is the amount of $ that went into a particular candle or in Forex the # of trades that took place.
Add ATR indicator - Volatility is the amount of price movement that occurred. Use the ATR to measure the price movement.
When you see descending volume bars and descending atr line (which indicates volatility) this shows
a dis-interest in traders to invest in this pair creating consolidation which creates the chart pattern.
Trade Management after there is a breakout candle close.
1 - Position size (compare volume bar to volume ma line).
a - Breakout candle must be 100% of average volume for a full position size.
b - If 75% of average volume then ½ position size.
2 - Enter two trades.
3 - SL for both trades will be 1.5 x ATR.
4 - 1st trade TP will be 1 x ATR.
5 - No TP on 2nd trade – letting profit run and adjusting SL to follow price.
6 - When 1st TP hit – move 2nd trade SL to breakeven.
7 - Adjust the 2nd trade SL to follow price.
*8 - When breakout candle is more than 1 ATR from breakout candle open.
a - Enter 1st trade at candle close with ½ position size.
b - Enter 2nd trade with a pending limit order that is 1 ATR of breakout candle open.
c – Price should pullback to that pending limit order for 2nd trade.
d – If Price returns back into chart pattern close trade before SL is hit.
Search in ideas for "Chart Patterns"

TSLA 1D DESCENDING TRIANGLE TRADEDescending Triangles, Triangles, Ascending Triangle and Ranges are repeatable trading chart patterns.
Triangles and ranges are consolidation chart patterns that can breakout either direction.
Ascending and descending chart patterns will have a directional bias depending on the previous incoming trend.
Each chart pattern will have defining trendlines of the support/resistance levels creating the pattern.
What ever time frame you are trading this chart pattern, wait for a candle close outside of the trendline in the direction of the breakout candle. (Our time frame preference is the Daily chart).
Add volume indicator - Volume is the amount of $ that went into a particular candle or in Forex the # of trades that took place.
Add ATR indicator - Volatility is the amount of price movement that occurred. Use the ATR to measure the price movement.
When you see descending volume bars and descending atr line (which indicates volatility) this shows
a dis-interest in traders to invest in this pair creating consolidation which creates the chart pattern.
Trade Management after there is a breakout candle close.
1 - Position size (compare volume bar to volume ma line).
a - Breakout candle must be 100% of average volume for a full position size.
b - If 75% of average volume then ½ position size.
2 - Enter two trades.
3 - SL for both trades will be 1.5 x ATR.
4 - 1st trade TP will be 1 x ATR.
5 - No TP on 2nd trade – letting profit run and adjusting SL to follow price.
6 - When 1st TP hit – move 2nd trade SL to breakeven.
7 - Adjust the 2nd trade SL to follow price.
*8 - When breakout candle is more than 1 ATR from breakout candle open.
a - Enter 1st trade at candle close with ½ position size.
b - Enter 2nd trade with a pending limit order that is 1 ATR of breakout candle open.
c – Price should pullback to that pending limit order for 2nd trade.
d – If Price returns back into chart pattern close trade before SL is hit.

AMD 1D RANGE TRADESRanges, Descending Triangles, Triangles, and Ascending Triangle are repeatable trading chart patterns.
Triangles and ranges are consolidation chart patterns that can breakout either direction.
Ascending and descending chart patterns will have a directional bias depending on the previous incoming trend.
Each chart pattern will have defining trendlines of the support/resistance levels creating the pattern.
What ever time frame you are trading this chart pattern, wait for a candle close outside of the trendline in the direction of the breakout candle. (Our time frame preference is the Daily chart).
Add volume indicator - Volume is the amount of $ that went into a particular candle or in Forex the # of trades that took place.
Add ATR indicator - Volatility is the amount of price movement that occurred. Use the ATR to measure the price movement.
When you see descending volume bars and descending atr line (which indicates volatility) this shows
a dis-interest in traders to invest in this pair creating consolidation which creates the chart pattern.
Trade Management after there is a breakout candle close.
1 - Position size (compare volume bar to volume ma line).
a - Breakout candle must be 100% of average volume for a full position size.
b - If 75% of average volume then ½ position size.
2 - Enter two trades.
3 - SL for both trades will be 1.5 x ATR.
4 - 1st trade TP will be 1 x ATR.
5 - No TP on 2nd trade – letting profit run and adjusting SL to follow price.
6 - When 1st TP hit – move 2nd trade SL to breakeven.
7 - Adjust the 2nd trade SL to follow price.
*8 - When breakout candle is more than 1 ATR from breakout candle open.
a - Enter 1st trade at candle close with ½ position size.
b - Enter 2nd trade with a pending limit order that is 1 ATR of breakout candle open.
c – Price should pullback to that pending limit order for 2nd trade.
d – If Price returns back into chart pattern close trade before SL is hit.

AUDNZD 1D DESCENDING CHANNEL BREAKOUT TRADESDescending Channel is a range chart pattern
Descending Triangles, Triangles, Ascending Triangle and Ranges are repeatable trading chart patterns.
Triangles and ranges are consolidation chart patterns that can breakout either direction.
Ascending and descending chart patterns will have a directional bias depending on the previous incoming trend.
Each chart pattern will have defining trendlines of the support/resistance levels creating the pattern.
What ever time frame you are trading this chart pattern, wait for a candle close outside of the trendline in the direction of the breakout candle. (Our time frame preference is the Daily chart).
Add volume indicator - Volume is the amount of $ that went into a particular candle or in Forex the # of trades that took place.
Add ATR indicator - Volatility is the amount of price movement that occurred. Use the ATR to measure the price movement.
When you see descending volume bars and descending atr line (which indicates volatility) this shows
a dis-interest in traders to invest in this pair creating consolidation which creates the chart pattern.
Trade Management after there is a breakout candle close.
1 - Position size (compare volume bar to volume ma line).
a - Breakout candle must be 100% of average volume for a full position size.
b - If 75% of average volume then ½ position size.
2 - Enter two trades.
3 - SL for both trades will be 1.5 x ATR.
4 - 1st trade TP will be 1 x ATR.
5 - No TP on 2nd trade – letting profit run and adjusting SL to follow price.
6 - When 1st TP hit – move 2nd trade SL to breakeven.
7 - Adjust the 2nd trade SL to follow price.
*8 - When breakout candle is more than 1 ATR from breakout candle open.
a - Enter 1st trade at candle close with ½ position size.
b - Enter 2nd trade with a pending limit order that is 1 ATR of breakout candle open.
c – Price should pullback to that pending limit order for 2nd trade.
d – If Price returns back into chart pattern close trade before SL is hit.

LTCUSD 1D TRIANGLE BREAKOUT TRADESDescending Triangles, Triangles, Ascending Triangle and Ranges are repeatable trading chart patterns.
Triangles and ranges are consolidation chart patterns that can breakout either direction.
Ascending and descending chart patterns will have a directional bias depending on the previous incoming trend.
Each chart pattern will have defining trendlines of the support/resistance levels creating the pattern.
What ever time frame you are trading this chart pattern, wait for a candle close outside of the trendline in the direction of the breakout candle. (Our time frame preference is the Daily chart).
Add volume indicator - Volume is the amount of $ that went into a particular candle or in Forex the # of trades that took place.
Add ATR indicator - Volatility is the amount of price movement that occurred. Use the ATR to measure the price movement.
When you see descending volume bars and descending atr line (which indicates volatility) this shows
a dis-interest in traders to invest in this pair creating consolidation which creates the chart pattern.
Trade Management after there is a breakout candle close.
1 - Position size (compare volume bar to volume ma line).
a - Breakout candle must be 100% of average volume for a full position size.
b - If 75% of average volume then ½ position size.
2 - Enter two trades.
3 - SL for both trades will be 1.5 x ATR.
4 - 1st trade TP will be 1 x ATR.
5 - No TP on 2nd trade – letting profit run and adjusting SL to follow price.
6 - When 1st TP hit – move 2nd trade SL to breakeven.
7 - Adjust the 2nd trade SL to follow price.
*8 - When breakout candle is more than 1 ATR from breakout candle open.
a - Enter 1st trade at candle close with ½ position size.
b - Enter 2nd trade with a pending limit order that is 1 ATR of breakout candle open.
c – Price should pullback to that pending limit order for 2nd trade.
d – If Price returns back into chart pattern close trade before SL is hit.

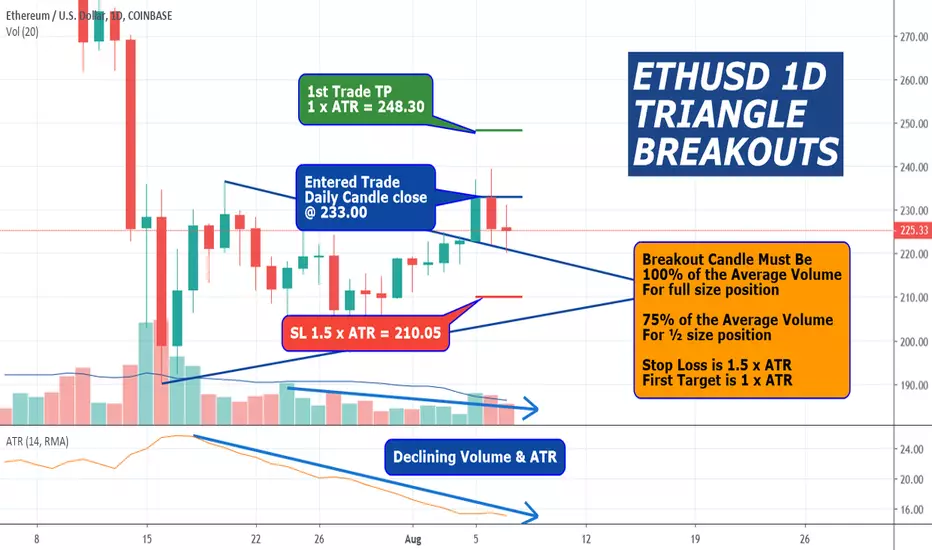
ETHUSD 1D TRIANGLE BREAKOUT TRADESDescending Triangles, Triangles, Ascending Triangle and Ranges are repeatable trading chart patterns.
Triangles and ranges are consolidation chart patterns that can breakout either direction.
Ascending and descending chart patterns will have a directional bias depending on the previous incoming trend.
Each chart pattern will have defining trendlines of the support/resistance levels creating the pattern.
What ever time frame you are trading this chart pattern, wait for a candle close outside of the trendline in the direction of the breakout candle. (Our time frame preference is the Daily chart).
Add volume indicator - Volume is the amount of $ that went into a particular candle or in Forex the # of trades that took place.
Add ATR indicator - Volatility is the amount of price movement that occurred. Use the ATR to measure the price movement.
When you see descending volume bars and descending atr line (which indicates volatility) this shows
a dis-interest in traders to invest in this pair creating consolidation which creates the chart pattern.
Trade Management after there is a breakout candle close.
1 - Position size (compare volume bar to volume ma line).
a - Breakout candle must be 100% of average volume for a full position size.
b - If 75% of average volume then ½ position size.
2 - Enter two trades.
3 - SL for both trades will be 1.5 x ATR.
4 - 1st trade TP will be 1 x ATR.
5 - No TP on 2nd trade – letting profit run and adjusting SL to follow price.
6 - When 1st TP hit – move 2nd trade SL to breakeven.
7 - Adjust the 2nd trade SL to follow price.
*8 - When breakout candle is more than 1 ATR from breakout candle open.
a - Enter 1st trade at candle close with ½ position size.
b - Enter 2nd trade with a pending limit order that is 1 ATR of breakout candle open.
c – Price should pullback to that pending limit order for 2nd trade.
d – If Price returns back into chart pattern close trade before SL is hit.
BTCUSD 1D BULLISH FLAG CHART PATTERNBull Flag chart pattern is a type of range parallel channel. Long bias
Descending Triangles, Triangles, Ascending Triangle and Ranges are repeatable trading chart patterns.
Triangles and ranges are consolidation chart patterns that can breakout either direction.
Ascending and descending chart patterns will have a directional bias depending on the previous incoming trend.
Each chart pattern will have defining trendlines of the support/resistance levels creating the pattern.
What ever time frame you are trading this chart pattern, wait for a candle close outside of the trendline in the direction of the breakout candle. (Our time frame preference is the Daily chart).
Add volume indicator - Volume is the amount of $ that went into a particular candle or in Forex the # of trades that took place.
Add ATR indicator - Volatility is the amount of price movement that occurred. Use the ATR to measure the price movement.
When you see descending volume bars and descending atr line (which indicates volatility) this shows
a dis-interest in traders to invest in this pair creating consolidation which creates the chart pattern.
Trade Management after there is a breakout candle close.
1 - Position size (compare volume bar to volume ma line).
a - Breakout candle must be 100% of average volume for a full position size.
b - If 75% of average volume then ½ position size.
2 - Enter two trades.
3 - SL for both trades will be 1.5 x ATR.
4 - 1st trade TP will be 1 x ATR.
5 - No TP on 2nd trade – letting profit run and adjusting SL to follow price.
6 - When 1st TP hit – move 2nd trade SL to breakeven.
7 - Adjust the 2nd trade SL to follow price.
*8 - When breakout candle is more than 1 ATR from breakout candle open.
a - Enter 1st trade at candle close with ½ position size.
b - Enter 2nd trade with a pending limit order that is 1 ATR of breakout candle open.
c – Price should pullback to that pending limit order for 2nd trade.
d – If Price returns back into chart pattern close trade before SL is hit.

LIGHT CRUDE OIL FUTURES 1D CONTINUATION TRIANGLE Triangles, Descending Triangles, Ascending Triangle and Ranges are repeatable trading chart patterns.
Triangles and ranges are consolidation chart patterns that can breakout either direction.
Ascending and descending chart patterns will have a directional bias depending on the previous incoming trend.
Each chart pattern will have defining trendlines of the support/resistance levels creating the pattern.
What ever time frame you are trading this chart pattern, wait for a candle close outside of the trendline in the direction of the breakout candle. (Our time frame preference is the Daily chart).
Add volume indicator - Volume is the amount of $ that went into a particular candle or in Forex the # of trades that took place.
Add ATR indicator - Volatility is the amount of price movement that occurred. Use the ATR to measure the price movement.
When you see descending volume bars and descending atr line (which indicates volatility) this shows
a dis-interest in traders to invest in this pair creating consolidation which creates the chart pattern.
Trade Management after there is a breakout candle close.
1 - Position size (compare volume bar to volume ma line).
a - Breakout candle must be 100% of average volume for a full position size.
b - If 75% of average volume then ½ position size.
2 - Enter two trades.
3 - SL for both trades will be 1.5 x ATR.
4 - 1st trade TP will be 1 x ATR.
5 - No TP on 2nd trade – letting profit run and adjusting SL to follow price.
6 - When 1st TP hit – move 2nd trade SL to breakeven.
7 - Adjust the 2nd trade SL to follow price.
*8 - When breakout candle is more than 1 ATR from breakout candle open.
a - Enter 1st trade at candle close with ½ position size.
b - Enter 2nd trade with a pending limit order that is 1 ATR of breakout candle open.
c – Price should pullback to that pending limit order for 2nd trade.
d – If Price returns back into chart pattern close trade before SL is hit.

RYANAIR 1D DESCENDING TRIANGLEDescending Triangles, Triangles, Ascending Triangle and Ranges are repeatable trading chart patterns.
Triangles and ranges are consolidation chart patterns that can breakout either direction.
Ascending and descending chart patterns will have a directional bias depending on the previous incoming trend.
Each chart pattern will have defining trendlines of the support/resistance levels creating the pattern.
What ever time frame you are trading this chart pattern, wait for a candle close outside of the trendline in the direction of the breakout candle. (Our time frame preference is the Daily chart).
Add volume indicator - Volume is the amount of $ that went into a particular candle or in Forex the # of trades that took place.
Add ATR indicator - Volatility is the amount of price movement that occurred. Use the ATR to measure the price movement.
When you see descending volume bars and descending atr line (which indicates volatility) this shows
a dis-interest in traders to invest in this pair creating consolidation which creates the chart pattern.
Trade Management after there is a breakout candle close.
1 - Position size (compare volume bar to volume ma line).
a - Breakout candle must be 100% of average volume for a full position size.
b - If 75% of average volume then ½ position size.
2 - Enter two trades.
3 - SL for both trades will be 1.5 x ATR.
4 - 1st trade TP will be 1 x ATR.
5 - No TP on 2nd trade – letting profit run and adjusting SL to follow price.
6 - When 1st TP hit – move 2nd trade SL to breakeven.
7 - Adjust the 2nd trade SL to follow price.
*8 - When breakout candle is more than 1 ATR from breakout candle open.
a - Enter 1st trade at candle close with ½ position size.
b - Enter 2nd trade with a pending limit order that is 1 ATR of breakout candle open.
c – Price should pullback to that pending limit order for 2nd trade.
d – If Price returns back into chart pattern close trade before SL is hit.

KRAFT 1D CONTINUATION TRIANGLEContinuation Triangle, Descending Triangles, Ascending Triangle and Ranges are repeatable trading chart patterns.
Triangles and ranges are consolidation chart patterns that can breakout either direction.
Ascending and descending chart patterns will have a directional bias depending on the previous incoming trend.
Each chart pattern will have defining trendlines of the support/resistance levels creating the pattern.
What ever time frame you are trading this chart pattern, wait for a candle close outside of the trendline in the direction of the breakout candle. (Our time frame preference is the Daily chart).
Add volume indicator - Volume is the amount of $ that went into a particular candle or in Forex the # of trades that took place.
Add ATR indicator - Volatility is the amount of price movement that occurred. Use the ATR to measure the price movement.
When you see descending volume bars and descending atr line (which indicates volatility) this shows
a dis-interest in traders to invest in this pair creating consolidation which creates the chart pattern.
Trade Management after there is a breakout candle close.
1 - Position size (compare volume bar to volume ma line).
a - Breakout candle must be 100% of average volume for a full position size.
b - If 75% of average volume then ½ position size.
2 - Enter two trades.
3 - SL for both trades will be 1.5 x ATR.
4 - 1st trade TP will be 1 x ATR.
5 - No TP on 2nd trade – letting profit run and adjusting SL to follow price.
6 - When 1st TP hit – move 2nd trade SL to breakeven.
7 - Adjust the 2nd trade SL to follow price.
*8 - When breakout candle is more than 1 ATR from breakout candle open.
a - Enter 1st trade at candle close with ½ position size.
b - Enter 2nd trade with a pending limit order that is 1 ATR of breakout candle open.
c – Price should pullback to that pending limit order for 2nd trade.
d – If Price returns back into chart pattern close trade before SL is hit.

BOEING 1D RANGE TRADESRanges, Descending Triangles, Triangles, and Ascending Triangle are repeatable trading chart patterns.
Ranges and Triangles are consolidation chart patterns that can breakout either direction.
Ascending and descending chart patterns will have a directional bias depending on the previous incoming trend.
Each chart pattern will have defining trendlines of the support/resistance levels creating the pattern.
What ever time frame you are trading this chart pattern, wait for a candle close outside of the trendline in the direction of the breakout candle. (Our time frame preference is the Daily chart ).
Add volume indicator - Volume is the amount of $ that went into a particular candle or in Forex the # of trades that took place.
Add ATR indicator - Volatility is the amount of price movement that occurred. Use the ATR to measure the price movement.
When you see descending volume bars and descending atr line (which indicates volatility ) this shows
a dis-interest in traders to invest in this pair creating consolidation which creates the chart pattern.
Trade Management after there is a breakout candle close.
1 - Position size (compare volume bar to volume ma line).
a - Breakout candle must be 100% of average volume for a full position size.
b - If 75% of average volume then ½ position size.
2 - Enter two trades.
3 - SL for both trades will be 1.5 x ATR.
4 - 1st trade TP will be 1 x ATR.
5 - No TP on 2nd trade – letting profit run and adjusting SL to follow price.
6 - When 1st TP hit – move 2nd trade SL to breakeven.
7 - Adjust the 2nd trade SL to follow price.
*8 - When breakout candle is more than 1 ATR from breakout candle open.
a - Enter 1st trade at candle close with ½ position size.
b - Enter 2nd trade with a pending limit order that is 1 ATR of breakout candle open.
c – Price should pullback to that pending limit order for 2nd trade.
d – If Price returns back into chart pattern close trade before SL is hit.

URBN 1D RANGE TRADERanges, Descending Triangles, Triangles and Ascending Triangle are repeatable trading chart patterns.
Ranges and Triangles are consolidation chart patterns that can breakout either direction.
Ascending and descending chart patterns will have a directional bias depending on the previous incoming trend.
Each chart pattern will have defining trendlines of the support/resistance levels creating the pattern.
What ever time frame you are trading this chart pattern, wait for a candle close outside of the trendline in the direction of the breakout candle. (Our time frame preference is the Daily chart).
Add volume indicator - Volume is the amount of $ that went into a particular candle or in Forex the # of trades that took place.
Add ATR indicator - Volatility is the amount of price movement that occurred. Use the ATR to measure the price movement.
When you see descending volume bars and descending atr line (which indicates volatility) this shows
a dis-interest in traders to invest in this pair creating consolidation which creates the chart pattern.
Trade Management after there is a breakout candle close.
1 - Position size (compare volume bar to volume ma line).
a - Breakout candle must be 100% of average volume for a full position size.
b - If 75% of average volume then ½ position size.
2 - Enter two trades.
3 - SL for both trades will be 1.5 x ATR.
4 - 1st trade TP will be 1 x ATR.
5 - No TP on 2nd trade – letting profit run and adjusting SL to follow price.
6 - When 1st TP hit – move 2nd trade SL to breakeven.
7 - Adjust the 2nd trade SL to follow price.
*8 - When breakout candle is more than 1 ATR from breakout candle open.
a - Enter 1st trade at candle close with ½ position size.
b - Enter 2nd trade with a pending limit order that is 1 ATR of breakout candle open.
c – Price should pullback to that pending limit order for 2nd trade.
d – If Price returns back into chart pattern close trade before SL is hit.

EURCAD 1D DESCENDING TRIANGLE BEARISH PATTERNDescending Triangles, Triangles, Ascending Triangle and Ranges are repeatable trading chart patterns.
Triangles and ranges are consolidation chart patterns that can breakout either direction.
Ascending and descending chart patterns will have a directional bias depending on the previous incoming trend.
Each chart pattern will have defining trendlines of the support/resistance levels creating the pattern.
What ever time frame you are trading this chart pattern, wait for a candle close outside of the trendline in the direction of the breakout candle. (Our time frame preference is the Daily chart).
Add volume indicator - Volume is the amount of $ that went into a particular candle or in Forex the # of trades that took place.
Add ATR indicator - Volatility is the amount of price movement that occurred. Use the ATR to measure the price movement.
When you see descending volume bars and descending atr line (which indicates volatility) this shows
a dis-interest in traders to invest in this pair creating consolidation which creates the chart pattern.
Trade Management after there is a breakout candle close.
1 - Position size (compare volume bar to volume ma line).
a - Breakout candle must be 100% of average volume for a full position size.
b - If 75% of average volume then ½ position size.
2 - Enter two trades.
3 - SL for both trades will be 1.5 x ATR.
4 - 1st trade TP will be 1 x ATR.
5 - No TP on 2nd trade – letting profit run and adjusting SL to follow price.
6 - When 1st TP hit – move 2nd trade SL to breakeven.
7 - Adjust the 2nd trade SL to follow price.
*8 - When breakout candle is more than 1 ATR from breakout candle open.
a - Enter 1st trade at candle close with ½ position size.
b - Enter 2nd trade with a pending limit order that is 1 ATR of breakout candle open.
c – Price should pullback to that pending limit order for 2nd trade.
d – If Price returns back into chart pattern close trade before SL is hit.

CAVCO 1D ASCENDING TRIANGLE BULLISH PATTERNAscending Triangles, Triangle, Descending Triangles and Ranges are repeatable trading chart patterns.
Triangles and ranges are consolidation chart patterns that can breakout either direction.
Ascending and descending chart patterns will have a directional bias depending on the previous incoming trend.
Each chart pattern will have defining trendlines of the support/resistance levels creating the pattern.
What ever time frame you are trading this chart pattern, wait for a candle close outside of the trendline in the direction of the breakout candle. (Our time frame preference is the Daily chart).
Add volume indicator - Volume is the amount of $ that went into a particular candle or in Forex the # of trades that took place.
Add ATR indicator - Volatility is the amount of price movement that occurred. Use the ATR to measure the price movement.
When you see descending volume bars and descending atr line (which indicates volatility) this shows
a dis-interest in traders to invest in this pair creating consolidation which creates the chart pattern.
Trade Management after there is a breakout candle close.
1 - Position size (compare volume bar to volume ma line).
a - Breakout candle must be 100% of average volume for a full position size.
b - If 75% of average volume then ½ position size.
2 - Enter two trades.
3 - SL for both trades will be 1.5 x ATR.
4 - 1st trade TP will be 1 x ATR.
5 - No TP on 2nd trade – letting profit run and adjusting SL to follow price.
6 - When 1st TP hit – move 2nd trade SL to breakeven.
7 - Adjust the 2nd trade SL to follow price.
*8 - When breakout candle is more than 1 ATR from breakout candle open.
a - Enter 1st trade at candle close with ½ position size.
b - Enter 2nd trade with a pending limit order that is 1 ATR of breakout candle open.
c – Price should pullback to that pending limit order for 2nd trade.

KRAFT 1D RANGE TRADESRanges, Triangles, Ascending Triangle, and Descending Triangles are repeatable trading chart patterns.
Ranges & Triangles are consolidation chart patterns that can breakout either direction.
Ascending and descending chart patterns will have a directional bias depending on the previous incoming trend.
Each chart pattern will have defining trendlines of the support/resistance levels creating the pattern.
What ever time frame you are trading this chart pattern, wait for a candle close outside of the trendline in the direction of the breakout candle. (Our time frame preference is the Daily chart).
Add volume indicator - Volume is the amount of $ that went into a particular candle or in Forex the # of trades that took place.
Add ATR indicator - Volatility is the amount of price movement that occurred. Use the ATR to measure the price movement.
When you see descending volume bars and descending atr line (which indicates volatility) this shows
a dis-interest in traders to invest in this pair creating consolidation which creates the chart pattern.
Trade Management after there is a breakout candle close.
1 - Position size (compare volume bar to volume ma line).
a - Breakout candle must be 100% of average volume for a full position size.
b - If 75% of average volume then ½ position size.
2 - Enter two trades.
3 - SL for both trades will be 1.5 x ATR.
4 - 1st trade TP will be 1 x ATR.
5 - No TP on 2nd trade – letting profit run and adjusting SL to follow price.
6 - When 1st TP hit – move 2nd trade SL to breakeven.
7 - Adjust the 2nd trade SL to follow price.
*8 - When breakout candle is more than 1 ATR from breakout candle open.
a - Enter 1st trade at candle close with ½ position size.
b - Enter 2nd trade with a pending limit order that is 1 ATR of breakout candle open.
c – Price should pullback to that pending limit order for 2nd trade.

LTCUSD 1D TRIANGLE BREAKOUT TRADESTriangles, Ascending Triangle, Descending Triangles and Ranges are repeatable trading chart patterns.
Triangles and ranges are consolidation chart patterns that can breakout either direction.
Ascending and descending chart patterns will have a directional bias depending on the previous incoming trend.
Each chart pattern will have defining trendlines of the support/resistance levels creating the pattern.
What ever time frame you are trading this chart pattern, wait for a candle close outside of the trendline in the direction of the breakout candle. (Our time frame preference is the Daily chart).
Add volume indicator - Volume is the amount of $ that went into a particular candle or in Forex the # of trades that took place.
Add ATR indicator - Volatility is the amount of price movement that occurred. Use the ATR to measure the price movement.
When you see descending volume bars and descending atr line (which indicates volatility) this shows
a dis-interest in traders to invest in this pair creating consolidation which creates the chart pattern.
Trade Management after there is a breakout candle close.
1 - Position size (compare volume bar to volume ma line).
a - Breakout candle must be 100% of average volume for a full position size.
b - If 75% of average volume then ½ position size.
2 - Enter two trades.
3 - SL for both trades will be 1.5 x ATR.
4 - 1st trade TP will be 1 x ATR.
5 - No TP on 2nd trade – letting profit run and adjusting SL to follow price.
6 - When 1st TP hit – move 2nd trade SL to breakeven.
7 - Adjust the 2nd trade SL to follow price.
*8 - When breakout candle is more than 1 ATR from breakout candle open.
a - Enter 1st trade at candle close with ½ position size.
b - Enter 2nd trade with a pending limit order that is 1 ATR of breakout candle open.
c – Price should pullback to that pending limit order for 2nd trade.

TRIANGLE BREAKOUT TRADES ON DAILYTriangles, Ascending Triangle, Descending Triangles and Ranges are repeatable trading chart patterns.
Triangles and ranges are consolidation chart patterns that can breakout either direction.
Ascending and descending chart patterns will have a directional bias depending on the previous incoming trend.
Each chart pattern will have defining trendlines of the support/resistance levels creating the pattern.
What ever time frame you are trading this chart pattern, wait for a candle close outside of the trendline in the direction of the breakout candle. (Our time frame preference is the Daily chart).
Add volume indicator - Volume is the amount of $ that went into a particular candle or in Forex the # of trades that took place.
Add ATR indicator - Volatility is the amount of price movement that occurred. Use the ATR to measure the price movement.
When you see descending volume bars and descending atr line (which indicates volatility) this shows
a dis-interest in traders to invest in this pair creating consolidation which creates the chart pattern.
Trade Management after there is a breakout candle close.
1 - Position size (compare volume bar to volume ma line).
a - Breakout candle must be 100% of average volume for a full position size.
b - If 75% of average volume then ½ position size.
2 - Enter two trades.
3 - SL for both trades will be 1.5 x ATR.
4 - 1st trade TP will be 1 x ATR.
5 - No TP on 2nd trade – letting profit run and adjusting SL to follow price.
6 - When 1st TP hit – move 2nd trade SL to breakeven.
7 - Adjust the 2nd trade SL to follow price.
*8 - When breakout candle is more than 1 ATR from breakout candle open.
a - Enter 1st trade at candle close with ½ position size.
b - Enter 2nd trade with a pending limit order that is 1 ATR of breakout candle open.
c – Price should pullback to that pending limit order for 2nd trade.

LTCUSD 1D TRIANGLE PATTERN Triangles, Ascending Triangle, Descending Triangles and Ranges are repeatable trading chart patterns.
Triangles and ranges are consolidation chart patterns that can breakout either direction.
Ascending and descending chart patterns will have a directional bias depending on the previous incoming trend.
Each chart pattern will have defining trendlines of the support/resistance levels creating the pattern.
What ever time frame you are trading this chart pattern, wait for a candle close outside of the trendline in the direction of the breakout candle. (Our time frame preference is the Daily chart).
Add volume indicator - Volume is the amount of $ that went into a particular candle or in Forex the # of trades that took place.
Add ATR indicator - Volatility is the amount of price movement that occurred. Use the ATR to measure the price movement.
When you see descending volume bars and descending atr line (which indicates volatility) this shows
a dis-interest in traders to invest in this pair creating consolidation which creates the chart pattern.
Trade Mangement after there is a breakout candle close.
1 - Position size (compare volume bar to volume ma line).
a - Breakout candle must be 100% of average volume for a full position size.
b - If 75% of average volume then ½ position size.
2 - Enter two trades.
3 - SL for both trades will be 1.5 x ATR.
4 - 1st trade TP will be 1 x ATR.
5 - No TP on 2nd trade – letting profit run and adjusting SL to follow price.
6 - When 1st TP hit – move 2nd trade SL to breakeven.
7 - Adjust the 2nd trade SL to follow price.
*8 - When breakout candle is more than 1 ATR from breakout candle open.
a - Enter 1st trade at candle close with ½ position size.
b - Enter 2nd trade with a pending limit order that is 1 ATR of breakout candle open.
c – Price should pullback to that pending limit order for 2nd trade.

EUR/JPY Short SetupPlease be noted that EURJPYhas evidenced the sizeable price slumps upon below mentioned candlesticks and chart patterns. For now, the trend continues to be weaker.
Technical chart and candlestick patterns formed – The stern shooting star patterns have occurred at 132.336 and 132.234 levels (on both monthly and daily terms respectively). The stiff resistance is observed at 133.236 levels.
Consequently, these bearish patterns plummet prices below 7DMA & EMAs, both leading and lagging indicators signal bearish momentum and downswings continuation.
While on the major trend also, shooting star evidences price drops below EMAs (monthly chart). For now, the current trend most likely to retrace upto 38.2% fibonacci levels, bearish swings are backed by both momentum oscillators as both leading indicators (RSI & stochastic curves) show downward convergence that signal bearish strength & momentum and weakness remains intact on the monthly terms.
Trade tips: On trading perspective, at spot reference: 128.858 levels, it is advisable to snap any abrupt rallies and bid tunnel put option spreads, use upper strikes at 129.2341 and lower strikes at 128.2280 levels, the strategy is likely to fetch leveraged yields as long as the underlying spot FX keeps dipping further until expiration.
Alternatively, we advocate shorts in futures contracts of mid-month tenors with a view to arresting potential dips.
Currency Strength Index: FxWirePro's hourly EUR spot index is flashing at -109 levels (which is bearish), while hourly JPY spot index was at 144 (bullish) while articulating at 07:30 GMT.

BTCUSD: Consolidation Is Broad Higher Low. Sign Of Strength.BTCUSD update: Price action fluctuating within 12879 to 13786 support zone while presenting another double bottom reversal formation. Even though the momentum is still bearish. this area and the range lows (11600) offer a more attractive buying opportunity for longer time horizon strategies.
The first observation to consider is that this market is in a broad triangle. If you look back at the reports I was writing during the broad sell off, I explained that is type of price action was reasonable to expect on the bigger picture. Consolidations or triangles are nothing more than trend continuation patterns and the bigger picture trend is still clearly bullish.
I keep getting questions about the "head and shoulders" patterns and why I am still bullish. If you notice, they keep forming, but the market is not falling apart like many keep saying. What people do not realize is that the context of the environment carries more weight than the chart patterns. The broad consolidation that is forming above the 10700 low is a HIGHER LOW within an environment that is generally bullish. These markets continue to grow, fundamentals are generally strong. These factors reduce the chances that a head and shoulders will take this market below 9K in my opinion. Especially since they keep developing within a broader triangle which is only setting up to eventually retest the higher part of the range.
As far as levels go, the 13786 to 12879 is the .618 support zone of the recent bullish swing. It is an area where risk/reward for swing trade and position trade longs becomes more attractive, especially since price is showing evidence of some buying activity in the form of a double bottom formation off of the 12879 boundary. Keep in mind price can break lower into the 11600 or 10700 areas which are the range lows and I will still be looking to buy.
As far as trades go, I am looking at this market from the position trading perspective. My plan is to still accumulate more as the weak hands exit their positions and attempt to lock in profits IF price retests the upper resistance zone (16350 to 17876 area). The current area also offers a swing trade opportunity long since risk can be clearly defined by the 12639 low. I do not short these markets because I do not use margin, and the spread on the futures is still much too wide to make day trading practical for my strategy at the moment. This is why I would rather build a position trade, which requires less precision while risk is controlled through sizing. Since I have been long from 13150 (I wrote about this trade weeks ago) I will not add unless price tests the 11700 or lower areas of the range.
In summary, I am writing about my perspective, strategy and how I am participating in this market. You do not have to follow it or agree. It all depends on your perspective, your plan and your risk tolerance. Some people are screaming its a short, and I will enthusiastically buy from them because I see the technical structure on the bigger picture and this market is in a position to generally go higher. When you find yourself unsure, always zoom out because getting too focused on smaller time frame moves will cause you to react more rather than anticipate and blind you to the broader opportunities. Triangles are trend continuation patterns, and the broad trend is still bullish. What is the best practice in strong markets? Buy supports because they will have a greater tendency to hold. You just have to be able to identify supports that are relevant to the magnitude of the time horizon you are willing to participate in. Supports on a 5 minute chart do not carry the same weight as supports on a 6 hour chart.
Comments and questions welcome.

AUDUSD 2018 and beyond*DJ Khaled voice* Another one...
Here we have another one of my long term birds-eye-view charts, this one is for AUDUSD. What do we have here?
Firstly, all the trend lines here are valid which means we are dealing with valid trends only! yipee! Newer newbies than me, a valid trend line = confirmed trend = clarity on the direction of market = if you keep your tits calm you make money.
Now, our key Support and resistance price ranges are clear thanks to the Swing high low support & resistance indicator by Patternsmart.com. What chart patterns do we see? Well, here we have a bearish pennant pattern. The most likely thing to happen is a breakout to the downside, however, markets will do what they want so until the break is confirmed there's nothing much here. We did get a false break to the upside from June to August of this year but that simply turned out to be that third hit on the top trend line to confirm the down trend.
So, the verdict here is long term bearishness. Unlike my other long term analysis, I slapped on Bollinger Bands on this one to really justify my bearish view. What do the BBs tell us? Well, firstly, in theory, once price touches the upper band it begins to move downwards, we can see that occurrence on that false breakout/third hit on the upper trend line, including the subsequent downward move. Secondly, when price is in a decline from the upper bands, if it crosses the middle band which is essentially a moving average, that denotes strong bearish momentum, we see that too. Thirdly, when the BBs move towards each other and seem to be squeezing price in between the bands this is a sign of market compression. Market compression often tells us that a breakout is imminent. In this case the breakout will most likely be downward since price has formed a bearish pennant (in black). December has started bullish on this pair, lets wait and see what this does for finding entries for this long term trade.
critic, refute, agree!
Mentors not Trolls!

BFLY — Butterfly Network Inc. | August 27, 2025.NYSE:BFLY #BFLY — Butterfly Network Inc. (NYSE:BFLY) | Healthcare | Medical Devices | USA | NYSE | August 27, 2025.
Executive Summary
Butterfly Network Inc. (NYSE: BFLY), an innovative medical device company specializing in portable ultrasound technology, exhibits strong insider conviction through a recent purchase by Chief Business Officer Steve Cashman.
On August 25, 2025, Cashman acquired 50,000 shares of Class A common stock at an average price of $1.64 per share, totaling $81,953 in value. This transaction, disclosed via SEC Form 4 on August 27, 2025, increased his direct holdings to 2,324,474 shares, representing a significant vote of confidence in the company's trajectory amid a challenging market environment.
Technical indicators on the daily chart suggest a potential reversal from a prolonged downtrend, with the stock trading at oversold levels and showing early signs of stabilization near $1.57. Q2 2025 financials reported record revenue of $23.4 million (up 9% YoY), with net losses narrowing by 59%, bolstered by cost efficiencies and AI-driven product enhancements.
Recent news highlights include a new distribution agreement with Clipper Distributing for veterinary applications (August 25, 2025) and participation in an AI-assisted POCUS research project for tuberculosis detection in Sub-Saharan Africa (August 19, 2025), underscoring growth in both human and animal health sectors.
Replicating Cashman's buy at approximately $1.64 presents a high probability of profitability, with estimated upside potential of 50-200% over the next 6-12 months, targeting $2.50-$5.00. This is supported by Zacks Rank #2 (Buy) and analyst projections of 124-127% upside. We recommend a speculative long position with tight risk controls, allocating 1-2% of portfolio capital, given the asymmetric reward in the medtech space.
Company Profile
Butterfly Network Inc. (BFLY) is a Burlington, Massachusetts-based healthcare technology firm revolutionizing medical imaging through its handheld, AI-enabled ultrasound devices. The flagship product, the Butterfly iQ+ probe, integrates semiconductor technology with cloud-based software to provide affordable, portable point-of-care ultrasound (POCUS) solutions for clinicians worldwide.
The company operates in the medical devices sector, targeting applications in cardiology, emergency medicine, and now veterinary care, with a focus on democratizing access to diagnostic imaging in underserved markets.
Key financial metrics as of August 27, 2025:
• Market Capitalization: $395.24 million
• Enterprise Value: $268.75 million (approx.)
• Price-to-Sales (TTM): 4.52
• Price-to-Book (MRQ): 1.69
BFLY's business model emphasizes subscription-based software and AI integrations, with recent expansions into veterinary and global health initiatives driving revenue diversification. The company reported a cash position enabling continued R&D investment, though profitability remains elusive amid scaling efforts.
Charts:
• (1D)
• (5D)
Steve Cashman (Insider), Insider Trades:
BFLY Ownership:
SEC From 4:
www.sec.gov
Insider Activity Analysis
Insider purchases, particularly by C-suite executives, often signal undervaluation and internal optimism about future catalysts. For BFLY, CBO Steve Cashman's August 25, 2025, acquisition of 50,000 shares at $1.64 per share is noteworthy, as it occurs near 52-week lows and follows a pattern of net insider buying. Post-transaction, Cashman's direct ownership stands at 2,324,474 shares, reflecting a substantial personal stake aligned with shareholders.
Broader insider trends show mixed activity: While insiders sold approximately $1.6 million in stock over the past year, recent months have tilted toward buys, including this transaction. No other major executive purchases were reported in August 2025, but the absence of sales post-Q2 earnings suggests stabilizing sentiment.
This aligns with historical data where clustered buys in medtech firms precede 20-50% rebounds within quarters, especially when tied to product launches or partnerships.
Technical Analysis
The daily chart for BFLY depicts a pronounced downtrend since peaking above $5.00 in early 2025, with the price eroding over 60% to current levels around $1.57 amid broader healthcare sector pressures. Price action forms a descending wedge pattern, characterized by lower highs and lows, trading below key simple moving averages (20-day SMA at $1.74, 50-day at $2.50, 200-day at $2.81), confirming bearish momentum.
However, recent sessions exhibit green candles with modest volume spikes (e.g., 1.44M shares on August 27), hinting at accumulation.
Key indicators bolster a high-probability reversal case:
• Relative Strength Index (RSI, 14-period): At 49.65 on the primary chart (neutral) and 38.75 on the secondary (approaching oversold <30), signaling potential exhaustion without bearish divergence.
• Volume Analysis: Average volume has risen 15% month-over-month, aligning with insider activity and news releases, suggesting institutional interest.
• Support and Resistance: Immediate support at $1.50 (recent swing low) and $1.21 (52-week low). Resistance at $1.80 (near-term pivot), $2.50 (50-day SMA), and $3.00 (prior consolidation zone).
• Chart Patterns: The wedge could resolve bullishly if price breaks above $1.80 on volume, targeting a measured move to $3.00+. Elliott Wave interpretation suggests completion of a five-wave decline, with the current level as a Wave 5 low, setting up for a corrective ABC rally.
Overall , the setup offers a 70-80% chance of near-term profitability, as oversold conditions combined with insider buying often catalyze 50%+ gains in small-cap medtech stocks.
Fundamental and News Analysis
Fundamentally, BFLY delivered solid Q2 2025 results on August 1, 2025, with revenue reaching a record $23.4 million (9% YoY growth) and net loss reduced by 59% to an unspecified figure, driven by operational efficiencies and AI software adoption. Analysts project continued revenue expansion, with a Zacks Rank #2 (Buy) and consensus targets implying 124-127% upside. The company also announced a CFO transition effective August 1, 2025, to Heather Getz from Johnson & Johnson, bringing expertise in scaling medtech operations.
Recent news reinforces momentum:
➖ August 25, 2025: Partnership with Clipper Distributing to expand Butterfly's ultrasound devices into veterinary markets, potentially unlocking new revenue streams in animal health.
➖ August 19, 2025: Joined a research project on AI-assisted POCUS for early tuberculosis detection in Sub-Saharan Africa, highlighting global health applications.
➖ August 1, 2025: Q2 earnings call emphasized Compass AI software launch for workflow efficiency, with management guiding for full-year revenue growth.
Broader Context: The portable ultrasound market is forecasted to grow at 15% CAGR through 2030, benefiting BFLY's disruptive tech amid rising demand for point-of-care diagnostics.
Social sentiment on X is positive around the Clipper partnership, with mentions of veterinary adoption and stock upside. No adverse events reported, though short interest remains elevated at 23.55% as of August 22, 2025.
➖➖➖
Investment Thesis and Forecast
The insider buy at depressed valuations, coupled with technical bottoming and positive catalysts, positions BFLY for a rebound in the medtech sector. Replicating Cashman's entry at $1.64 yields the following scenario:
Entry Price: $1.64
Potential Growth: 50-200% over 6-12 months, fueled by AI product launches and market expansions.
Exit Targets:
➖ Conservative (Target 1): $2.50 (52% profit, +$0.86/share) – Exit at 50-day SMA or post-partnership revenue updates.
➖ Moderate (Target 2): $3.50 (113% profit, +$1.86/share) – Scale out 50% on RSI >70 or analyst upgrades.
➖ Aggressive (Target 3): $5.00 (205% profit, +$3.36/share) – Full exit on breakout above $4.00 or M&A speculation.
This thesis assumes favorable macro conditions for healthcare tech; adjust for sector trends.
Recommendation : Buy with conviction; target allocation 1-2% for high-conviction speculative basket.
Disclaimer : This report is for informational purposes only and does not constitute investment advice. Past performance is not indicative of future results.

EURJPY 4-HOUR short trade analysis EURJPY short term analysis trade plan
Support and Resistance Levels Chart have marked areas that could act as support and resistance. Recognizing these levels can help determine potential reversal areas for price.
Chart Patterns, Look for patterns like double tops, double bottoms, or any consolidation patterns. These can signal market intentions. these can help identify potential retracement levels where the price may reverse or pause.
Time Frame: This is a 4-hour chart, which suggests that the analysis is suitable for short to medium-term trading strategies.
