APEPERP - Positive dynamics.Exit from the trade at the extreme support point at 2.88 shows the positive dynamics of the resumption of buying. Let's keep watching.
If you liked the idea, please like it. This is the best "Thank you!" for the author 😊
P.S. Always do your own analysis before a trade. Put a stop loss. Fix profits in installments. Withdraw profits in fiat and make yourself and your
your loved ones.
Continuation of this idea
Search in ideas for "Dynamic"

EUR/USD:SELL From 50% FIBO Dynamic Resistances for a SHORT SetupThe EUR/USD After a Strong push-down, in the last session trying to recover some value, this is called retracement. This retracement is reaching the 50% 61.8% Fibo Levels where there is more than one confluence of dynamics Resistances by the dynamic trendlines. The Price may have a Pullback in this zone before dropping down. The stochastic indicator is approaching the overbought area and may also this fallen down.

More volatility and market dynamics8. 27. 22 more volatility and market dynamics. Palladium Homework assignment

Pattern stuff and market dynamics8.27.22 Pattern stuff and market dynamics. When the market expands, or it contracts, you probably have to change your expectations how's the market. In other words, in other words, you change your target. In this video I'm trying to connect my version of "mathematics" And pattern behaviors in a way that helps me increase my reward, and reduce my risk. Homework assignment #1: Draw some lines on this market.

Bitcoin On The Weekly Timeframe (Support Levels Dynamics)How does Bitcoin interacts with different support levels on the weekly timeframe?
How has been Bitcoin performing as it hits support on the way down ever since April 2021's All-Time High?
Follow me and feel free to hit like NOW!
Let's look at Bitcoin's weekly support levels dynamics.
We start on the rise that peaked April 2021.
Resistance levels become support and vice versa as prices fluctuate.
Notice the Jan. 2021 support level...
On the way down, this support level produces a bounce.
This is followed by the late 2020 support level...
Which is now due to produce a bounce:
This same pattern can repeat one last time and Bitcoin bottoms and we get the following complete cycle pattern:
Do you agreen with this analysis?
Leave your thoughts, comments, charts & questions in the section below.
Namaste.

More on copper and market dynamics. Part 39.26.21 More on copper and market dynamics Part 3 It is worth spending some time on all three Parts. DRAW the lines and playback the explanations outload to someone else ( you can even explain it to you dog if the rest of the family does not want to listen to you ). See it, do it, teach it...works.


Market Dynamics Market Dynamics.
On the HTF I’ve been Bullish so still sticking to my bullish sentiments .
Entry at $9500 - still holding position .
My thoughts for today?
Btc on the 8hr timeframe showing controlled or less supply- and you know what happens when there is less supply ? - MORE DEMAND. ( this pushes prices up.
However on the 4hr chart there seem to be some supply to be mopped up . If supply is low on the 4hr close prices could rally up .
If supply is high price could see lower figures .
If demand exceeds supply price will break the 9700 resistance and rally up to the next resistance $10,060
Next 4hrs - 8hr close should give an idea of the final direction of the trend . 🤞🏽
- Indicators printing bullish signals
-HTF -MiD TF- bullish
Nb- just my thoughts not financial advise .
#speculations #risktoreward

Quite an interesting dynamic. While a downgrade is possible.Quite an interesting dynamic. While a downgrade is possible.

USD/CAD: the pair is showing mixed dynamicsCurrent trend
US dollar showed slight reduction against Canadian dollar yesterday, but managed to updated a local maximum of October 25. Certain pressure on it was put by the data on Markit services PMI that were released yesterday and appeared to be worse than expected by analysts. CAD, it turn, received certain support after the release of export and import statistics.
The volumes of export from Canada in October grew from 43.30 bln to 44.46 bln CAD which was a bit higher that average outlooks. The volumes of export in the same period dropped from 46.67 bln to 45.93 bln CAD causing considerable reduction of trading balance deficiency from 3.36 bln to 1.47 bln CAD (while it was expected to reach -2.70 bln).
Today investors will focus their attention on the decision of the Bank of Canada that is scheduled for 17:00 (GMT+2). Analysts don’t expect the rate to move away from the current level of 1%, but the follow-up statement may contain important comments about the future policy of the regulator.
Support and resistance levels
Bollinger Bands in D1 chart show flat dynamics. The price range is widening. MACD histogram still preserves a stable downward trend with a sell signal (the histogram is below the signal line). Stochastic has reached minimal values indicating that the instrument is oversold in the short term and reversed to growth.
Resistance levels: 1.2700, 1.2735, 1.2769, 1.2800.
Support levels: 1.2664, 1.2621, 1.2600.
Trading tips
Long positions may be opened after breaking through the level of 1.2700 with targets at 1.2750, 1.2769 and stop-loss at 1.2670. The period of implementation is 2-3 days.
Moving away from the level of 1.2700 as resistance may be a signal for the beginning of corrective sales with targets at 1.2621, 1.2600 and stop-loss at 1.2740. The period of implementation is 2-3 days.
US Dollar vs Canadian
Buy Sell Spread
1.26737 1.26716 21
Scenario
Timeframe Day's Range
Recommendations BUY STOP
Entry Point 1.2710
Take Profit 1.2750, 1.2769
Stop Loss 1.2670
Support levels 1.2600, 1.2621, 1.2664, 1.2700, 1.2735, 1.2769, 1.2800
Alternative scenario
Recommendations SELL LIMIT
Entry Point 1.2700
Take Profit 1.2621, 1.2600
Stop Loss 1.2740
Support levels 1.2600, 1.2621, 1.2664, 1.2700, 1.2735, 1.2769, 1.2800

USD/CAD: the pair is showing flat dynamicsCurrent trend
US dollar grew considerably against the Canadian currency during yesterday’s trading moving away from local maximums updated in the middle of the previous week. US currency is supported by corrective movements and resumed return on US bonds. Another “bullish” signal for USD was yesterday’s statistics on new housing sales in October (+6.2% MoM against the outlook of -6.3%).
Today traders will focus their attention on the comments of the Fed’s representatives with new assessment of the prospects for the increase of the interest rate during December meeting of the regulator. Moreover, investors will try to get signals about the plans of the new regulator’s head on policy development. Currently the main candidate for the position is Jerome Powell.
The release of a report on Canadian financial system is due today at 17:30 (GMT+2). It will help analyze the tendencies in the country’s economic sector. Moreover, the head of the Bank of Canada Stephen Poloz is to make a statement at 18:15 (GMT+2).
Support and resistance
Bollinger Bands in D1 chart show flat dynamics. The price range remains narrow. MACD indicator is reversing upwards forming yet another buy signal (the histogram is above the signal line). Stochastic preserves a stable upward direction and is located in the center of its working area.
Resistance levels: 1.2769, 1.2800, 1.2858, 1.2915.
Support levels: 1.2735, 1.2700, 1.2664, 1.2597.
Trading tips
Long positions should be opened after testing the level of 1.2800 with target at 1.2858 and stop-loss at 1.2760. The period of implementation is 2 days.
Breaking down the level of 1.2735 may be a signal for returning to sales with targets at 1.2664 or 1.2630 and stop-loss at 1.2820. The period of implementation is 2-3 days.

Eurostoxx 50 : Bearish dynamic & resistance areas, better shortThe EU stocks index Eurostoxx 50 (MOY0) has made a nice rise since the Brexit (end June), but the buyers are currently facing some difficulties to go higher. In fact, the european stock market is inside a bearish dynamic since early 2015, as characterized by the downside trendline resistance (blue) and the bearish 200 days moving average.
In this case, the sellers are likely to become majoritary again due the the following reasons :
- Proximity with the downside trendline resistance
- Beginning of a retreat at 3100 points, first resistance
- This resistance area matches with the 50% retracement of the violent drop we have seen in december - february.
Both the long term dynamics and levels should prevent the buyers to go further and initiate a pull back to where markets were in september.
Here is the precise strategy :
- Open short at the current price (3080 points on Friday close)
- Stop @ 3120 pts (above the resistance for market noise)
- First target @ 3025 points (close 50% of the position, reward/risk = 1.38)
- Second target @ 2940 points (close the other 50% of the position, reward/risk = 3.5)

TIA Dynamic Support Line for Buy PointsThe support I have set for Tia purchase
The QT process is ongoing. There is no liquidity in the market. In non-major markets, support levels are dynamically shifting downwa

TIA Dynamic Support LineThe support I have set for Tia purchase
The QT process is ongoing. There is no liquidity in the market. In non-major markets, support levels are dynamically shifting downwards.

Steel Dynamics ($STLD) Stock Hits a Record HighSteel Dynamics ( NASDAQ:STLD ) reports current quarter guidance that was above estimates as it sees profitability potentially stronger than the previous quarter. The steelmaker said the gains were driven by its flat-rolled steel operations.
Steel Dynamics added that because of its confidence in the business, the company repurchased 1.4% of its stock so far in the quarter. Steel Dynamics ( NASDAQ:STLD ) shares soared to a record high after the steel maker reported much better-than-expected guidance on booming demand.
The company predicts current quarter earnings per share (EPS) of $3.51 to $3.55, while analysts were looking for $3.32.
Steel Dynamics said it anticipates profitability from its steel operations to be "meaningfully stronger" than fourth-quarter results.
While the company will give more details in its first quarter financial report on April 23, it pointed to increased shipments and earnings driven by the company's flat-rolled steel operations as fueling growth. Steel Dynamics ( NASDAQ:STLD ) also said earnings from its metals recycling business will be higher, and that its automotive, non-residential construction, energy, and industrial sectors “continue to lead demand,”
Based on its “continued confidence in its earnings outlook and cash flow generation,” it had repurchased $279 million, or 1.4%, of its stock in the first quarter through March 11, the company said.

TARGET ZONES AND EXCHANGE RATE DYNAMICSTARGET ZONES AND EXCHANGE RATE DYNAMICS
THE QUARTERLY JOURNAL OF ECONOMICS
August 1991 By Paul Robin Krugman
This paper develops a simple model of exchange rate behavior under a target zone regime. It shows that the expectation that monetary policy will be adjusted to limit exchange rate variation affects exchange rate behavior even when the exchange rate lies inside the zone and is thus not being defended actively. Somewhat surprisingly, the analysis of target zones turns out to have a strong formal similarity to problems in option pricing and investment under uncertainty.
Wide attention has been given to proposals to establish "target zones" for exchange rates. Indeed, we are already arguably living under a weak target zone regime. The reference zones established under the Louvre Accord and in subsequent consultations among the major industrial nations are not publicly announced, nor is it clear how strongly they will be defended, but the principle of setting limits on the range of exchange rate variation has been established.
A target zone differs from a fixed rate regime in allowing a fairly wide range of variation for the exchange rate around some reference rate. Williamson , for example, called for a range of 10 percent on either side of the central rate. The appeal of this idea, as opposed to a more strict pegging, is that a target zone should not need as much maintenance. Some exchange rate flexibility would be allowed, and thus the defense of the exchange rate would become only an occasional problem rather than a continuous preoccupation. Given the widespread attention devoted to target zones and the apparent drift of actual exchange rate policy toward something that looks increasingly like such zones, one might have supposed that the theory of how a target zone system would work would be fully worked out. In particular, since the whole idea of target zones is that exchange rates will normally be inside the zone, one would expect considerable focus on how the exchange rate will actually behave inside the band. In fact, however, there is essentially no literature on this question. Even advocates of target zones, such as Miller and Williamson , have not actually modeled the behavior of rates inside the zone; instead they attempt to approximate a target zone by a continuous monetary policy of leaning against the wind.
The principal issue in modeling exchange rate dynamics under a target zone regime is the formation of expectations. A naive view would suppose that the exchange rate behaves as if the regime were one of free floating until the rate hits the edge of the band, whereupon the regime switches to a fixed rate. However, this cannot be right. The existence of a band constrains possible future paths of the exchange rate; exchange markets, knowing this, should behave differently than they would if there were no target zone. In other words, the existence of a band should affect exchange rate behavior even when the exchange rate is inside the band and the zone is not actively being defended.
This paper offers a new approach to the modeling of exchange rate dynamics under a target zone regime. The approach is related to earlier work by Flood and Garber [19831, but the methods employed are different and, as it turns out, much simpler. More surprisingly, the analysis of target zones turns out to have a strong formal similarity to that of problems in option pricing and irreversible investment. This unexpected linkage with other areas may give the paper some interest even to those who are not concerned with target zones per se.
The model used to exposit the logic of target zones is a minimalist monetary model. Clearly, the next step is to move to more sophisticated and realistic underlying models. In work based on earlier versions of this paper, Miller and Weller [I9891 have already shown how the same general approach may be applied to a Dornbusch-type model with intrinsic dynamics as well as the "extrinsic" dynamics that, as we shall see, arise from a target zone. The paper is in five parts. The first part lays out the basic model and presents some intuition on the results. The second part derives an explicit solution for exchange rate behavior under a target zone, except for the question of "tying down the ends of the S" (a concept whose meaning will become clear in context). The third part then tackles this issue, uncovering a fundamental similarity between target zones and option analysis. The fourth part considers the money supply behavior necessary to enforce the target zone. Finally, the fifth part examines the behavior of an imperfectly credible target zone.
…………………………………………………………………………………………………………………………. for detailed analysis.

APRIL SPY DYNAMIC IRON CONDORI previously described long-term iron condors in SPY in the post below and a way of "dynamically" managing them intratrade to take advantage of price movement during the life of the setup by either (a) rolling the wings as a unit toward current price when delta balancing or (b) rolling oppositional pairs of options (i.e., the short put and the long call/the short call and the long put) as a unit; and (c) rolling to take advantage of intratrade pops in volatility, which may result in the premium becoming suddenly (but usually temporarily) richer in value for your setup.
In this setup, I've taken a slightly different approach as far as where the wings are placed at the outset than in the previous one (where I set up the short call wing at the edge of the "expected move" for the expiration).
Here, I've started out placing my short call wing with its short call at the 1 standard deviation line for the expiration and then proceeded to match it up with a short put wing with the short put option of the spread at about the same value as the short call option. The result is a 133/136/226/229 iron condor, which is, for all practical purposes, delta neutral (its total delta is -1.81).
From a pure dollar and cents standpoint, it isn't much to look at, since you'll only get a .15 credit to put it on, which will probably barely cover fees and commissions. That being said, the idea is that you don't just leave it alone; rather, you watch the setup's overall delta and then roll intratrade to balance, picking up additional credit during the life of the setup, while keeping your short option strikes clear of statistically likely movement. Obviously, because of the way the setup is skewed, you have a good deal more room to work with on the put side than on the call ... .

IONQ : dynamic aheadWe might see quite a movement ahead. With a lot of dynamics, but target is 50 region !

Avalanche | Market Dynamic (5X vs 30X — Which One Will You Get?)Avalanche is one of the giants... It is also one of the favorites for many of the Crypto-enthusiast we have here at TradingView and all across the world; this is good.
There is a difference between AVAXUSDT and AVAXBTC.
I will reveal this difference to you.
➖ AVAXBTC peaked December 2023.
➖ AVAXUSDT peaked March 2024.
That's a strong difference, several months.
➖ AVAXBTC can start moving several months before AVAXUSDT.
This might seen like a small detail, but it can mean the difference between 2-3 months of waiting not knowing what is going on, vs 2-3 months of action, high profits, growing capital and then ready for the major accumulation phase pre-2025 bull-market. Do you understand?
The Altcoins vs Bitcoin (ALTS — BTC) pairs will move first. This is what we are gathering by looking at hundreds charts.
This is one of the giants, so the dynamics can vary, things can change. But if you look at all the others that I shared, 300+, you will see that they all hit bottom and are ready for massive growth.
Make the right move.
Take the time to read.
And you can recover in a matter of 2-3 months.
This recovery is necessary, because it can serve as your base for massive wins after 2024. Earning now, can make difference between 5X by the end of 2025, vs 20-30X. I know it is a complex game, but if you read, you will understand.
Read everything that I shared recently.
It was all written just for you.
Thanks a lot for your continued support.
Namaste.

Altcoins Market Dynamics, Basics, Leverage & Money Management➖ Higher Low vs Lower Low Difference
This is a very important dynamic to consider because much of the buying and selling is done based on "higher lows" and "lower lows."
The altcoins market is huge. What one does, the rest follows; but, there are tens of thousands of altcoins right now. Many follow their own cycles and many variations across the market occurs. "What one does, the rest follows," applies only to the broader market cycle and direction. When the market is bullish, everything grows; when the market is bearish, everything declines. Price action can only be calculated by looking at each chart, each pair, each project individually.
Now ... With this intro I can get to my point.
Many altcoins already hit bottom and will only produce a higher low on the next leg down, compared to the last major low. While another portion of the market will produce a lower low on the next leg down compared to its previous/last major low. Those producing lower lows should not be sold, as in a "stop-loss" because they are still set to grow based on the broader market cycle when the bull-market comes in 2025. So the accumulation phase will have strong fluctuations, for a while, but massive growth will still be the result in 2025.
One later group will continue to produce lower lows and more lower lows because of the weakness of the project relative to trading action and the rest of the market. This also happens and will happen.
There is a portion of the market called, "the market leaders." As the name implies, these will lead the market. If you can catch some of these your portfolio is secured.
One needs some stable pairs/projects, some highly volatile ones and some of the leaders to balance things out.
➖ No Leverage, No Margin: No Risk
The capital used for leveraged trading should be separate to the capital used for spot trading or long-term buying; these things can't be mixed. There is a tendency to gambling in this type of venture, in this speculation game; so it is very wise to have a solid portfolio of altcoins that is based on long-term growth and then gambling, or "high risk high potential trading opportunities" are taken with funds that you know can be easily lost.
"Don't use money that you cannot afford to lose," is a true adage.
If you can't bear the weight of losing money, then you are not ready for the cryptocurrency market, you are not ready to trade. If you have spare money, or you planned your unique individual situation, then go ahead.
If you have a stable emotional and financial life, then you can do anything and you will be successful.
If you have financial needs and feel the need to make money fast, then you can't trade. Money is not earned fast in this business, but can be lost in the blink of an eye.
It takes time. It takes years for a position to mature and grow.
Patience is key.
Thanks a lot for your continued support.
Namaste.

IMX | Altcoins Market Dynamics Explained! (2025 Bull-Market)Here is what happened in the past, what is happening now and what will happen in the future...
Good Sunday my fellow Cryptocurrency trader, please, allow me to entertain you with another post today.
Here we can see the classic head and shoulders (H&S) pattern. This pattern shows up to signal the end of a bullish trend.
Here is the dynamic for IMXUSDT, which is also happening for the rest of the Altcoins market; What one does, the rest follows.
1) There was a bullish wave that ended in a correction, as is normal. In this case the top produced the classic H&S pattern. After the correction, we get a long accumulation phase and then a new bullish phase.
2) This is present time. We had a strong bullish wave last year that ended in the first quarter of this year. As is normal, a strong correction follows a strong bullish wave. This correction is almost ending and the top produced the same H&S pattern.
3) Future date. The correction will lead to a mid-size accumulation phase and this accumulation phase will lead us into a new and very strong bull-market.
Get ready. If you are reading this, you know exactly what will happen in advance.
Make the most of this information.
Plan ahead and become a millionaire in 2025.
Thank you for reading.
Namaste.

Insights into Key Zones and Trend DynamicsAs previously anticipated and now observed in real-time, the PEPPERSTONE:XAUUSD OANDA:XAUUSD market has executed a meticulous retest, precisely targeting the Resistance 1 (R1) and Resistance 2 (R2) zones, meticulously outlined in our prior analysis. However, the journey doesn't halt there; the imminent challenge lies within the formidable Resistance 3 (R3) zone.
Should the market muster the strength to breach this final frontier, a compelling narrative unfolds, directing the trajectory towards the pivotal 2013 zone. Here, the market anticipates a strategic retracement, teasing traders with a potential reversal before resuming its steadfast descent in a continued bearish swing. This intricate dance of price action embodies the essence of the XAU market's dynamic nature, where every move holds profound implications for astute traders seeking to navigate its labyrinthine pathways.

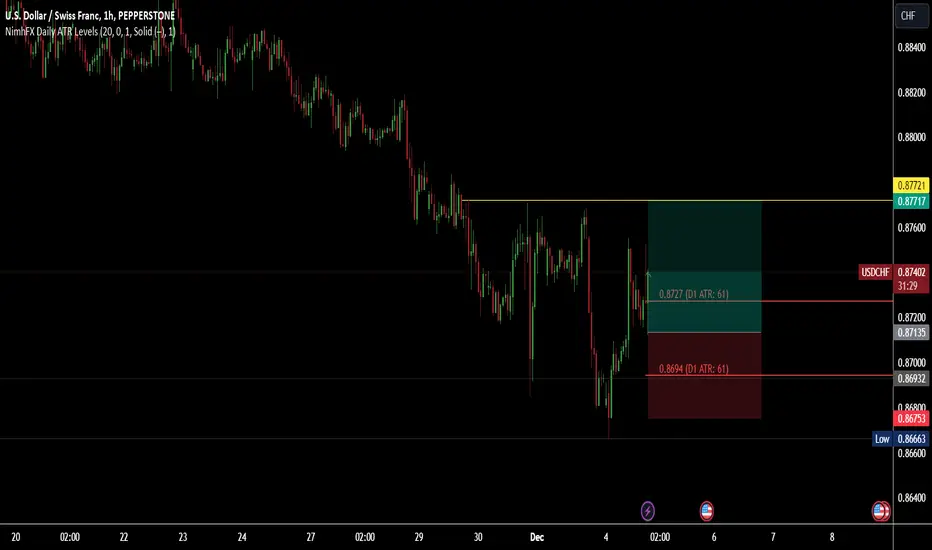
Leveraging USD/CHF Trade to Tap into a Dynamic Liquidity PoolIn this strategic USD/CHF trade, we capitalize on the compelling dynamics of the forex market's liquidity pool. By pinpointing the USD/CHF currency pair, our trade aims to harness the consistent movement and robust liquidity prevalent in this specific pool. The unique characteristics of USD/CHF make it an enticing avenue for traders seeking stable liquidity and potential profit maximization. This trade is poised to leverage these factors, harnessing the pair's liquidity to optimize gains while managing risks effectively.