EFERT - Navigating the Dividend Dynamics📊 Technical Overview:
EFERT's recent surge to Rs. 101.36 showcases its prowess, but a dip in dividend yield below the prevailing 22% interest rate has caught investor attention. Let's dissect the charts and explore potential trends.
📈 Price Action Analysis:
The uptrend is clearly evident, forming a solid foundation for the current price. Bulls seem in control, but could recent gains be a precursor to a pullback?
📉 Dividend Yield Dilemma:
EFERT's historical dividend yield supremacy faces a challenge as it slips below the prevailing interest rate. Investors are on edge, eyeing future economic cues.
📅 Anticipating Rate Movements:
With expectations of declining interest rates in the upcoming quarters, could EFERT reclaim its dividend crown? A potential catalyst for an upward swing?
🔍 Risk Factors:
Investors wary of a shift towards fixed-income options might exert downward pressure. Monitoring this sentiment is crucial for strategic decision-making.
🚀 Potential Upside:
If rates fall as anticipated, the current dip in dividend yield may be short-lived. Could we see a resurgence in EFERT's dividend allure?
📊 Conclusion:
EFERT's journey unfolds at the intersection of dividends and interest rates. Traders keep a watchful eye on this dynamic as the market navigates through evolving economic scenarios.
📣 Disclaimer:
This analysis is for informational purposes only and not financial advice. Always conduct your research before making investment decisions. Trade wisely! 📈💼
#EFERT #TradingView #StockAnalysis #InvestmentInsights #PSX
Search in ideas for "Dynamic"

Navigating Bitcoin's Price DynamicsOver the last 24 hours, the price of Bitcoin has been experiencing a decline followed by a rebound from the 29500 range towards a support. This positive reaction to the support area shows that there is still demand in the market for Bitcoin. It is worth noting that the dynamic support has yet to be breached on the daily timeframe with a strong bearish candle, which suggests that Bitcoin still has the potential to grow in value.
Furthermore, it is important to take into account the correlation between Bitcoin and the global ounce of gold. In the past three days, the ounce of gold has reached a new high of 2079, which indicates a possibility of Bitcoin's value rising again.
However, in the short term, the price trend for Bitcoin in the 4-hour and 1-hour timeframe is downward, and it is expected that the price will return to lower support levels. If Bitcoin loses its current support, one of the significant support ranges is between 28450 and 27950. Yesterday, the price reacted positively to this range once, which suggests that if this level is maintained, there is potential for Bitcoin's resistance to be broken.
In conclusion, the recent decline in the price of Bitcoin has been followed by a rebound towards a support level, indicating that there is still demand for Bitcoin in the market. However, the short-term trend is downward, and it is expected that the price will return to lower support levels. It is worth noting that Bitcoin's correlation with the global ounce of gold suggests a possibility of its value rising again. If Bitcoin loses its current support level, the 28450 to 27950 range could be an important support level.

Natural Gas: The supply-demand dynamic is at a critical stageDeutsche Bank reported that in a particularly critical phase is the supply-demand dynamics regarding natural gas towards the winter season, which the behavior of households will be decisive in the coming months, as their consumption represents a large percentage of total consumption. A supply failure is likely to be avoided at least as the scenarios confirm that a 20% YoY reduction in consumption this winter (and flat annual demand thereafter) is likely to lead to some shortages either early in 2023 or the winter of 2023/24.
The reduction in Germany remains at 40%, while if demand falls by only 10% YoY stocks will not be exhausted even in such a scenario. For certain, fill levels would fall below 10% in late winter 2022/23, but this would not put energy security in doubt until 2024. The European Commission is working on proposals to limit prices. While negotiating with reliable suppliers, for instance, Norway, and strengthening common markets seem to be the Commission’s preferred options, the idea of a (temporary) price cap on imported natural gas is gaining ground.
The greater the potential for the implementation of a cap the lower the success of the implementation of the first two measures. Such an implementation could lead to increase supply risks, depending on the design of such an import price cap which would accompany the mandatory demand reduction.
From an Elliot wave perspective, we will examine the Natural Gas chart to see its potential move in the short to mid-term.
Looking at the weekly chart, natural gas made an impulsive five-wave rally from the lows, which suggests that low is in place and we can expect a bigger recovery. However, in Elliott waves, after every five-wave rise we can expect a slow down in three waves, so we are tracking now an (A)-(B)-(C) correction before the uptrend resumes. First support is around 5.3 level, while second support would be around 3.5 level.
All the best!
If you like what we do, then please like and share our idea.
Disclosure: Please be informed that information we provide is NOT a trading recommendation or investment advice. All of our work is for educational purposes only.

Ethereum, Potential Breakout-Dynamics When This Happens!Hi,
Welcome to this analysis about Ethereum, we are looking at the 45-minute timeframe perspectives. Since Ethereum moved on with bearish declines below previously established supports it somewhat managed to bounce in the structure however did not yet fully convert this into a reversal. Besides Ethereum has formed this major descending-channel-formation with the coherent wave-count and the waves A to C already completed. From the local perspective, Ethereum is forming a dynamic double-bottom that has the ability to test the upper boundary from where initial pullbacks will follow. Mainly when Ethereum properly stabilizes above the ascending-trend-line marked in blue that is highly important to hold and shows up with a breakout above the upper boundary this is likely to lead to further continuations, therefore it is of high necessity that Ethereum does not fall below the ascending-trend-line again because this will invalidate bullishness, it will be an important development.
In this manner, thank you for watching the analysis and great contentment for everybody supporting, all the best!
"Good luck is when opportunity meets preparation."
Information provided is only educational and should not be used to take action in the market.

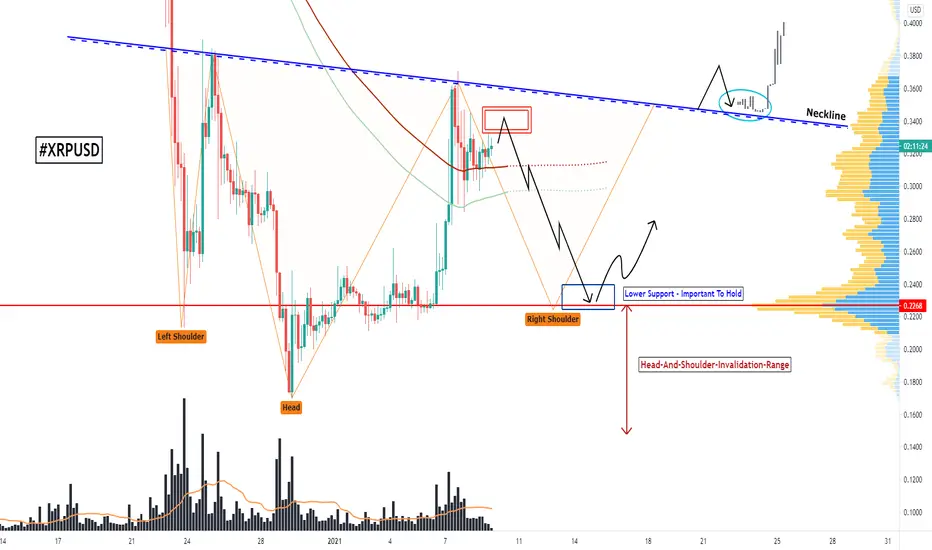
How This Potential H-S-Formation Can Alter XRPs Dynamic!Hi,
Welcome to this Middle-Term-Analysis about XRPUSD, we are looking at the 4-hour timeframe perspective. The cryptocurrency market-environment has changed, it is not what it was back in the bull-market in 2017 where just everything moved straightly into one direction, the divergences between certain currencies have increased exorbitantly as there are currencies forming more bullish dynamics, while others go sideways there are also others going into the contrary direction of the average main market, these divergences are highly important to distinguish between the certain currencies and this is why it is so necessary that we do not just trade what we think and what we wish to the market is going to as the market is constantly altering and many different factors taking place these days the market needs to be assessed from different angles and approved in new ways otherwise it is just speculation and approach into a "wish"-direction, as market makers and smart money do not care about, it so inevitably to prepare onto the changes within the market and then take the appropriate action.
As when looking at my chart we can watch there XRPUSD is about to form a quite decisive formation here which is a major possible inverse head-and-shoulder-formation however to complete this formation XRPUSD has to confirm several price-actions in its structure to fully validate this formation otherwise the possibility for invalidation of this formation is also given. At the local perspectives, we see XRPUSD with some important resistance-zones and supply lying within the structure between the 0.3325 and 0.35 level marked in my chart where the possibility is high for a bearish pullback to the downside which can form the right shoulder of the formation this bearish pullback will fully protract below the EMAs as they are marked in my chart and will then move on to the lower supports to test them when XRPUSD then manages to stabilize within these supports marked in my chart with the blue box XRPUSD can move on to form the right shoulder and forward to final completion of the formation, it will be from high importance that XRPUSD, in this case, bounces from the lower support otherwise when moving below this will invalidate the formation.
In this manner, thank you for watching the analysis, have a good day, all the best!
"The high destiny of the market is to explicate rather than to speculate."
Information provided is only educational and should not be used to take action in the markets.
XRPUSD, Triangle-Formation That Can Alter The Whole Dynamic!Hi, welcome to this analysis we are looking at XRPUSD 1-hour timeframe perspective, as the dynamics in the cryptocurrency markets showing some stabilization since the bearish breakdowns we need to consider when a solid back-up can be formed, in this case, XRPUSD is forming some interesting signs at the moment as it is moving in a major ascending-triangle-formation marked in my chart, such formations are known to break out to the upside as this is the preferred direction in these cases, sometimes such formations can invalidate to the downside, in this case however the trend needs to gain strength in speed and volatility and this is currently not given with XRPUSDs downside movements, to the formation there comes also a coherent wave-count in which the pair currently forms the second major wave B running into the remaining resistance and can be origin for the wave C to the downside.
Overall it will be the best when XRPUSD shows up to complete the whole wave-count to form the solid breakout and confirmation of the ascending-triangle-formation, therefore it is important that XRPUSD holds the blue ascending trendline marked in my chart where also the wave E can end, when XRPUSD bounces in this level and moves on above the upper boundary of the triangle it will provide the proper confirmational setup to enter conservative as it is marked in my chart, there is the possibility given to enter immediately, however, this is not the best option, in this case, the smartest way will be to wait on proper confirmation before entering into the market appropriately, traders should decide according to individual risk preferences. When XRPUSD shows up with the proper breakout and confirmation this will activate targets in the higher levels.
In this manner, thank you for watching, support for more market insight, good day to you, and all the best!
"There are many roads to prosperity but one must be taken."
Information provided is only educational and should not be used to take action in the markets.

GBPUSD On the Series of Looking for LOY (Low of the Year)Hey co-traders, 1st off, our GU is seating off on Major Short Trend. It's not wise to buy until cloud is clear. We can see how she tries to move up and keep on getting rejected on those key levels on volume. Dynamic wise, dealers still have a room for it down to the bottom to 1.235 or lower, which could be calculated as economic factor depreciates its price on the price chart. MM swiftly moved their motive on a matter of week to entice appearing LOY last few weeks, but we all know it's not real until another price has been unfold for it. For PA, she tries to move up on spike but shows a sign of exhaustion and will eventually show just a long wick on every spike or economic news. There was one good rally we have had experienced 20 hours ago. Although the high it has given up with was eventually rejected. Hence, apparently, considering this a "Rally Rejection Trade Setup" based on volume, as there's a heavy room seated on resistance. Let's probe each trade and analysis, and validate it with truth, figures, economic facts and valid confirmation. Personally, I could be cold wrong but it shouldn't meant to affect other traders strategy to it, not trying to be right on this, but just trading with solid facts and confirmations. Healthy exchanges of views with others also validates trades with some other currency pairs. What's your insight for this pair?

EUR/USD: mixed dynamics in the end of the weekCurrent trend
During the trading session on Thursday, October, 12, European currency fell against the US dollar, stepping back from the maximum of September, 25. The downward trend is due to the positive US Initial Jobless Claims data and Producer Price Index, which let the investors hope that Friday’s Consumer Price Index will be strong.
On October, 6, the Initial Jobless Claims indicator fell 258K to 243K, while the analysts expected the value of 251K. The Consumer Price Index grew by 0.4% MoM and 2.2% YoY in September, which exceeds the analysts’ expectations of +0.2% MoM and +2.0% YoY.
On Friday, October, at 14:30 (GMT+2) the block of key September statistic of retail sales and consumer inflation will be published in the USA. After FOMC Minutes, published this week earlier, the investors are focused on the price dynamics, as it can affect Fed’s decision upon the interest rate rise.
Support and resistance
On the daily chart Bollinger Bands’ dynamics is flat. The price range is not widening, being quite narrow for the current volatility level. It’s better to use channel trading strategy.
MACD is growing, keeping quite strong buy signal (the histogram is above the signal line) and trying to consolidate above the zero line. It’s possible to keep some of the current long positions in the short term, but not to open new ones.
Stochastic has crossed the level of 80 and reversed into flat, reacting to the “bearish” dynamics on Thursday, October, 12. The indicator reflects that the correctional fall is possible in the short term.
Resistance levels: 1.1860, 1.1878, 1.1909, 1.1950.
Support levels: 1.1820, 1.1800, 1.1755, 1.1730.
Trading tips
Long positions can be opened after the breakout of the level of 1.1860–1.1878 with the target at 1.1950. Stop loss is 1.1820–1.1830. Implementation period: 2-3 days.
The correctional dynamics development and the breakdown of the levels 1.1820–1.1800 can be the signal to open short positions with the target at 1.1700. Stop loss is 1.1850. Implementation period: 2-3 days.

XAG/USD: silver dynamics is mixedCurrent trend
During trading session on Tuesday, September, 12, silver prices insignificantly grew and stepped off the local minimum since the beginning of the month. The instrument is trying to enter the upward correction after downward gap opening on Monday due to the fall of the market demand on shelter assets after DPRK refused to test missiles last weekend, which helped to release the tense upon the North Korea situation.
On Wednesday, September, 13, the investors are waiting for Producer Price Index publication at 14:30 (GMT+2) in the USA. The MoM value is expected to grow by 0.3% MoM after the fall by 0.1% MoM in the previous month. In addition, the Monthly Budget Statement will be published at 20:00 (GMT+2) in the USA.
Support and resistance
On the daily chart Bollinger Bands are steady growing. The price range is narrowing, reflecting the appearance of the controversial trade dynamic this week. It’s better to use the channel trading strategy.
MACD is going down, keeping weakening sell signal (the histogram is below the signal line). It’s better to wait until the signal is clear, as current readings are uninformative.
Stochastic has reached the border of the oversold area and reversed into flat, reacting to the attempt of correctional growth in the beginning of the week. It’s better to wait until the situation is clear and the indicator reverses fully.
Resistance levels: 17.87, 18.00, 18.17.
Support levels: 17.66, 17.53, 17.38, 17.27, 17.16.
Trading tips
Long positions can be opened after the breakout of the levels of 17.87 or 18.00. Take profit is 18.20–18.30. Stop loss is 17.80–17.70. Implementation period: 2-3 days.
The alternative is the return of strong “bearish” trend after the breakdown of the level of 17.66. In this case it’s better to open short positions with the target around 17.30. Stop loss is 17.90. Implementation period: 2-3 days.

DXY / Dynamic / Time and Degree count.There is almost no doubt that FOMC will hike their rates.
The best setup we can have for Short the Dollar.
Difference between Dollar Resistance and Gold support is in no way stable.
Gold is the one leading.
No questions about Gold, but this one is beatiful.
This time I have massive Short ( biggest position ) in Short DXY from 101.60 with no Stops.
As well I have Short positions in UJ, and long positions in Gold.
But they all are small. Biggest position is in DXY because Time and degree count is looking beatiful.
Can dynamics be wrong? Of course my dear child.
Should you execute short? No my child, because the difference between me and you is that I can afford to lose, I doubt you can do the same.
All I am doing is risking reasonably based on what I believe in not in what you say me to do.
Good Luck today!

Part 3 – Dynamic Continuation Trading
In our series on intra-day trading strategies, we’ve explored approaches suited to quick market moves and breakout scenarios. Now, let’s dive into dynamic continuation trading, a method that seeks to trade in-lie with the days dominant trend.
Unlike strategies built around short bursts of momentum, dynamic continuation trading is all about capturing the rhythm of an established trend by entering on controlled pullbacks and aiming to stay in as the trend develops. The method brings a mix of patience, technical indicators, and timing into play, making it ideal for those looking to ride intra-day trends longer than they might with other strategies.
Good Things Come to Those Who Wait
Dynamic continuation trading rewards requires plenty of patience. It’s a method where your patience can make a difference between capturing a trending move with attractive levels of risk/reward or getting caught in a reversal.
This style of trading requires you to have enough patience identify an established trend. Then, there’s waiting for a pullback, ideally to a dynamic support area, which provides an entry point with favourable risk-to-reward potential.
And the patience doesn’t end there. As the trade moves in your favour, this approach also calls for a patient, steady hand in trade management. It’s not about taking quick profits but rather about letting the trade develop. That’s where using a trailing stop helps keep you aligned with the trend, locking in profits as the price moves while staying in the trade until the momentum naturally slows down.
Dynamic Trend Continuation on the 5-Minute Chart
In dynamic continuation trading, the 5-minute chart is your stage. Here’s a breakdown of how the 9 EMA, 21 EMA, and RSI can guide entries, stops, and exits.
1. Establish the Trend with the 9 EMA and 21 EMA
For an uptrend, look for the 9 EMA to be positioned above the 21 EMA. Additionally, ensure there’s a visible intra-day uptrend in place, characterised by higher swing highs and higher swing lows. This setup confirms that the market is favouring bullish momentum, and the trend is primed for continuation.
2. Wait for the Pullback
Once you see an established trend, wait for a pullback to the zone between the 9 EMA and 21 EMA. This EMA zone serves as dynamic support, giving you a lower-risk entry point aligned with the trend’s direction. At this point, check the RSI for additional confirmation.
3. Use RSI as an Entry Signal
During the pullback, the RSI should ideally dip towards the 50 level, which indicates that momentum has temporarily slowed without turning bearish. Once the RSI begins to move back above 50, this signals a resumption of momentum in the direction of the trend. Enter your trade when the RSI crosses back above 50, signalling that the pullback is ending and the trend is ready to continue.
Example: S&P 500
In this example, the S&P 500 begins to establish an uptrend with the 9 EMA above the 21 EMA, and prices form a series of higher swing highs and higher swing lows. The price then consolidates and pulls back toward the moving averages, with the RSI also pulling back toward the 50 area. This signals that the uptrend is likely to continue, and we enter the trade.
S&P 500 5min Candle Chart
Past performance is not a reliable indicator of future results
Trade Management & Stop Placement
The swing high or low that forms following the pullback serves as ideal area for initial stop placement. Stops should be placed just above or below these inflection points to minimize risk if the trend reverses unexpectedly.
In terms of managing the trade, the goal is to let the trend naturally unfold rather than micromanaging every move. A more passive approach allows for potential gains as the trend continues, with the 21 EMA acting as a dynamic guide for trailing stops. This moving average offers a reasonable “buffer zone” for staying in the trade while avoiding minor retracements that are common within trends.
As price moves in your favour, adjust your stop to follow the 21 EMA. By doing so, you’re locking in profits as the trend progresses while allowing room for the price to ebb and flow around the moving average. This approach aligns with the trend’s rhythm, helping you capture the trend’s full potential without being forced out by temporary pullbacks.
Bringing It All Together: How Parts 1, 2, and 3 Complement Each Other
With this series, we’ve covered strategies for different market conditions, equipping you with a diverse toolkit for intra-day trading.
Part 1 focused on quick-reaction trades in tight ranges, ideal for capturing small moves in low-volatility environments. Part 2 explored breakout momentum, which helps you engage with rapid moves following consolidation. Now, with Part 3, dynamic continuation trading provides a strategy for trending markets, helping you align with sustained price movement.
By combining these three approaches, you’re prepared to trade various market states, from range-bound to breakout to trending. This versatility not only enhances your ability to respond to changing conditions but also positions you as a more adaptable trader, ready to take advantage of the unique opportunities each market environment presents.
Disclaimer: This is for information and learning purposes only. The information provided does not constitute investment advice nor take into account the individual financial circumstances or objectives of any investor. Any information that may be provided relating to past performance is not a reliable indicator of future results or performance. Social media channels are not relevant for UK residents.
Spread bets and CFDs are complex instruments and come with a high risk of losing money rapidly due to leverage. 82.67% of retail investor accounts lose money when trading spread bets and CFDs with this provider. You should consider whether you understand how spread bets and CFDs work and whether you can afford to take the high risk of losing your money.

Market Dynamics Part 1: How to Spot AccumulationIn this two-part series on market dynamics, we’ll delve into the concept of Accumulation — where institutions investors quietly build a position in a stock. Understanding and identifying this phase in the Market Cycle has the potential to give retail traders a much deeper understanding of price action.
Understanding Accumulation in the Market Cycle
The Market Cycle, developed by Richard D. Wyckoff, includes four phases: Accumulation, Markup, Distribution, and Markdown. The Accumulation phase is characterised by sideways price movement as the institutional ‘smart money’ accumulates shares without attracting too much attention. Recognising this phase early can potentially provide traders with opportunities to position themselves ahead of the crowd.
The Market Cycle
Past performance is not a reliable indicator of future results
Why Spotting Accumulation Matters
Identifying the Accumulation phase is pivotal for several compelling reasons:
• Strategic Early Entry: Catching the accumulation phase early is like finding a quiet beach before the crowds arrive—it allows traders to enter positions when prices are more favourable, enhancing overall trade timing.
• Optimised Risk Management: During accumulation, market volatility tends to diminish, enabling traders to establish tighter stop-loss levels. This creates the potential for improving the risk/reward characteristics of a trade.
• Aligning with Institutional Moves: Recognising the accumulation phase empowers traders to synchronise their strategies with institutional investors. This attempted alignment, while not always accurate, has the potential to place the tailwinds of institutional demand behind your trade.
How to Spot Accumulation
While the accumulation phase of the market cycle may appear almost indistinguishable from the distribution phase to the untrained eye, astute traders can uncover subtle clues that reveal the underlying dynamics at play:
1. Candle Patterns: Price action during accumulation typically manifests as a series of small-range candles with long lower shadows (indicating buying interest at lower prices) and occasional small inside days (where the range of the candle is within the previous day’s range).
2. Support Levels: During accumulation, price often finds support at key levels, such as previous swing lows or established support zones. These levels act as strategic buying points for institutional investors looking to accumulate positions at favourable prices.
3. Swings: A small series of higher swing lows during a period of consolidation can indicate that buyers are stepping in at higher prices, a hallmark of accumulation.
4. Relative Strength: Another indicator of accumulation is a stock's strength relative to its sector or the broader market. This strength is particularly noticeable in weaker market conditions, where stocks showing resilience or outperformance may indicate accumulation.
By understanding these nuanced signals amidst seemingly similar market phases, traders can potentially gain a tactical edge in anticipating price movements and aligning their strategies accordingly.
Practical Examples:
Tesla (TSLA)
Here’s a recent example of accumulation in Tesla. The stock formed a small sideways range characterised by a series of small candles. Support held firm as prices formed bullish candle patterns. This phase was marked by a series of higher swing lows, signalling intensified accumulation before prices eventually broke out into the markup phase on strong volume.
Past performance is not a reliable indicator of future results
Coinbase (COIN)
Coinbase’s accumulation phase followed a deep pullback. The first subtle sign was a bullish hammer candle, followed by a series of small sideways days. The market then retested the hammer candle lows, finding support. A small inside day pattern was followed by another bullish hammer candle. Two consecutive gap-up days took prices above the recent swing highs, signalling the start of the markup phase.
Past performance is not a reliable indicator of future results
Conclusion
The goal of price action trading is often to try and align your trades with the phases of the Market Cycle, ensuring you are moving in harmony with the market's natural ebb and flow. By focusing on specific market behaviours and patterns, you can potentially identify when “smart money” institutional traders are quietly positioning for the next directional move.
In Part 2 we will explore how to identify the Distribution phase, which is equally important for recognising when the market may be topping out and preparing for a downturn. Look out for more insights on Market Dynamics!
Disclaimer: This is for information and learning purposes only. The information provided does not constitute investment advice nor take into account the individual financial circumstances or objectives of any investor. Any information that may be provided relating to past performance is not a reliable indicator of future results or performance. Social media channels are not relevant for UK residents.
Spread bets and CFDs are complex instruments and come with a high risk of losing money rapidly due to leverage. 80.84% of retail investor accounts lose money when trading spread bets and CFDs with this provider. You should consider whether you understand how spread bets and CFDs work and whether you can afford to take the high risk of losing your money.

EUR/USD: A Steady Rise Amidst Global Market DynamicsEUR/USD's Bullish Momentum: A Steady Rise Amidst Global Market Dynamics
The EUR/USD currency pair recently experienced a surge in its value, reaching close to the significant 1.1000 mark before encountering a slight retracement. This move comes after a rebound from the 38.2% Fibonacci level, confirming our earlier forecast of a renewed bullish impulse.
As of the latest update, the pair is currently trading around the 1.09560 area, demonstrating a positive trend. The backdrop for this ascent includes a favorable opening in Wall Street and decreasing US Treasury bond yields. Despite the release of better-than-expected Housing Starts data, the USD struggled to find traction, reflecting the impact of global market dynamics on currency valuations.
An additional factor influencing recent market movements is the soft inflation data from the UK, reigniting expectations for a potential Bank of England rate cut in the first half of the upcoming year. This development led to significant losses for the Pound Sterling against other major currencies. While the USD did absorb some capital outflows, the Euro stood out as an attractive option for investors, leading to EUR/GBP achieving a fresh three-week high above 0.8650.
Looking ahead, the scheduled speech by the Chicago Federal Reserve (Fed) President in the latter part of the day could introduce further dynamics to the currency markets.
Maintaining our bullish bias, we anticipate a continuation of the positive trend, especially considering the supportive factors in the global financial landscape. The pair's recent retracement could be viewed as a temporary pause before another potential climb towards our targeted levels. Investors will be keenly observing further market developments and central bank actions to gauge the future trajectory of EUR/USD.
Our preference
Long positions above 1.0800 with targets at 1.1010 & 1.1150 in extension.
Our previous Entry / Idea :

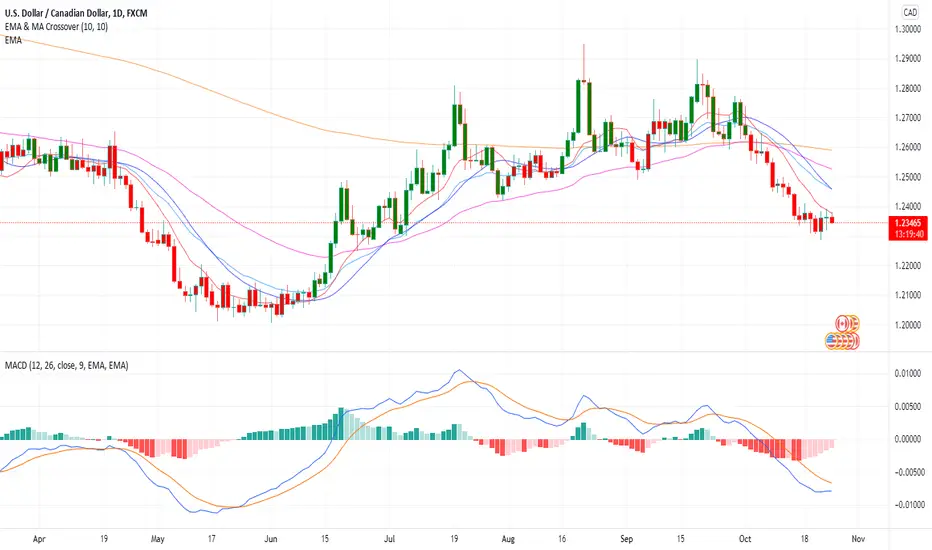
USD/CAD: the instrument develops flat dynamicsCurrent trend
USD has shown a moderate decline against CAD during the Asian session, developing mixed trading dynamics in the short term.
Investors continue to focus on the situation with increased inflation, which forces the leading central banks of the world to act somewhat faster than the previously indicated timeframes. Thus, the US Fed and the Bank of Canada are already quite close to a possible tightening of monetary policy. Many analysts suggest that the US regulator will announce the reduction of its quantitative easing (QE) program already at the November meeting.
The macroeconomic statistics from the USA and Canada published on Friday turned out to be quite optimistic; however, the dynamics of the instrument was largely influenced by the Canadian data. Retail Sales in Canada increased by 2.1% MoM in August after falling by 0.1% MoM (revised from –0.6% MoM). The real dynamics turned out to be very close to the market forecasts at the level of 2.0% MoM. Retail Sales excluding Autos for the same period increased by 2.8% MoM after falling by 0.4% MoM in July.
Support and resistance
Bollinger Bands in D1 chart demonstrate a stable decrease. The price range is narrowing, pointing at the ambiguous nature of trading in the short term. MACD is reversing to growth forming a weak buy signal (located above the signal line). Stochastic increases more confidently, which, however, weakly correlates with the real trend in the market.
Resistance levels: 1.2400, 1.2445, 1.2500, 1.2558.
Support levels: 1.2335, 1.2300, 1.2245, 1.2200.
XAU/USD: the “bullish” dynamics limited by strong dollar positiCurrent trend
Today during the Asian session, gold prices grow, consolidating around $1760.00 per troy ounce.
The general low demand provides moderate support for the risk instrument. However, further development of the “bullish” dynamics is limited by strong USD positions. Investors expect the US Federal Reserve to announce a reduction in the current quantitative easing program. According to some forecasts, this may happen during the November meeting of the regulator. Additional support for gold quotes was provided by the renewed forecasts from the International Monetary Fund published yesterday. As expected, the Fund revised its forecasts for the growth of the US economy and the world economy as a whole by 0.1%.
On Wednesday, investors are focused on September US statistics on the dynamics of consumer prices. Also, during the day, the Meeting Minutes of the Federal Open Market Committee of the US Federal Reserve System will be published, and a monthly report on the state of the budget for September will be released.
Support and resistance
On the daily chart, Bollinger Bands grow slightly. The price range expands from above, letting the “bulls” renew local highs. MACD grows, maintaining a poor buy signal (the histogram is above the signal line). Stochastic broke off a steady decline and reversed into a horizontal plane near the level of 20.
The current readings of technical indicators do not contradict the further development of the upward dynamics in the nearest time intervals.
Resistance levels: 1772.70, 1782.19, 1790.00, 1800.00.
Support levels: 1760.74, 1750.44, 1740.00, 1730.00.

Duality Blockchain Solutions, WHAT IS THIS, UNDER 1 MILL M/CAP?!"WHO OR WHAT IS DUALITY?
“Duality” is a community-driven project that emerged during the 2014 altcoin boom and took its final form in 2017 as Duality Blockchain Solutions LLC. We at Duality believe that real innovation happens at the fringe by real people with pragmatic answers and prompt implementations to fundamental problems. Duality, as a social construct, aspires to evolve by staying true to its roots."
ALL COPIED FROM THEIR WEBSITE. (I AM SUPER CLASSY)
"OUR MISSION
Contributes to society by offering BaaS (Blockchain as a Service)."
"OUR VISION
Secure end-user purchasing power with an internal economy using blockchain technology."
"OUR VALUES
Maintain financial sovereignty and improve societal standards."
STILL BEING COPIED FROM THEIR WEBSITE.
2018-01-07
Financial Report
Duality update with Year-End Financial Report
2018-03-10
Trademarks
Register Trademarks
“DUALITY” Serial No. 87828748
“THINK INSIDE THE BLOCK” Serial No. 87828746
2018-06-19
Submit Patents
Submit Patents (June 19, 2018 – July 1, 2019)
“BDNS”
“BDAP”
“BISP”
2018-08-15
New Block Explorers
Updated DYN and SEQ Block Explorers
2018-08-20
Release Memo
Duality International Website, Dynamic v2.3, Sequence v1.2 Release Memo
2018-08-27
Website Debut
Website debut of Duality.International
2018-08-27
Dynamic Release
Dynamic v2.3.0.0 release
2018-08-27
Sequence Release
Sequence v1.2.0.0 release
2018-09-03
Marketing
Marketing Campaign start
2018-09-21
Dynamic 2.3.5.0
Release of updated Dynamic wallet.
2018-09-24
Partnership Announcement
Use-case Partnership Announcement
2018-10-24
Dynode Hosting
Dynode Hosting on Duality.International
2018-11-01
Fluid protocol
Extend fluid sovereignty protocol
2018-11-26
BDAP announcement
BDAP technical whitepaper release
2019-01-18
BDAP Demo
BDAP working demo: PrivateShare or pShare
2019-02-06
Dynamic Memo
Dynamic v2.4 Release Memo
2019-02-11
Dynamic Release
Dynamic v2.4.0.0 Release
2019-04-30
Smart Contracts
Smart Contracts
2019-05-31
Mobile Wallets
Dynamic & Sequence Mobile Wallets
2019-09-30
Dynamic Drive
Dynamic Blockchain Drive: PrivateDrive or pDrive
DYOR

NZD/USD: the pair’s dynamics is flatCurrent trend
During the trading session on Thursday, September, 28, NZD grew against USD, despite the renewing of the local minimum since September, 5. The US dollar is under pressure due to the technical correction in the end of the week and the controversial information upon the tax reformation, which details were disclosed yesterday.
The investors were slightly disappointed with the reformation, as the shown plan almost didn’t contain any new details and didn’t explain how the tax income would be reduced without significant growth of the budget burden.
During the morning session the instrument is decreasing, and the traders are waiting for the new drivers, and there will be plenty of them in the last trading day of the week. In particular, the Personal Consumption statistics is due at 14:30 (GMT+2) in the USA.
Support and resistance
On the daily chart Bollinger Bands’ dynamics is flat. The price range is widening. The indicator’s readings don’t contradict with the correctional dynamics development within the channel trading strategy.
MACD is going down, keeping a weak sell signal (the histogram is below the signal line). It’s better to wait until the situation is clear, as the current readings are uninformative.
Stochastic is trying to reverse into growth, which reflects the possibility of the correctional upward dynamics development in the short term.
Resistance levels: 0.7237, 0.7262, 0.7297.
Support levels: 0.7215, 0.7181, 0.7165, 0.7130.
Trading tips
Long positions can be opened after the breakout the level of 0.7237. Take profit is 0.7297. Stop loss is 0.7200. Implementation period: 2 days.
The return of the “bearish” trend and the steady breakdown of the level of 0.7181 can be a signal to open short positions with the targets at 0.7130–0.7100. Stop loss is 0.7220. Implementation period: 2–3 days.

ZBEC Network (ZBCN) Holds Dynamic SupportZBCN price action remains constructive despite recent corrections, as it continues to respect a dynamic support zone that has generated consecutive higher lows. This region has historically served as a base for bullish reversals, and its defense will determine whether price can rotate back toward channel resistance.
Key Technical Points
- Dynamic Support: Price holding at a critical level that has anchored the uptrend.
- Higher Lows Intact: Structure remains bullish as long as this base holds.
- Channel Resistance Target: Breakout requires strong bullish inflows.
ZBCN has established a pattern of higher lows since the base of its previous impulsive rally. Each test of dynamic support has resulted in a bounce, underscoring its importance in sustaining the broader trend.
From a technical perspective, the current region represents a critical inflection point. A rebound here would keep the bullish structure intact and open the path toward the channel’s dynamic resistance. However, failure to hold this zone could compromise the trend, signaling deeper corrective action.
The channel itself continues to frame price action, providing both resistance and support. Traders will be watching for a retest of the upper boundary, which would confirm renewed strength in momentum.
What to Expect in the Coming Price Action
ZBCN sits at a pivotal support zone. As long as dynamic support holds, the bullish case remains valid with a likely rotation toward channel resistance. Traders should watch for volume confirmation to validate the move. A breakout above resistance would signal strength for further expansion, while failure to defend support risks unwinding the bullish structure.

TradeCityPro | Blur : Dynamic Support Holding👋 Welcome to TradeCityPro!
In this analysis, I will explore Blur, a gaming project, focusing on the daily timeframe to assess its current price action and potential scenarios.
📅 Daily Timeframe: Correction to Dynamic Support
On the daily chart, Blur has been following an ascending trendline that acts as a dynamic support, propelling the price upward after every interaction.
🔍 Recently, the price experienced a fake breakout below this dynamic support, which was quickly followed by increased buying volume and a surge in bullish momentum. As a result, Blur managed to break through the $0.2827 and $0.3314 resistance levels, climbing as high as $0.4438.
🔽 Currently, the price has corrected in two stages and returned to the $0.2827 level, which aligns with the dynamic support. The RSI, after breaking below the 50-level, has supported this deeper correction. If the dynamic support fails to hold and the price trend shifts, the primary support will be at $0.1464.
📈 If the resistance at $0.4438 is breached, the first target is $0.5539, a notable resistance level. The main target is $0.8077, the ATH, which doubles as a critical supply zone due to its significance in price history.
✨ The RSI lacks a clear bullish trigger currently, as no new structure has formed. However, if RSI confirms a bullish momentum resurgence and trading volume increases, the chances of breaking through $0.4438 will significantly improve.
🔑 Market Sentiment and Advice
The market is currently undergoing broad corrections, causing FOMO and uncertainty among traders. However, these pullbacks are natural and essential for sustaining the market’s broader uptrend.
💥 Here’s a reminder for effective trading during volatile times:
Avoid impulsive decisions driven by fear or greed.
Ensure risk and capital management is a priority. Proper management safeguards you from significant losses during corrections, preserving capital for long-term growth.
📝 Final Thoughts
This analysis reflects our opinions and is not financial advice.
Share your thoughts in the comments, and don’t forget to share this analysis with your friends! ❤️ above.

USD/CAD:Dynamics Ahead of the US Election BOC DecisionsDynamics Ahead of the US Election and Bank of Canada Rate Decisions
As the United States approaches its pivotal presidential election, the US Dollar (USD) is experiencing downward pressure. This uncertainty is impacting the broader market sentiment, leading traders to adopt a cautious stance. However, the upward trajectory of US Treasury yields may provide a buffer against further declines in the dollar’s value. Currently, the US Dollar Index (DXY), which gauges the dollar's strength against six major currencies, is trading around 103.80. At this moment, the yields on 2-year and 10-year US Treasury bonds stand at 4.17% and 4.30%, respectively, indicating investor confidence in longer-term government debt.
Turning to Canada, the Bank of Canada (BoC) is gearing up for its final monetary policy meeting of the year in December, where a significant rate cut is widely anticipated. BoC Governor has signaled the possibility of a reduction by as much as 50 basis points (bps). This potential lowering of interest rates could influence the Canadian dollar's valuation and the overall economic landscape.
From a technical perspective, the market shows signs of a bullish seasonal trend; however, the latest Commitment of Traders (COT) report suggests the potential for a price drop, particularly in alignment with identified supply zones. As we navigate through these evolving conditions, the outcome of the US election will likely have profound implications for currency movements and economic policies in the coming days. Traders will need to stay vigilant as these developments unfold, shaping market dynamics in both the US and Canada.
✅ Please share your thoughts about USD/CAD in the comments section below and HIT LIKE if you appreciate my analysis. Don't forget to FOLLOW ME; you will help us a lot with this small contribution.

ImmutableX Bullish Dynamics RevealedThis is part of the TOP50, so I will do a trade-idea on the Tether (USDT) pair for this one with the accumulation zone and strategy.
Doing good, right?
I am doing great, as usual...
I will be pointing out the obvious, I would like to mention the price dynamics on this chart, as simple as it can get.
➖ A bullish wave leads to a bearish wave.
➖ A bearish wave leads to a bullish wave.
The last bearish wave also produced the shark pattern, the one we saw on a different post a few days back.
There is potential for a bullish wave based on a long-term double bottom, marketwide action, the price dynamics mentioned above, reversal candlesticks and so on.
This is a strong project.
Namaste.

Oil Prices: Geopolitical Tensions and Market DynamicsOil prices have once again surged, reaching nearly $88.00 per barrel, despite a recent minor decline. This uptick in prices is occurring amidst a backdrop of geopolitical tensions and a strengthening US Dollar. However, amidst this volatility, it's essential to dissect the various factors influencing oil prices, from geopolitical unrest to economic forecasts and technical indicators.
Geopolitical Tensions and Market Sentiment:
Geopolitical tensions often act as a catalyst for oil price volatility. Conflicts in oil-producing regions can disrupt supply chains and lead to uncertainty in the market. Recent geopolitical events have heightened concerns, contributing to the surge in oil prices. However, it's crucial to note that while geopolitical factors can trigger short-term spikes, their long-term impact is contingent on broader market dynamics and economic fundamentals.
Impact of Economic Forecasts and Electric Vehicle Market Growth:
The International Energy Agency (IEA) recently revised its oil demand forecast for the current year and the next, citing a lackluster economic outlook and the growing market share of electric vehicles (EVs). This adjustment underscores the evolving landscape of energy consumption, with EVs exerting pressure on traditional oil demand. As such, forecasts of slower growth in oil demand highlight the need for adaptability within the energy sector.
Technical Analysis and Trading Strategies:
Technical analysis plays a pivotal role in navigating oil price fluctuations. Assessing indicators such as the Relative Strength Index (RSI) and Fibonacci levels provides insights into market sentiment and potential price movements. Currently, the confluence of signals, including RSI divergence and overbought conditions, suggests caution. Additionally, the absence of a significant retracement to the 78.6% Fibonacci level warrants a strategic approach to setting stop-loss levels and identifying potential entry points.
US Dollar Strength and Interest Rate Differentials:
The recent rally in the US Dollar Index (DXY) underscores market expectations of a widening interest-rate differential between the Federal Reserve (Fed) and other central banks. This divergence in monetary policy influences currency movements and has implications for commodities priced in dollars, such as oil. Understanding the interplay between currency dynamics and oil prices is essential for informed decision-making in trading and investment strategies.
In addition to fundamental and technical analyses, seasonality patterns offer valuable insights into market behavior. By examining historical price trends during specific times of the year, traders can identify recurring patterns and optimize their trading strategies accordingly. Incorporating seasonality analysis alongside other analytical tools enhances the robustness of decision-making processes and mitigates risks associated with market volatility.

EUR Outlook: Assessing Market DynamicsIn the realm of currency markets, the Euro (EUR) remains a focal point for traders and investors alike. As a financial analyst, it's imperative to dissect current market dynamics and provide insights for navigating EUR-related assets.
Currently, the EUR faces a complex landscape, influenced by a multitude of factors. Market sentiment surrounding the Eurozone economy, monetary policy decisions from the European Central Bank (ECB), and geopolitical developments all contribute to the EUR's trajectory.
Amidst these dynamics, the EUR is navigating key support and resistance levels, with its performance influenced by broader trends in global currencies. Additionally, economic data releases, such as inflation figures and GDP reports, serve as crucial catalysts for EUR price movements.
As we assess the EUR's outlook, it's essential to remain vigilant for emerging trends and adapt trading strategies accordingly. Whether capitalizing on short-term fluctuations or positioning for long-term trends, a comprehensive understanding of market fundamentals is paramount for success in trading EUR-related assets.
