Dynamic ===LONG to 70K to 85KDynamic breakout.....can go above till 70K to 85K and then possibly above 100K
Search in ideas for "Dynamic"

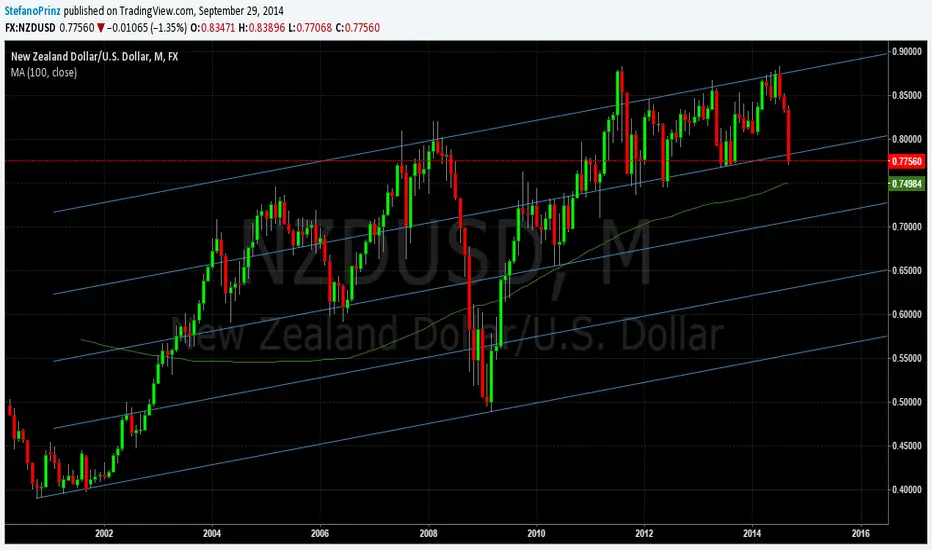
DynamicIn the short term I see a rising dynamic afer the failed attempt to break up. This seems to be another probably successful attempt.

Dynamic Trading Roadmap for XAU/USDThis roadmap is written as a dynamic, evolving story that reacts to price movements on XAU/USD, based on the 30-minute chart as the main timeframe. It integrates the 5-minute chart for precision, 1-hour and 4-hour charts for confluence, and the daily chart for trend context.
Step 1: Setting the Scene
Starting Conditions:
Primary Levels to Watch:
Resistance: $2,645 (VWAP Upper Band and VAH).
Support: $2,628 (VWAP Lower Band and VAL).
POC: $2,637 (Volume Magnet Zone).
Trend Context:
Daily: Price in an uptrend; market sentiment is bullish.
4-Hour: Consolidation near $2,645 suggests indecision.
30-Minute: Price is testing VWAP deviations, showing potential for both breakout and mean reversion.
Step 2: Entry Types
Scenario A: Normal Long
Setup: If price pulls back to VWAP Lower Band ($2,628) and forms bullish confirmation:
5-Min Confirmation: Bullish engulfing or pin bar.
Indicators: RSI rising from 40, A/D showing accumulation.
Execution:
Entry: Buy at $2,628.
SL: $2,620 (below VWAP deviation low).
TPs:
TP1: $2,637 (POC).
TP2: $2,645 (VWAP Upper Band).
TP3: $2,650 (Fibonacci 1.618 Extension).
Scenario B: Normal Short
Setup: If price rallies to VWAP Upper Band ($2,645) and shows bearish divergence on RSI or A/D:
5-Min Confirmation: Shooting Star or Bearish Engulfing.
Indicators: RSI above 70, volume decreasing.
Execution:
Entry: Sell at $2,645.
SL: $2,652 (above liquidity spike).
TPs:
TP1: $2,637 (POC).
TP2: $2,628 (VWAP Lower Band).
TP3: $2,620 (liquidity drain).
Scenario C: Breakout Trade
Setup:
Bullish Breakout: Price closes above $2,645 on the 30-min chart with strong volume.
Bearish Breakout: Price closes below $2,628 on the 30-min chart with momentum.
Execution:
Long Breakout:
Entry: $2,648 (above breakout candle).
SL: $2,640.
TP1: $2,655, TP2: $2,660, TP3: $2,670.
Short Breakout:
Entry: $2,625 (below breakout candle).
SL: $2,632.
TP1: $2,620, TP2: $2,612, TP3: $2,600.
Scenario D: Momentum Trade
Setup:
Enter when price strongly rejects VWAP deviations with increasing volume.
Look for RSI and MACD alignment.
Execution:
Entry: At rejection levels (e.g., $2,628 or $2,645).
SL/TP: Follow same rules as "Normal Long" or "Normal Short."
Scenario E: Reversal Trade
Setup:
If price hits $2,645 and sharply reverses with a Shooting Star or RSI divergence.
If price touches $2,628 and bounces with Pin Bar and MACD bullish crossover.
Execution:
Flip positions when reversals are confirmed.
Follow breakout or mean reversion rules for SL and TP.
Step 3: What-If Scenarios
What If the Price Moves Up?
Breaks $2,645:
Action: Go long at $2,648 with TP1: $2,655, TP2: $2,660, TP3: $2,670.
Scaling In: Add 0.3 lots at $2,650 if volume increases.
TSL: Trail by 5 points after TP1 is hit.
Hits $2,645 and Reverses:
Action: Enter short at $2,645 with TP1: $2,637, TP2: $2,628.
Scaling Out: Exit 0.5 lots at TP1, 0.3 lots at TP2, hold 0.2 lots for TP3.
What If the Price Moves Down?
Breaks $2,628:
Action: Go short at $2,625 with TP1: $2,620, TP2: $2,612, TP3: $2,600.
Scaling In: Add 0.3 lots at $2,620 if momentum builds.
Hits $2,628 and Bounces:
Action: Enter long at $2,628 with TP1: $2,637, TP2: $2,645.
Scaling Out: Exit 0.5 lots at TP1, 0.3 lots at TP2, hold 0.2 lots for TP3.
What If Price Stalls?
At VWAP or POC ($2,637):
Tighten SL to break even if price stalls for more than 3 candles.
Watch for volume increase or decrease to determine breakout or reversal.
What If Momentum Changes?
Momentum Increases:
Add positions aggressively when volume and ADX align with the trend.
Momentum Decreases:
Scale out partially to secure profits and tighten SL to protect against reversals.
Step 4: Scaling In/Out Rules
Scaling In:
Add 0.3 lots at major break levels (e.g., $2,648 for long, $2,625 for short).
Ensure volume confirms the breakout.
Scaling Out:
Exit 0.5 lots at TP1 to lock in quick profits.
Exit 0.3 lots at TP2 to secure mid-level gains.
Leave 0.2 lots for TP3 with a trailing stop to ride the trend.
Step 5: Volume Breakouts and RSI Divergences
Volume Breakouts:
Enter aggressively in the direction of the breakout.
Ensure TP1 is conservative to capture immediate moves.
RSI Divergences:
Look for bearish divergence at resistance ($2,645).
Look for bullish divergence at support ($2,628).
Use these as reversal signals to flip positions dynamically.
Step 6: Dynamic Actions at Key Levels
At $2,645:
Short if divergence or reversal occurs.
Long if breakout occurs with volume.
At $2,628:
Long if bounce confirmation appears.
Short if breakdown happens with momentum.
At $2,637 (POC):
Reassess trend direction if price consolidates.
This roadmap evolves dynamically, ensuring clear actions based on live price behavior, making it adaptable for any market scenario.


“Dynamic Liquidity Analyzer” Trendlines
The white lines are the markers of order amidst chaos. Solid and dashed, they connect critical highs and lows, serving as pathways that reveal the future of price action. They outline the potential for breakouts or breakdowns—decision points where the market bows to our strategy.
These lines carve the battlefield, where traders either rise or fall. These highs and lows are structured almost uniquely, deviating from the conventional setup of ordinary highs and lows.
Volume Weighted Average Price (VWAP)
The blue stair-step line is no ordinary indicator—it is the foundation of fair value. This VWAP dynamically calculates the average price weighted by volume, serving as a stronghold for price action. The market respects it as a key support and resistance level. A bounce off this VWAP is a signal of bullish resurgence, while a break below hints at bearish momentum. It’s not just a line—it’s the axis around which the market pivots.
Indicator
This is the pinnacle of liquidity visualization. The lines below are not mere decorations—they are the heartbeat of the market:
• Orange (Bitcoin Price): The core driver of the current movement.
• Yellow (BTC.D Moving Average): The critical indicator of Bitcoin dominance. When BTC.D rises, Bitcoin often gains strength at the expense of altcoins. When BTC.D falls, altcoin liquidity flows upward.
• Blue (TOTAL3 Moving Average): The maestro of altcoins, showcasing their potential for explosive growth.
This tool mirrors liquidity flows, signaling shifts in dominance. As Bitcoin moves downward, we see Bitcoin price rise; when Bitcoin moves upward, Bitcoin price moves downwards. This interplay reveals the unseen mechanics of the market.
Volume Profile (Left Sidebar)
The red and green histogram bars are the battlegrounds of buyers and sellers:
• Red bars: High selling activity, barriers the bulls must conquer.
• Green bars: Strongholds of buying strength, where the bulls rally their forces.
As of now, the price dances near high-volume nodes—key zones of contention. Victory lies in breaking free from these areas, unleashing powerful directional moves.
Custom Candles
These candles are the secretive arsenal of this strategy, meticulously designed to expose manipulation, price inconsistencies, and pivotal moments in the market. They are crafted to reveal when the market is preparing for massive moves while remaining subtle in their true power. They keep the edge sharp without revealing too much.
Altcoin and Bitcoin Insights
This is a live battlefield where updates reign supreme. Altcoins are testing their waters, and Bitcoin pumps are set to reignite soon. I will be providing updates for short trades as manipulation keeps unfolding and inconsistencies present themselves.
Note: The VWAP has been condensed into a 5-day timeframe to align seamlessly with the chart, while the indicator operates on a 1-day timeframe. Additionally, it dynamically reflects insights from the 4-hour timeframe, offering a multi-dimensional view of price action.
(Global liquidity is where prices are headed)

Dynamics of NIFTY50 21750 March 2024 Call OptionDate: 20-03-2024
As a seasoned derivatives trader, I find myself constantly immersed in the intricate dance of market movements, option data, and technical analysis. Today, I delve into the world of NIFTY50 futures and options, particularly focusing on the March 2024 contract. Join me as I unravel the insights gleaned from my custom-built software, MRISKA DTS5, and share my perspective on the probable expiry level in terms of the strike price for this contract.
Let's embark on this journey by stepping back to the 29th of February 2024, the day the Nifty50 February 2024 contract expired. On that date, the Nifty50 spot settled at 21982.80, setting the stage for our analysis. One of the key observations from my data exploration was the significant short buildup in the 21750 call option .
The 21750 call option caught my attention with its last traded price of 626.10 and a stop loss level of 922.30, valid until 28th March 2024. Tracking its performance from 29-02-2024 to 20-03-2024, the option saw its highest high at 915.00 on 06-03-2024. Fast forward to today, the Nifty50 spot closed at 21839.10, while the 21750 call option stood at 262.40.
At this juncture, two distinct possibilities emerge. The first scenario entails the 21750 call option hitting the stop loss level of 922.30 by 28th March 2024. This outcome would signify a substantial move in the market, reflecting the dynamic nature of derivatives trading.
Conversely, the second scenario revolves around the Nifty50 spot settling below 21750 by the contract's expiry. This scenario hinges on various factors such as market sentiment, economic indicators, and global events that can influence market movements.
It's crucial to emphasize that my analysis and views are purely educational and should not be construed as trade recommendations. Derivatives trading demands a comprehensive understanding of risk management, market dynamics, and thorough research, which are essential for informed decision-making.
In conclusion, navigating the complexities of NIFTY50 futures and options requires a blend of data-driven insights, technical expertise, and a nuanced understanding of market behavior. As we approach the expiry of the March 2024 contract, the unfolding dynamics will offer valuable lessons and opportunities for traders and investors alike. Stay tuned for further updates as we continue to explore the ever-evolving landscape of financial markets.

Dynamic Support and Resistance One really cool feature of the Maverick Supporter indicator is the ability to show support and resistance dynamically.
This is very helpful for identifying levels after price has broken out of a trend or a level.
It's probably obvious to you, but the green shaded region is the support region and the red is resistance.


dynamic trading on audnzdtwo senarios in wave analys > however we wait for up cross in 4h DT ocillator to start a short uptrend

TRXBTC: We've seen this before. It's OK to short now, bears.Dynamic pitchfork fractal suggests going short, TRXBTC, is not unconscionable.

"Dynamic Liquidity Execution" Bitcoin’s price action is currently playing out exactly as anticipated. The green candles represent my whale-coded signals, indicating areas where major players are stepping in.
Price Target & Rejection Levels:
My initial target is $90,883, but there's potential for a higher move before rejection. However, this move is not genuine—it's a temporary bull release before the real rejection sets in.
Smart Money Trap & Price Rejection:
The red horizontal line marks the True Value Line, which acts as a smart money trap—a deceptive level designed to lure liquidity before price gets rejected. Meanwhile, the green horizontal line represents an equal low, a key area where price may reject.
Trend & Expansion to Squeeze Shift:
Looking at the first whale-coded candle and comparing it to the second, my specialized indicator (tracking Altcoins, USDT.D, and Bitcoin) reveals a clear expansion phase transitioning into a squeeze. This indicates that a volatility contraction is on the horizon, preparing for a significant move.
Guidance for Price Action:
The dotted trendlines and regression channels are used to guide price action, keeping the broader structure in check.
The Reality Behind This Move:
This bullish push is temporary—dark pools will step in once again to reject Bitcoin’s price. This aligns with the squeeze setup forming, reinforcing the probability of a controlled rejection rather than a genuine breakout.
I will be executing both **short and long positions** dynamically as price evolves, adapting to key liquidity shifts and market structure changes. Each entry will be based on confirmed reactions at strategic levels, ensuring precision in capturing both **rejections and breakouts** as they unfold.
Altcoin Wave Breakdown & Market Rotation
Right now, the Altcoin Wave is rolling over, which means altcoin strength is fading. This signals that capital is starting to move out of alts, either into Bitcoin, stablecoins (USDT.D), or sitting on the sidelines.
Altcoin Trend (Yellow Line): The wave peaked and is now declining—this suggests altcoins are losing momentum and could see a pullback.
USDT.D Trend (Green Line): If this starts rising, it confirms money is leaving altcoins into stablecoins, meaning traders are shifting to safety.
Bitcoin Trend (Orange Line): Right now, BTC’s trend isn’t reclaiming strength yet. If it starts to climb while alts drop, we’re looking at a rotation from altcoins back into Bitcoin—a classic market shift before BTC dominance rises.
Squeeze Warning: Volatility Expansion Incoming
My indicator is showing a squeeze is about to begin, meaning volatility is contracting and a big move is on the horizon.
With the Altcoin Wave rolling over, this is setting up for altcoin weakness unless liquidity shifts back in.
Bottom Line:
If USDT.D spikes, alts will bleed.
If Bitcoin gains strength while alts weaken, BTC will take liquidity from the altcoin market.
A squeeze means a major move is coming—watch for the breakout direction.
This isn’t a random dip—smart money is repositioning, and altcoins might react. Stay ahead of the move.

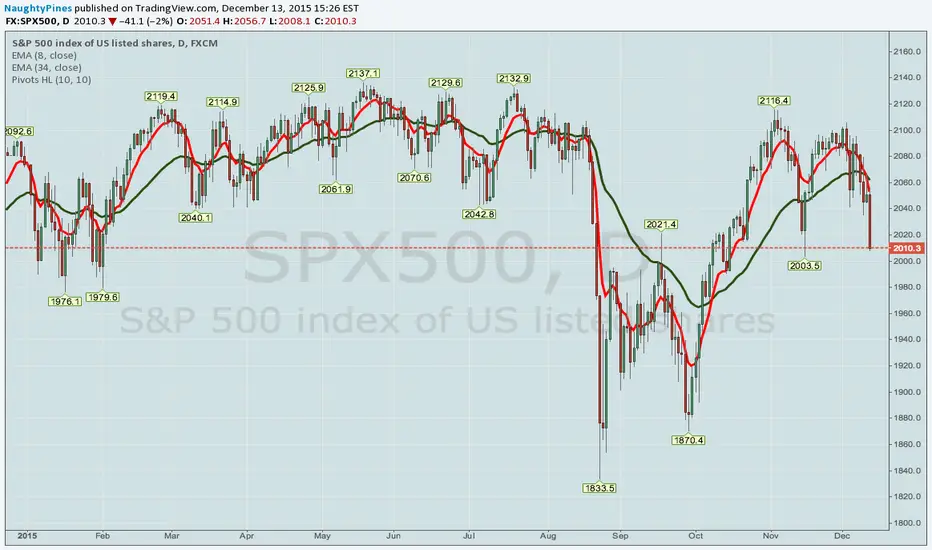
DYNAMIC IRON CONDOR MANAGEMENTSeveral days ago (before we had this downmove/volatility pop), I set up a long-term SPY iron condor, my intent being to manage it "dynamically" over time, rolling my options intratrade as price moved either toward my short put wing or toward my short call wing.
The original setup was a March 18th 166/169/219/222 SPY iron condor, for which I originally received a fairly paltry .71 in credit. In my earlier post, I discussed various options for managing the setup intratrade: (1) rolling the wings as a unit toward current price; (2) leaving the long options alone and moving only the short options toward current price; and (3) moving both the long options away from current price and the short options toward current price. I pointed out the pluses and minuses of each of these methodologies, with the preference being toward moving the wings as a unit toward current price.
In the interest of experimentation (and also to capture greater credit than that offered by merely rolling the call side wing down three strikes), I'm going to opt to roll the short call toward current price and the long put away from current price at the same time and by the same number of strikes to capture credit generated by this down move (i.e., I am going to roll the 219 short call to the 216 and the 166 long put to 163 and will look to get a fill for an additional .77 credit/contract to do this). I chose the 216 short call strike, since that is currently at the edge of the current expected move for SPY for the March 18th expiration.
Should I get filled, the new iron condor will be a Mar 18 SPY 163/169/216/222 iron condor, so I will be widening the wings to six strikes wide by rolling the short call/long put in this manner. The upside is that I received .77 in credit for the intratrade roll (on top of the .71 I originally received); the downside is that widening the spreads requires some additional margin and could potentially give me a headache if I need to roll one of those 6-wides out for duration on the back end of the trade. Consequently, I naturally want to exercise caution going forward as to how many times I roll intratrade, keeping an eye on the width of the wings, the overall margin used, and whether I am getting too aggressive by bringing in the wings too tightly to current price.
Dynamic Square of 9 levels in time & priceThis chart is made to showcase the power of the dynamic square of 9 levels in time and price.
I'd watch for square-outs at the 180° & 360°; when the price reaches 360°, 180° vertical and horizontal at the same time.
The dynamic square of 9 script is set to start from the high at $1/° ( meaning a $1 move per candle ), you can lay a gann fan to visualize the speed of the asset to monitor where it is and if deviates away from the $1/° set value. Generally speaking when it gets higher than the 8:1 the likelihood of a reversal increases and you might want to reconsider your dynamic square of 9 placement.

Dynamics in foreign marketsThe first auction of the current week at domestic sites will be influenced by dynamics in foreign markets on the previous day, non-trading for Russia. The movement of quotations will be multidirectional, the Moscow Stock Exchange index will remain within the range of 3100-3120 points.

Dynamic Time Based Premium/Discount BTC day trade 1/1/25Today's chart is nice and simple, nothing crazy.
BTC for today has built its premium and discount zones based on time and price. NYO built the premium zone, and the True Daily open built the discount zone.
We are looking for price to push into the FVG located around 94,900. The reason it is that FVG because if you look closely, it will align perfectly with the blue quarter, so we should expect price to go up to that point between 9:30 and 11:00 am EST, followed by a drop down to the liquidity created beneath the True Daily open discount zone near 92,700.
Stop loss at 95,600.
PM Session should take us down gently towards the 92,700 take profit.
These dynamic prices are based on the dynamic time based premium and discount model theory and they are pretty accurate.
Happy trading.

Dynamic Resistance & Trend line Breakout -Bitcoin chart analysisHello Traders,
33000 to 33150 have been acting as a supply zone for Bitcoin for a long time. You can see a dynamic resistance on the 4 hour chart, which is also shown in the chart. The last 3 times the price was correct from there. Supply Zone and Dynamic Resistance are broken. Hope for a good upmove from here. The volume of the breakout candle has also increased, which gives a little more confidence.
Apart from this head & shoulder pattern and pole & flag pattern are also seen on the chart.
Strategy: Buy 33150-33000(Wait for Pull back)
ADD more@32600-32700
SL:31900
Target:34400/35500
Consult your financial advisor before taking any action.
Educational purpose only.
You can ask your question in the comments.

Dynamic Tred line break on Bitcoin chart | Go longLast week,We saw big fall in Bitcoin price.All bad news factored in the price. On the hourly chart of Bitcoin we can see dynamic resistance. We are looking for buying opportunity in Bitcoin. If price sustain above the dynamic resistance , then upside possible. Logic and level behind the trade marked on the chart.
Strategy::
Buy range:37600-38000
SL: 33400
Target:41200/45500
Educational purpose only.
Consult your financial advisor before taking any action.

Dynamic Range NVT Signal for Long-term Bitcoin ValuationABOUT DYNAMIC RANGE NVT SIGNAL
NVT Signal (Credit: woobull.com) is akin to a "PE" ratio for Bitcoin, and can be used to identify when Bitcoin is overbought or oversold based on the relative value of transactions sent across the network.
This indicator includes a 2 year moving average and standard deviation to identify outlier values, instead of declaring a static high-low range for relative valuation.
THEORY
A dynamic "high-low" range was chosen for the following reasons:
- Bitcoin is only 10 years old, it is likely that relatively "high" and relatively "low" NVT values will change with time, as have PE ratios over the last century.
- Some transactions are now made off-chain (eg. Liquid Network's private side-chain which is used by many major exchanges). If this trend continues, we can expect "normal" NVT ranges to increase with time (as the relative portion of public on-chain transaction values decreases).
CALCULATION
- NVT = Circulating Market Cap / 90 average On-chain Transaction Value*
- Overbought (default): NVT > 2-year mean + 2*standard deviations. I.e. NVT Signal is in the top 2.5% of values for the prior 2 years.
- Oversold (default) NVT < 2-year mean.**
*Data source: Blockchain.info, estimated transaction value does not include returned to sender as change.
**Oversold under 2-year mean was chosen due to the skewness of NVT Signal, it is not quite normally distributed. For example: NVT Signal has never been less than the 2-year mean - 2* standard deviations. This may change in the future.
NOTES ON USAGE
- Use with care. Bitcoin can remain "overbought" or "oversold" for extended periods (eg. 2015-2016).
- As Bitcoin ages, the validity of NVT Signal will need to be monitored. Particularly with respect to potentially increasing use of side-chains, private transactions and potentially the lightning network.
- It is likely that a 2-year “look back period” for calculating mean and standard deviation will not be sufficient in the decades to come. As Bitcoin matures and stabilizes (some time in the future), a longer "look back period" should probably be used. To allow for this, the defaults for this indicator can be easily adjusted.

Dynamic Market Scanner [Progressive] - Updates and Improvements!Friends, I’m excited to introduce the updated version of my Dynamic Market Scanner! This is the progressive version, which includes enhanced features and new capabilities for more accurate and efficient trading.
In the screenshot, you can see how the indicator performs in real market conditions. I plan to release it very soon, so make sure to follow my profile to stay updated!
I’d love to hear your thoughts on the new version — what do you think of the idea, and what can be improved? Feel free to share your comments and experiences!"
This should help engage your audience and encourage feedback in the comments!

Dynamic Trio: $85K, Trendline, and EMA in FocusThe $85,000 level is a key confluence zone, combining horizontal support, the rising trendline, and the 100 EMA as dynamic support.
This area is critical for potential bullish momentum. Monitor closely for price reactions, as holding this level could trigger a bounce, while a breakdown may lead to further downside.

dynamic support buying areaas we can see the overall trend is an uptrend, with buyers in control. The market has reached our support where it might buy, to enter this trade it's best to wait for a breakout above the dynamic support(blue lines) then enter using H1(bullish candlestick confirmation)

Dynamic Square of 9 and local boxThe chart on the left represents the square of 9 levels - dynamic - with selected top at the recent local high projecting downward. Invalidation would most likely be above the 2/1 Gann fan line.
The chart on the right is the local box, that if it holds should be interesting to watch and trade imo with keeping in mind that the invalidation is pretty close lower.
