Neogen Corporation (NEOG) Stage Dynamics Method - LongStrategy Overview: Stage Dynamics Method
Our innovative trading strategy, "The Stage Dynamics Method", is anchored in the synthesis of advanced technical analysis. The strategy employs three powerful indicators: the Stage Analysis Indicator (SAI), the Volume Sentiment Ratio Indicator (VSI-CR), and the Net-Buy-Net-Sell Volume Ratio Indicator (NBNS). These tools work in harmony to pinpoint potential entry and exit signals by analyzing market stages, volume dynamics, and sentiment shifts.
Why Now Is a Good Time to Enter
The SAI is currently showing a shift from a neutral phase into a bullish stage, indicated by a change in the background color to blue. This transition is supported by the monthly and weekly VSI-CR, which reveals a rising trend in combined buy/call ratios, signaling strengthening market optimism. Additionally, the NBNS highlights a dominant buying pressure over selling, reinforcing the bullish outlook.
What to Look for When Exiting
Monitor only the Monthly VSI-CR closely. An exit signal is triggered when the VSI-CR value falls below 0.65, indicating a weakening in bullish sentiment and a potential shift in market dynamics.
Risk Management Reminder
As with any trading strategy, it's crucial to practice sound risk management. Ensure that your investment aligns with your risk tolerance and financial objectives. The Stage Dynamics Method is a powerful tool, but like all trading strategies, it is not infallible. Stay informed, stay cautious, and trade wisely. Happy trading!
Search in ideas for "Dynamic"

Newell Brands (NWL) - Stage Dynamics Method - LongStrategy Overview: Stage Dynamics Method
Our innovative trading strategy, "The Stage Dynamics Method", is anchored in the synthesis of advanced technical analysis. The strategy employs three powerful indicators: the Stage Analysis Indicator (SAI), the Volume Sentiment Ratio Indicator (VSI-CR), and the Net-Buy-Net-Sell Volume Ratio Indicator (NBNS). These tools work in harmony to pinpoint potential entry and exit signals by analyzing market stages, volume dynamics, and sentiment shifts.
Why Now Is a Good Time to Enter
The SAI is currently showing a shift from a neutral phase into a bullish stage, indicated by a change in the background color to blue. This transition is supported by the monthly and weekly VSI-CR, which reveals a rising trend in combined buy/call ratios, signaling strengthening market optimism. Additionally, the NBNS highlights a dominant buying pressure over selling, reinforcing the bullish outlook.
What to Look for When Exiting
Monitor only the Monthly VSI-CR closely. An exit signal is triggered when the VSI-CR value falls below 0.65, indicating a weakening in bullish sentiment and a potential shift in market dynamics.
Risk Management Reminder
As with any trading strategy, it's crucial to practice sound risk management. Ensure that your investment aligns with your risk tolerance and financial objectives. The Stage Dynamics Method is a powerful tool, but like all trading strategies, it is not infallible. Stay informed, stay cautious, and trade wisely. Happy trading!

Douglas Emmett (DEI) - Stage Dynamics Method - LongStrategy Overview: Stage Dynamics Method
Our innovative trading strategy, "The Stage Dynamics Method", is anchored in the synthesis of advanced technical analysis. The strategy employs three powerful indicators: the Stage Analysis Indicator (SAI), the Volume Sentiment Ratio Indicator (VSI-CR), and the Net-Buy-Net-Sell Volume Ratio Indicator (NBNS). These tools work in harmony to pinpoint potential entry and exit signals by analyzing market stages, volume dynamics, and sentiment shifts.
Why Now Is a Good Time to Enter
The SAI is currently showing a shift from a neutral phase into a bullish stage, indicated by a change in the background color to blue. This transition is supported by the monthly and weekly VSI-CR, which reveals a rising trend in combined buy/call ratios, signaling strengthening market optimism. Additionally, the NBNS highlights a dominant buying pressure over selling, reinforcing the bullish outlook.
What to Look for When Exiting
Monitor only the Monthly VSI-CR closely. An exit signal is triggered when the VSI-CR value falls below 0.65, indicating a weakening in bullish sentiment and a potential shift in market dynamics.
Risk Management Reminder
As with any trading strategy, it's crucial to practice sound risk management. Ensure that your investment aligns with your risk tolerance and financial objectives. The Stage Dynamics Method is a powerful tool, but like all trading strategies, it is not infallible. Stay informed, stay cautious, and trade wisely. Happy trading!

American Airlines (AAL) - Stage Dynamics Method - LongStrategy Overview: Stage Dynamics Method
Our innovative trading strategy, "The Stage Dynamics Method", is anchored in the synthesis of advanced technical analysis. The strategy employs three powerful indicators: the Stage Analysis Indicator (SAI), the Volume Sentiment Ratio Indicator (VSI-CR), and the Net-Buy-Net-Sell Volume Ratio Indicator (NBNS). These tools work in harmony to pinpoint potential entry and exit signals by analyzing market stages, volume dynamics, and sentiment shifts.
Why Now Is a Good Time to Enter
The SAI is currently showing a shift from a neutral phase into a bullish stage, indicated by a change in the background color to blue. This transition is supported by the monthly and weekly VSI-CR, which reveals a rising trend in combined buy/call ratios, signaling strengthening market optimism. Additionally, the NBNS highlights a dominant buying pressure over selling, reinforcing the bullish outlook.
What to Look for When Exiting
Monitor only the Monthly VSI-CR closely. An exit signal is triggered when the VSI-CR value falls below 0.65, indicating a weakening in bullish sentiment and a potential shift in market dynamics.
Risk Management Reminder
As with any trading strategy, it's crucial to practice sound risk management. Ensure that your investment aligns with your risk tolerance and financial objectives. The Stage Dynamics Method is a powerful tool, but like all trading strategies, it is not infallible. Stay informed, stay cautious, and trade wisely. Happy trading!

Ripple - positive dynamics + news background. Accumulation for 130 days ended with a successful test of purchases, followed by an exit from the trading range on the rising volume of purchases.
This instrument has all the prerequisites to start trending upward, and the news background is supporting the positive dynamics: the SEC and Ripple Labs have filed motions for summary judgment on a possible violation of the Securities Act. Plaintiff and defendant explained that the judge had sufficient information to do so.
The company's lawyers pointed out that the Commission had run out of arguments in trying to prove that the XRP sales constituted an "investment contract." The SEC noted that it was able to confirm this.
If you like the idea, please like it. That's the best "Thank you!" for the author 😊
P.S. Always do your own analysis before a trade. Put a stop loss. Fix profits in installments. Withdraw profits in fiat and make yourself and your loved ones happy.

EURUSD FED Hike Rate Dynamics RATE HIKE EVENT: Discounted by the market
USD is on its highs so it's discounting this event.
DYNAMICS: EURUSD down on Rate Hike as a first effect on the market. Then we will see an acceleration to higher levels from 1,0590 area to 1,0690 and over 1,07.

Unpacking the Bitcoin-Gold Correlation and its Current Dynamics
The narrative of Bitcoin as "digital gold" has gained significant traction, fueled by its perceived scarcity, decentralized nature, and potential as a hedge against economic uncertainty. Recent market movements, particularly the surge in gold prices and the subsequent, albeit delayed, reaction in Bitcoin, have brought this correlation into sharp focus. While the relationship isn't always perfectly synchronized, the underlying dynamics suggest a fascinating interplay between these two assets.
Gold's recent climb to an all-time high is largely attributed to escalating geopolitical tensions, particularly the resurgence of tariff war concerns. In times of uncertainty, investors often flock to traditional safe-haven assets like gold, seeking stability and protection against inflation. This surge in gold prices has naturally sparked renewed interest in Bitcoin, which, despite its volatility, is increasingly viewed as a viable alternative store of value.
However, the correlation isn't a simple, immediate mirroring of price movements. There's often a noticeable delay, with gold leading the way and Bitcoin following suit. This lag can be attributed to several factors. Firstly, gold's established status as a safe-haven asset gives it a head start in attracting investor capital during times of crisis. Secondly, Bitcoin's relatively nascent market is more susceptible to speculation and sentiment-driven fluctuations, which can introduce delays and variations in its price response.1
Currently, Bitcoin is navigating a period of consolidation, trading within a narrow range of $82.3k to $84.5k.2 This consolidation follows a "sell-the-news" event, likely related to a major market catalyst that failed to meet overly optimistic expectations. Consequently, Bitcoin is facing significant bearish pressure, evidenced by the accumulation of short positions. The pattern breakdowns observed by analysts further reinforce this bearish sentiment, suggesting a potential retest of the $78k support level.
Despite these challenges, the renewed interest in Bitcoin, driven by gold's surge, offers a glimmer of hope for a potential rebound. The "digital gold" narrative is gaining momentum, particularly among younger investors who are more comfortable with the digital asset landscape. If Bitcoin can successfully decouple from the immediate bearish pressures and capitalize on the broader trend of safe-haven asset allocation, it could witness a significant recovery.
However, several factors could impede this recovery. The significant short positions indicate a strong bearish sentiment, which could lead to further price declines if not countered by substantial buying pressure. Moreover, Bitcoin's inherent volatility remains a significant risk factor. Sudden market events or regulatory changes could trigger sharp price swings, disrupting any potential recovery.
Looking ahead to 2025, the Bitcoin price prediction remains a subject of intense debate. While some analysts foresee a potential breakout, fueled by increasing institutional adoption and the diminishing supply of new Bitcoin, others remain cautious, citing the persistent bearish pressures and the potential for further market corrections.
The "Bitcoin Price Prediction 2025: BTC Eyes Breakout, But Sellers Still In Control" sentiment accurately reflects the current market dynamics. The long-term potential for Bitcoin remains undeniable, but the short-term outlook is clouded by uncertainty. The interplay between bullish and bearish forces will likely continue to shape Bitcoin's price trajectory in the coming months.
The correlation with gold, while not a perfect predictor, provides valuable insights into Bitcoin's potential as a safe-haven asset. As gold continues to attract investor capital amid global uncertainties, Bitcoin's appeal as "digital gold" is likely to grow. However, the delayed response and the inherent volatility of the cryptocurrency market necessitate a cautious approach.
To navigate this complex landscape, investors should closely monitor both gold and Bitcoin price movements, paying attention to key technical indicators and fundamental developments. The accumulation of short positions, the potential retest of support levels, and the broader macroeconomic environment should all be considered when making investment decisions.
In conclusion, the Bitcoin-gold correlation provides a fascinating lens through which to understand the evolving dynamics of the cryptocurrency market. While the delayed response and the inherent volatility of Bitcoin present challenges, the growing recognition of its potential as "digital gold" offers a compelling narrative for long-term growth. However, in the immediate future, Bitcoin must navigate the current bearish pressures and capitalize on the renewed interest driven by gold's surge to achieve a meaningful rebound. The battle between buyers and sellers will continue to shape Bitcoin's price trajectory, and only time will tell whether the "digital gold" narrative will ultimately prevail.

MSTR Short-term Short: Bitcoin Holdings and Market DynamicsNASDAQ:MSTR is currently approaching its all-time high of $200, presenting a potential short opportunity due to its significant divergence from COINBASE:BTCUSD performance. As of October 9, 2024, MSTR's market capitalization stands at approximately $36 billion, more than double the value of its Bitcoin holdings, which are valued at $15.64 billion based on 252,220 BTC at a price of about $62,000 per Bitcoin.
MicroStrategy's Bitcoin Strategy:
Aggressive and leveraged Bitcoin acquisition
Continuously converting profits into BTC at market rates
Long-term holding strategy
Issued convertible senior notes to fund additional Bitcoin purchases
Positioned as a leveraged Bitcoin investment
The Role of Options in Driving MSTR's Price
The options market plays a crucial role in driving MSTR's price higher than its Bitcoin holdings would suggest. Several dynamics contribute to this effect:
Gamma Squeezes: As MSTR's price approaches strike prices of outstanding call options, market makers buy more shares to hedge, creating a self-reinforcing cycle of buying pressure.
Leverage Effect: Options allow traders to control larger positions with less capital, amplifying price movements in the underlying stock.
Speculative Interest: High volatility in MSTR attracts options traders, increasing overall market activity and potentially exacerbating price swings.
Delta Hedging: Continuous adjustments by options dealers can add to price momentum.
Implied Volatility: High implied volatility leads to higher option prices, influencing trader behavior and perceptions of the stock's value.
These multivariate options market forces, combined with MSTR's unique position as a publicly traded company with significant Bitcoin holdings, have created a volatile and potentially disconnected trading environment. The current rally in MSTR's stock price, despite Bitcoin's recent correction, may be partly driven by these options dynamics. However, this situation also presents the possibility of a sharp reversal if Bitcoin fails to recover quickly or if the options-driven momentum slows.
Key Considerations for Traders:
Interplay between MSTR's core business and its Bitcoin holdings
Impact of MSTR's leveraged position on potential gains and risks
Influence of options market dynamics on stock price
Current divergence between MSTR's price and Bitcoin's movement
Potential for short-term correction if Bitcoin doesn't recover quickly
Remember: This idea is for educational purposes only. Always conduct your own research and consider your risk tolerance before making any investment decisions.

A Journey Through Halving Events, Fear & Greed DynamicsMastering Bitcoin’s Market Cycles: A Journey Through Halving Events, Fear & Greed Dynamics, and FOMO Surges
Hello everyone,
Over the years, I’ve dedicated countless hours to studying Bitcoin’s price movements across multiple timeframes, focusing on the interplay between supply and demand, greed and fear, and the ever-pivotal halving cycles. From my earliest analysis in April 2019, where I laid out the foundational trendlines and the importance of the halving setup, to the more recent explorations of Bitcoin’s FOMO Cycles, I’ve sought to decode the complex mechanisms driving this revolutionary asset.
The Foundation: April 2019 Analysis
In April 2019, I introduced a chart that I considered to be the ultimate guide for understanding Bitcoin’s long-term trendlines, grounded in historical price action, key resistance levels, and the RSI (Relative Strength Index) as a measure of market sentiment. This chart underscored the importance of major resistance levels at $6,000, $8,500, and $10,000 USD—critical zones that needed to be "eaten" before the next halving to validate the bullish thesis.
You can view the original chart below this description and also in the comment section.
. This chart successfully predicted the major price movements leading up to the 2020 halving, proving the strength of using historical resistance levels and market sentiment to forecast Bitcoin’s behavior.
At the time, I emphasized that approximately 80% of all Bitcoin had already been mined, with a significant portion of that supply likely lost forever. This supply scarcity, combined with the halving cycle reducing the inflow of new coins, set the stage for future price appreciation. My analysis hinged on the idea that supply and demand dynamics, coupled with investor psychology, drive cyclical market behavior—an idea that continues to hold true today.
Revisiting the Halving Cycles: The Key to Predicting Future Moves
Fast forward to July 2022, and I revisited the concept of Bitcoin’s halving cycles with an updated analysis that sought to replicate the forecasting success of the past. This time, I focused on how the halving cycle—where block rewards for mining are cut in half every four years—plays a crucial role in Bitcoin’s price formation. Each halving event historically leads to a significant supply shock, which, combined with increasing demand, often triggers major bull markets.
The Emergence of FOMO Cycles: Understanding Sentiment-Driven Surges
Building on these concepts, I introduced the idea of FOMO Cycles—phases within Bitcoin’s broader halving cycle characterized by explosive, fear-driven price surges. These FOMO Cycles represent the moments when Bitcoin transitions from periods of consolidation or decline into rapid growth, driven by a market-wide fear of missing out on the next big rally.
Here’s how these cycles typically unfold:
Pre-Halving Accumulation: In the months leading up to a halving, smart money begins accumulating Bitcoin, anticipating the reduced supply. This phase often goes unnoticed by the broader market but sets the groundwork for the upcoming FOMO Cycle.
Halving and Media Hype: As the halving approaches, media coverage intensifies, drawing more retail investors into the market. This increased attention marks the beginning of the FOMO Cycle, as more investors rush to buy Bitcoin before prices skyrocket.
Post-Halving Surge: Following the halving, the reduced supply, combined with increasing demand, often leads to an exponential price increase. This is the peak of the FOMO Cycle, where prices can reach new all-time highs in a relatively short period.
Correction and Consolidation: After the initial surge, the market typically experiences a correction as early investors take profits. Understanding this phase is crucial for managing risk and locking in gains before the market corrects.
Tools and Strategies for Navigating Bitcoin’s Cycles
To help you make the most of these market cycles, I’ve refined several key tools and strategies:
Fear & Greed Index: This indicator provides a real-time measure of market sentiment, helping to identify when fear or greed is dominating the market. Extreme fear often signals a buying opportunity, while extreme greed can indicate that a correction is near.
On-Chain Analysis: By analyzing on-chain metrics such as active addresses, transaction volume, and miner outflows, you can gain insights into the behavior of different market participants and anticipate potential shifts in market dynamics.
RSI Divergence: Watching for divergences between price action and the RSI can help identify moments when the market is overbought or oversold.
Historical Context and Future Implications
By looking back at the April 2019 analysis and comparing it with more recent developments, we can see how these cycles repeat over time, driven by the same underlying forces of supply and demand, amplified by investor psychology. As we approach the next halving in April 2024, understanding these patterns could provide valuable insights into Bitcoin’s future price movements.
Whether you’re a long-term investor or a short-term trader, mastering these cycles is essential for navigating Bitcoin’s volatile market. By combining technical analysis with a deep understanding of market psychology, you can position yourself to capitalize on the next big move while managing your risk effectively.
Final Thoughts and Historical Successes
Looking back at the historical context and the successes of my previous predictions, it’s clear that understanding Bitcoin’s market cycles—especially in the context of halving events and FOMO surges—can provide valuable insights for both short-term traders and long-term investors. By combining these technical insights with an awareness of macroeconomic factors, you can position yourself to capitalize on the next big move in the market.
Whether you’re a long-term investor or a short-term trader, mastering these cycles is essential for navigating Bitcoin’s volatile market. And as always, while this analysis is a powerful tool, remember to stay informed, stay patient, and enjoy the journey.
Disclaimer: This analysis is an attempt to predict future price movements based on historical data and technical indicators. It is not financial advice. Please do your own research and consult with a financial advisor before making any investment decisions.
Chachain

BITCOIN Whales Accumulate Billions as Market Dynamics ShiftBitcoin Whales Accumulate Billions as Market Dynamics Shift in 2024
In the ever-evolving landscape of cryptocurrency, 2024 has proven to be a pivotal year marked by significant shifts in market dynamics and investor behavior. As the countdown to the halving intensifies, Bitcoin whales have emerged as prominent players, accumulating billions of dollars worth of BTC amidst a backdrop of changing economic policies, institutional adoption, and speculative fervor.
The impending halving, set to occur in just eleven weeks, looms large over the cryptocurrency market. Historically, this event has acted as a catalyst for Bitcoin's price trajectory, ushering in new bull cycles. With miner rewards poised to be slashed in half, anticipation is mounting for a potential surge in demand and subsequent price appreciation.
One of the most noteworthy developments driving market sentiment is the meteoric rise of Exchange-Traded Funds (ETFs). Following regulatory approval in the United States, ETFs have captured the imagination of investors, channeling over $4 billion in new inflows within a month of their launch. This influx of institutional capital underscores growing mainstream acceptance and confidence in Bitcoin as a legitimate asset class.
Against the backdrop of easing monetary policies and declining inflation rates, investors are closely monitoring the Federal Reserve's stance on interest rates. Speculation abounds that a dovish approach could fuel liquidity and bolster risk-on assets like Bitcoin and equities. Furthermore, the upcoming 2024 US election injects an additional element of uncertainty, with the prospect of a pro-crypto administration potentially shaping market dynamics.
Institutional treasuries, particularly in regions like Asia and South America, are increasingly embracing Bitcoin as a store of value. The legitimization of cryptocurrency in corporate treasuries, coupled with the accessibility afforded by ETFs, signals a broader trend towards institutional adoption and market maturation.
A closer examination of on-chain data reveals a resurgence in whale activity, with large investors accumulating sizable positions in Bitcoin. Notably, whales holding between 1,000 and 10,000 BTC have added a staggering $12.95 billion to their portfolios in 2024. This trend contrasts with smaller whales, who have offloaded approximately $7.89 billion worth of BTC.
Technical analysis provides further insights into Bitcoin's price action, with recent trading activity indicating a bullish outlook. Despite minor fluctuations, BTC has maintained a robust position above the $51,000 level, with analysts forecasting a potential rally towards its previous all-time high of $69,004.
As whale transactions valued at $100,000 and higher reach levels unseen since 2022, it is evident that Bitcoin's recent price movements have reignited interest among market participants. This renewed enthusiasm, coupled with evolving market fundamentals, sets the stage for an intriguing chapter in the ongoing saga of Bitcoin's ascent.
In conclusion, 2024 represents a pivotal juncture for Bitcoin and the broader cryptocurrency market. As whales accumulate billions in BTC, regulatory developments, economic policies, and institutional adoption are reshaping the landscape. Amidst this backdrop of change and uncertainty, one thing remains clear: Bitcoin's journey towards mainstream acceptance and adoption continues unabated.

GBP/JPY Sees Resistance Amidst Volatile Forex Market DynamicsGBP/JPY Sees Resistance Amidst Volatile Forex Market Dynamics
The GBP/JPY pair, after its rally to a seven-week high following the Bank of Japan's (BoJ) recent policy stance, is now grappling with a challenging mix of factors.
As of the latest market data, the GBP/JPY cross is experiencing selling pressure, eroding some of the strong gains achieved the previous day. Currently trading around the 183.60 region, it represents a slight decline of less than 0.30% for the day. Technically, the price remains within a bearish channel, and it has reached a supply area where traders may anticipate a new bearish impulse.
One of the key drivers impacting the GBP/JPY cross is the market's response to verbal intervention from Japanese authorities. Concerns over possible currency market interventions have prompted some profit-taking, which has affected the GBP/JPY exchange rate.
On the other hand, the BoJ's dovish stance remains a significant factor in the forex market dynamics. The central bank has reaffirmed its commitment to maintaining an extremely accommodative policy to support the domestic economy. However, this has had a limiting effect on the JPY and provided some support to the GBP/JPY cross. The BoJ's recent adjustments to its yield curve control (YCC) policy were viewed as minor, disappointing investors who had expected a more aggressive approach to scaling back years of monetary stimulus. The BoJ also indicated that any shift away from the ultra-dovish stance would take longer than initially anticipated.
As traders cautiously navigate these dynamics, they seem inclined to wait on the sidelines ahead of the BoE's monetary policy decision, scheduled to be announced on Thursday. The outcome of this meeting could provide further insights into the GBP/JPY pair's direction in the coming days.
Our preference
The downside prevails as long as 185.50 is resistance.

CHFAUD, This Major Formation to ALTER the Current Trend-Dynamic!Hello There!
Welcome to my newest idea about CHFAUD. In my recent analysis, conduction, and chart price-action I have detected important underlying trend dynamics and price action dynamics that are likely to alter the whole CHFAUD price action and trend that is currently ongoing. Currently, it is highly necessary conduction to consider if the CHFAUD current trend dynamics are going to hold on or if a massive reversal is going to convert the whole price action into a different market.
Within my analysis chart, I am considering the massive ascending triangle formation CHFAUD is likely to complete within the next times as it is going to approach this massive supply zone between the 1.8 and 1.87 level from where it already pulled back several times in the past increasing the possibility for a major pullback into the other trend direction.
Especially, within this whole price-action the most important parts are the 25-EMA, the 50-EMA, and the ascending trend line which hold the current trend, and if they are broken towards the other trend direction it is going to indicate the massive trend reversal and is going to activate the next continuations till either the bearish momentum is going to accelerate so heavily below the supports or a potential for a reversal within the supports is indicated.
When considering the whole dynamic here the major ascending triangle formation forming here is a formation that is indicating a reversal in almost all of the cases. The most important conduction once it has been completed will be on how the price action approaches the target zones because it is going to complete a much larger wave count from A to E with the finalization of the wave E. A bounce in this area is going to confirm a potential reversal otherwise a continuation is going to accelerate the bearishness to even further target zones.
In this manner, thank you everybody for watching my analysis of CHFAUD. Support from your side is greatly appreciated.
VP

Market DynamicsMINA cryptocurrency demonstrates a consistent adherence to established trading patterns, firmly maintaining its position within the support range of $0.54-$0.58. Given the prevailing market dynamics, a cautious approach should be adopted when contemplating conservative long positions, accompanied by the implementation of precise stop loss strategies to mitigate potential risks effectively. It is expected that further consolidation will likely transpire in close proximity to the aforementioned support level, potentially heralding significant market movements in the near future. Furthermore, it is crucial to acknowledge the existence of an additional support level at $0.43-$0.45, which possesses the capacity to exert further influence on the prevailing price dynamics.
In assessing the technical indicators, the Relative Strength Index (RSI) presently registers at 42. This reading suggests a state of neutrality, indicative of neither oversold nor overbought conditions within the cryptocurrency. Consequently, it points towards a balanced market sentiment that aligns harmoniously with the ongoing consolidation phase adjacent to the support level.
Additionally, the Moving Average Convergence Divergence (MACD) indicator exhibits a value of -0.003. The negative value signifies a bearish inclination in the short term, hinting at a potential deceleration in the upward momentum. However, it is essential to exercise prudence when interpreting this reading, considering the broader market conditions and the consolidation phase unfolding near the support level.
By amalgamating the comprehensive analysis of MINA's consistent trading patterns, the anticipated consolidation phase, the existence of an additional support level, and the insights derived from the RSI and MACD indicators, a more informed and professional approach can be undertaken. This approach entails cautious considerations for conservative long positions, meticulous implementation of stop loss strategies, and a careful assessment of multiple factors to navigate the evolving market dynamics effectively.

DASHUSD Target Price 198.59DASHUSD Dynamic Support Resistance and Static Support Resistance Levels
EMA 10 Level
Support Resistance Level
Fibonacci Level
EMA 20 Level

GOLD SPOT (daily time frame) - ShortFOREXCOM:XAUUSD
There has been a strong support level since April 17, after the breakout that occurred on April 13.
Also in the meantime, we can see a near resistance/ support level
I confirmed these strong and near level by circling each testing that occurred on the level
Also EMA 10 & 20 period tends to become the dynamic resistance
Also have same view on 4hr timeframe, check it below
After the turn around on the near support, the market went bullish till the near resistance. And from there, we can see a fake bullish breakout there which i alighted with rectangle , and afterward, the market movement turn downward, towards the near support level ... c
Conclusively, I am having a sell signal on XAUUSD
Trade Setup
Call Type: Short (Sell)
Entry: 1810.00
T.p: 1750.00 (on the near-support)
S.l: 1825.00 (just above the near-resistance)
profit in pips: 60 pips
loss in pips: 15 pips
Risk-reward-ratio: 1:4
Like and drop your thoughts as comment if you agree with me, or otherwise.. lets trade and win together
Please, follow me..i will follow back as well

EURGBP Target Price 0.87308EURGBP Exponential Moving Average Period 10 Price, Exponential Moving Average Period 20 Price, Open Price, Close Price, High Price, Low Price
Trend: Up Trend
Level: Horizontal Support Resistance, Dynamic Support Resistance
Signal: Pin Bar
Open Price and Close Price is between the area of EMA 10 and EMA 20.
EMA 10 is above EMA 20. Both EMA point up.

EURNZD 4.93R Trade | Pin Bar | Exponential Moving AverageEURNZD Reward Risk Ratio 4.93R. Pin Bar + Dynamic Support Resistance aka Exponential Moving Average + Horizontal Support Resistance + Double Bottom Pattern = Confluence For A High Probability Bull Trade Set Up

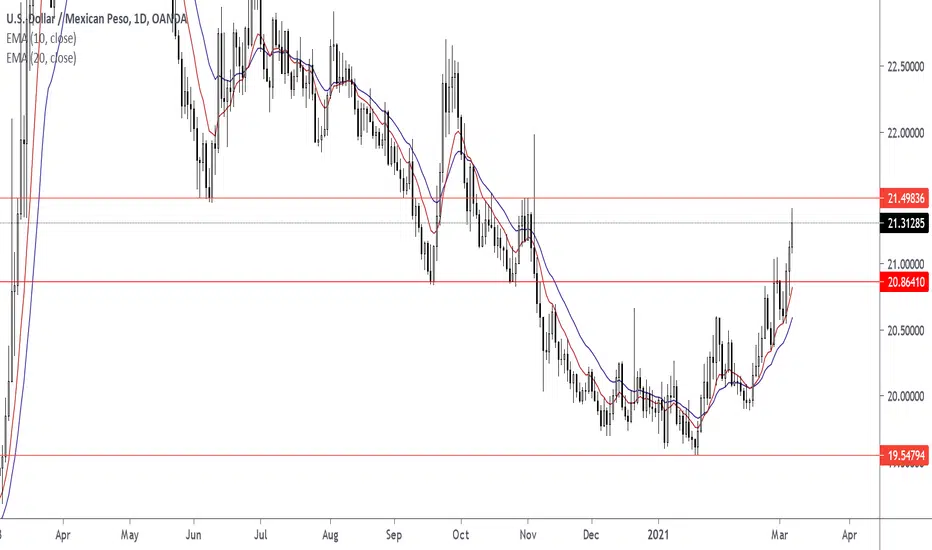
USDMXN Target Price 21.49836 (Entry Price 20.86410)Wait for a pull back to horizontal support resistance level and dynamic support resistance level for an entry.
AAPL 4h highly probable to be bullishAAPL in Nasdaq is going to be bullish due to bullish signs in volume - RSI - ADX - MACD and other classic indicators so we just need a confirmation from crossing the dynamic resistance from the trend

EURUSD LONGFX:EURUSD BULLISH - DAILY TIME FRAME
Below are my reasons for setting EUR/USD on a long trade
1. FROM THE INDICATOR+CHART ANALYSIS, I CAN
SEE A BULLISH DIVERGENCE THERE, WHICH IS
POINTING TO BULLISH RUN FROM EUR/USD SOON
2. DYNAMIC SUPPORT AND RESISTANCE (EMAs)
WE CAN SEE THE 10-PERIOD (BLACK COLOR)
BECOMING DYNAMIC SUPPORT, AND ALSO THE
PRICE IS MOVING CLOSER TO 20-PERIOD (BLUE COLOR)
WHICH WILL TURN THE 20-PERIOD INTO DYNAMIC
SUPPORT AS WELL WHICH ALL MEANS UPTREND
TRADE SETUP
TRADE TYPE: SWING TRADE
CALL: LONG
ENTRY: STILL GOOD TO ENTER NOW
T.P: 1.19430 (NEAR-RESISTANCE)
S.P: 1.17520
PIPS IN T.PROFIT: 1360 PIPS (FROM 1.18070 AS ENTRY PRICE)
PIPS IN S.LOSS: 550 PIPS (FROM 1.18070 AS ENTRY PRICE)
RISK-REWARD-RATIO: 1:2.5
Drop your thoughts on this, if you think as i do, or otherwise... Let's trade and win together.
And don't forget to follow me, i will follow back as well.

EURUSD LONG EURUSD BULLISH - DAILY TIMEFRAME
Below are my reasons for setting EURUSD on a long trade
1. FROM THE INDICATOR+CHART ANALYSIS, I CAN
SEE A BULLISH DIVERGENCE THERE, WHICH IS
POINTING TO BULLISH RUN FROM EURUSD SOON
2. DYNAMIC SUPPORT AND RESISTANCE (EMAs)
WE CAN SEE THE 10-PERIOD (BLACK COLOUR)
BECOMING DYNAMIC SUPPORT, AND ALSO THE
PRICE IS MOVING CLOSER TO 20-PERIOD (BLUE COLOUR)
WHICH WILL TURN THE 20-PERIOD INTO DYNAMIC
SUPPORT AS WELL WHICH ALL MEANS UPTREND
TRADE SETUP
TRADE TYPE: SWING TRADE
CALL: LONG
ENTRY: STILL GOOD TO ENTER NOW
T.P: 1.19430 (NEAR-RESISTANCE)
S.P: 1.17520
PIPS IN T.PROFIT: 1360 PIPS (FROM 1.18070 AS ENTRY PRICE)
PIPS IN S.LOSS: 550 PIPS (FROM 1.18070 AS ENTRY PRICE)
RISK-REWARD-RATIO: 1:2.5

Possible support and resistance levels of Bitcoin! With the current speculation of bitcoin's next move i cannot help myself from sketching as many trendlines and support levels as possible to come to a conclusion of bitcoins next move.
From this post you can see some levels that i consider to be key levels for BTC to conquer nor break within the coming days.
However there is much move than just the common trend lines and R/S levels to address, we must also address dynamic trend lines and other technical indicators aswell!
Most dynamic trend line indicators such as Mean reversion, Bollinger bands were acting as support levels due to Bitcoins most recent drop.
However a key level I saw was the 200 moving average, which was acting as a resistance level just above current day highs.
Although this isn't technically a dynamic trend line i noticed a trend line on the RSI showing that there is room for a run prior to meeting RSI resistance.
From other technical indicators like linear regression and Fibonacci retracement also showed some interesting S/R levels.
Linear regression showed an interesting level 2 standard deviations below the mean.
Fibonacci retracement shows other support levels for bitcoin.
Overall the conclusion I came to is that from a restricted view due to only addressing support and resistance levels the future direction of bitcoin is inconclusive.
To come to a better conclusion i would suggest looking into fundamental points such as inflation, whale's trades and market sentiment.
However in saying that I would not disregard these levels as they can show traders the strength of BTC price action aswell as potential entry/exit points.

BTC Short Trade|Rising Wedge|Resistance Confluence|Price ActionEvening Traders,
Today’s Analysis – BTCUSD – a short trade is valid at major resistance confluence
Points to consider,
- Dynamic resistances converging
- .618 Fibonacci objective ( bearish resistance of dynamic resistance)
- Price Action in a Rising Wedge pattern
- Stochastics divergence
- Bull impulses (No follow through)
The .618 Fibonacci is the objective for this trade; price is likely to wick there for a liquidity grab as this is a clear trade location on the chart with key dynamic resistance confluence.
Price Action is currently trading in a rising wedge which has a greater probability of breaking down.
The stochastics has a valid bearish divergence, which has technically played out; this shows weakness in the market.
Furthermore all bull impulses have been sold into, another impulse above local resistance is likely to be a wick into the .618 Fibonacci area.
Overall, in my opinion, a short trade is valid at the .618 Fibonacci. The immediate trend is bearish; any rallies are to be sold into until the recent high is taken out at around $9796.5
What are your thoughts?
Thank you for following my work!
And remember,
“If you don’t respect risk, eventually they’ll carry you out.” – Larry Hite
