Bank of America (BAC) Stock: Breaking Out, Fibonacci DynamicsAnalyzing BAC Stock: Navigating Breakouts and Fibonacci Dynamics
Introduction:
Bank of America Corporation (BAC) has seized investor attention with its recent breakout from a falling wedge pattern on October 27, 2023. As we delve into the details, this analysis aims to provide insights into the stock's recent performance and chart the potential trajectory based on technical indicators.
Breakout from Falling Wedge:
The breakout from the falling wedge pattern marked a significant turning point for BAC stock on October 27, 2023. This event initiated a gradual yet dominant push, propelling the stock towards the 0.5 Fibonacci retracement level from the bottom wick of the lowest candle in the 9-hour timeframe.
Fibonacci Retracement Analysis:
In the weekly chart analysis, BAC is yet to approach the 0.618 Fibonacci retracement zone. This critical zone is anticipated to be a pivotal level, potentially triggering a significant correction towards the falling wedge resistance around $28.90. The Fibonacci dynamics serve as a roadmap, guiding traders through the intricacies of BAC's price movements.
Short-Term Bearish Outlook:
For the short term, a bearish stance is maintained as we anticipate the completion of a double top pattern. This pattern suggests a potential reversal, aligning with our analysis of the Fibonacci retracement zones. The completion of the double top pattern is considered a crucial phase before the stock advances further, adding a layer of caution to our near-term outlook.
Conclusion:
In conclusion, Bank of America Corporation's recent breakout from the falling wedge pattern has set the stage for an intriguing journey. The Fibonacci retracement analysis reveals key levels, with the 0.618 zone acting as a potential catalyst for a significant correction. As we remain short-term bearish, the completion of the double top pattern becomes a pivotal event, shaping the narrative for BAC stock's future movements. Traders are advised to stay vigilant, closely monitoring these technical indicators to navigate the dynamic landscape of Bank of America Corporation's stock performance.
Search in ideas for "Dynamic"

Bitcoin's Price Could be Boosted by Supply Dynamics in 2024Bitcoin's price could be boosted by supply dynamics in 2024, Grayscale says.
Key Takeaway
1. Potential spot bitcoin ETF approvals next year could coincide with reduced liquid supply, positively impacting the valuation of BTC, according to a report.
Bitcoin BTC supply dynamics may result in a reduced liquid supply early next year, coinciding with the potential approval of spot bitcoin ETF filings, Grayscale Investments said Friday in a research report, adding that the dynamic could have a positive impact on the valuation of the digital asset.
"Bitcoin’s supply is relatively tight ahead of potential investor inflows into spot ETF products in the U.S.," Grayscale said, noting that a significant portion of bitcoin is held by entities that may be slow to sell into an appreciated market. The asset manager is one of more than a dozen firms currently seeking approval for a spot bitcoin product from the Securities and Exchange Commission.
However, Grayscale said that there are conditions that could counter the thesis that positive price appreciation for bitcoin in 2024 is assured. These include a possible "hard landing" for the U.S. economy next year. The report said that such an outcome could see "a resumption of Fed rate increases or fewer-than-expected Fed rate cuts, and, or a long delay in regulatory approval of a spot bitcoin ETF for the U.S. market."
These risk could significantly hold back the ongoing crypto recovery, at least over the near-term, Grayscale said.
The largest digital asset by market capitalization was changing hands for $38,580 at 11:50 p.m. ET, up almost 3% in the past 24 hours,
The report also said that next year’s bitcoin halving could also limit the growth of new BTC supply. "This combination of inelastic bitcoin supply and potential new investor inflows should be positive for valuations, in our view," Grayscale said.

BTC - LEVELS TO TAKE IN TO ACCOUNT IN THE UNEXPLORED TERRITORYLONGER TERM INDICATORS SIGNAL THE BULL RUN IS FAR FROM BEING COMPLETED.
SHORTER TERM INDICATORS SHOW SOME EXHAUSTION OF BUYERS. LETS SEE WHAT THEY ARE AND WHAT ARE THE PRICES AND THE IMPLICATION ON ALTCOINS ON EACH SCENARIOS
What a rally. Amazing. What to do now? We are in a new level f price, no past data to rely on. Actually we have some, namely the ones from the 2017 bull run! Of course the prices are not comparables, but the dynamics can be. With a nonstop rally from 10k (or 20k) to 40k, someone sooner or later will start lock in profits. Even the hardest holder have a stop loss (or mental stop loss) at which he will sell his BTC to reenter at a cheap price. 38,500 can be that price. below 38.5k we can see a snowfall effect caused by many SL placed there.
This is the distance of the price from the 200MA. The green boxes indicate the bull run. We clearly see that a relief in the rally is needed now.
Monthly RSI need to breath also (in green the Bull runs).
No doubt this run we witnessed was just a preliminary bite of what we will see. What are the levels to reenter?
36,000 (-12% from the ATH) - the first one is 36k as it is the 200hourly MA. The 200MA holding the price is the minimum requirement for the trend to resume. If the price will stop here, we will be lucky :)
30,000 (-30% from the top) - it coincides with the 21 MA (level 1 in the chart) which is used in the Bull run many times as support
23, 700 (-45% from the top) - deeper dips in a bull run touch the 50MA as well.
Dynamics can repeat themself but I honestly think that this time something is changed with respect to 2017. Mainly, institutional investors, not simple whales entering the market draining the supply. I believe that 30k will be an optimistic target and I would be satisfied in rebuy back there. 36,000 is the most likely.
Please note that those levels are all DYNAMIC, therefore they may change if the price will lateralize for few days.
ALTCOINS? I will post another update on Alt only, but in Bull run they behave differently than usual. They fall (in btc terms) when btc goes up (of course, as it is the king) and rise even if btc is going down (contrarily to what we are used to see) as the market takes for granted that the bull run will resume anyway.

Bitcoin with dynamic cycle oscillatorCOINBASE:BTCUSD weekly chart with dynamic cycle oscillator.
Indicator suggests a shift in cycle from down to up phase since late April. Those with bullish views on BTC can position themselves to go long using lower timeframes.
A brief description of the cycle oscillator:
1. The relative position within the cycle is derived from stochastic concepts.
2. Cycle period is calculated dynamically using autocorrelation (the relationship of a variable with lagged values of itself) Incidently, setting a long lookback period gives very similar results.

XAU/USD Step-by-Step Trading Roadmap: A Dynamic Story
The market opens, and you’re armed with your tools: the 30-minute chart as your primary guide, with the 5-minute for precision entries, the 1-hour and 4-hour for context, and the daily for trend bias. The plan is to adapt as the story unfolds, responding dynamically to price movements, indicators, and market conditions.
Act 1: Opening Context and Initial Assessment
Morning Check (Pre-Market):
Daily Trend:
If uptrending, focus on long trades at pullbacks (VWAP lower deviation or Fibonacci retracements).
If downtrending, target short trades at resistance (VWAP upper deviation or Kumo rejection).
If consolidating, prepare for range-bound trades.
Key Levels:
Identify support ($2,618, $2,622) and resistance ($2,628, $2,635).
Volume and Momentum:
Note RVOL (Relative Volume) and RSI. Spikes signal active institutional participation.
Act 2: The Setup
The price approaches $2,624, a critical level. Now, the story splits into multiple paths:
Path 1: Normal Long Trade
Scenario: Price pulls back to $2,620 (VWAP lower deviation).
Action:
Entry: Long $2,620.
SL: $2,616 (ATR-based or below recent swing low).
TP1: $2,624 (VWAP median).
TP2: $2,628 (Fibonacci extension).
TP3: $2,635 (Daily resistance).
TSL: Once $2,624 is hit, trail SL to $2,622.
What-If Scenarios:
Price moves up and hits TP1: Scale out 50%, adjust TSL to $2,622.
Price reverses: Exit remaining at TSL ($2,622).
Price consolidates at $2,624: Monitor 5-minute chart for continuation signals (momentum candles, rising RSI).
Path 2: Momentum Trade
Scenario: Price breaks above $2,624 with strong momentum (RVOL > 1.5, bullish Ichimoku TK cross).
Action:
Entry: Buy Stop $2,626.
SL: $2,622.
TP1: $2,630.
TP2: $2,635.
TP3: $2,640 (Daily high).
TSL: Trail SL to $2,628 once $2,630 is breached.
What-If Scenarios:
Price hits TP1 and slows: Reduce 50% position size, adjust TSL to $2,628.
Price continues to TP2/TP3: Let TSL manage profit locking.
Price reverses below $2,628: Exit fully and reassess for a potential short.
Act 3: The Reaction
The market tests $2,628, the resistance level.
Path 3: Reversal Setup
Scenario: Price fails to break $2,628 and forms a Shooting Star (bearish reversal candlestick) with RSI divergence.
Action:
Entry: Short $2,628.
SL: $2,631.
TP1: $2,624.
TP2: $2,622.
TP3: $2,618 (VWAP lower deviation).
TSL: Trail SL to $2,624 after TP1 is hit.
What-If Scenarios:
Price reverses and breaks $2,628: Stop out and flip to a long trade.
Price moves to TP1 and stalls: Reduce position size, tighten TSL.
Price accelerates to TP2/TP3: Let trailing stop lock in profits.
Act 4: Scaling and Stalling
The market stalls near $2,624 during the London-NYC session overlap.
Path 4: Scaling In and Out
Scenario: Price consolidates at $2,624 with low RVOL but shows higher lows on the 5-minute chart.
Action:
Scale In:
Add positions if bullish signals emerge (e.g., higher lows, TK cross).
Monitor SL placement; keep it tight ($2,622).
Scale Out:
Take partial profits at $2,628, $2,630.
Let the remaining position ride to $2,635 if momentum continues.
What-If Scenarios:
Price breaks down below $2,622: Exit fully and reassess for short opportunities.
Momentum increases: Continue scaling out at Fibonacci levels.
Act 5: Breakouts and Volume Surges
The price approaches $2,635, a major resistance level.
Path 5: Volume Breakout
Scenario: Price surges above $2,635 with RVOL > 2.0.
Action:
Entry: Buy Stop $2,636.
SL: $2,631.
TP1: $2,640.
TP2: $2,645 (Fibonacci extension).
TP3: $2,650.
TSL: Move SL to $2,635 after $2,640 is breached.
What-If Scenarios:
Price fails at $2,640: Exit partially at TSL.
Price reverses sharply: Flip to short below $2,635.
Act 6: Ending Scenarios
Scenario 1: Market Consolidates
Action:
Stay sidelined if no clear signals align across Ichimoku, VWAP, and FVG.
Scenario 2: Price Collapses
Action:
Use mean reversion strategies:
Short breakdowns below $2,618.
Long at oversold conditions near $2,610 with tight SL.
Key Decision Points Summary
Level Action SL TP1 TP2 TP3 TSL Strategy
$2,618 Long (support pullback) $2,616 $2,622 $2,624 $2,628 Trail SL to $2,620 after TP1 is hit.
$2,624 Long (momentum breakout) $2,622 $2,628 $2,630 $2,635 Trail SL to $2,628 after TP1 is hit.
$2,628 Short (reversal setup) $2,631 $2,624 $2,622 $2,618 Trail SL to $2,624 after TP1 is hit.
$2,635 Long (volume breakout) $2,631 $2,640 $2,645 $2,650 Trail SL to $2,635 after TP1 is hit.
Conclusion
By following this dynamic roadmap, you’re prepared to react to XAU/USD price movements in real-time, with setups that adapt to market conditions, session-specific opportunities, and evolving momentum. Let the market tell its story—and respond with precision.

🅱️ Bitcoin vs Altcoins Dynamics... Remember This?➖ Bitcoin goes up, the Altcoins crash!
➖ Bitcoin goes down, the Altcoins crash!
➖ Bitcoin goes sideways and the Altcoins are crashing...
Remember this dynamic? This is not the way it is today.
➖ When Bitcoin goes high up, the Altcoins also grow.
➖ When Bitcoin is ultra-bullish and consolidates, the Altcoins grow.
➖ When Bitcoin retraces after a major bullish wave, the Altcoins grow.
👉 When Bitcoin enters a major correction, initially everything crashes, but right after everything recovers and continue growing strong long-term.
👉 This where we are at now; This is how the market will behave in 2024 and 2025, so prepare.
Namaste.

BOIL- Go Long SetupBOIL has had a busy month with the resurgence of natural gas prices and the reverse
split six trading days ago. I analyze it as having further upside. On the 30-minute chart
I have added two anchored VWAPs to the left on separate pivot points. This serves
to make out dynamic support and resistance. Price has crossed over the mean VWAP zone
which is between the heavy black lines. In confluence with that, it has crossed over the
POC line of the volume profile represents the price point with the highest total trading volume
over the visible time interval. Above price are the two targets being one and two standard
deviations above the mean aVWAP. The volume indicator shows increasing relative volume
overall as a sign of accumulation which generally results in price appreciation from
the demand trend. I will set the stop loss at $.10 below the POC line and take a long
position. One third of the position will come off upon each target advancing the stop loss to
above the entry and making the trade risk-free. Another third with TP2 and finally the
The remaining third will run on a trailing stop so I do not spend time micromanaging a smaller
position. I believe that my overall bullish bias will be rewarded yet again over the near term.

Bitcoin Fighting Point Of ControlWhen analyzing Bitcoin, we can see that we had a nice move up from the lows. After this move up, we can see on the chart that it's struggling to get past the Point Of Control. Usually when the price gets rejected from the point of control, it tends to find the Value Area Low of the range before continuing its move up of finding new lows. Since bitcoin did break out of its descending triangle, I would expect to see the price continue to move higher and test the Value Area High (Blueline above POC) before a possible retracement to either retest the Value Area Low or dynamic resistance that we just broke out of.
Every day the charts provide new information. You have to adjust or get REKT.
Love it or hate it, hit that thumbs up and share your thoughts below!
Don't trade with what you're not willing to lose. Calculate Your Risk/Reward!
This is not financial advice. This is for educational purposes only.

NEO PRICE PREDICTION 2022 💎 NEXT TARGETSNEO is under a huge dynamic resistance. But soon it will open doors for long term holders buy round $5-$10 and hold for $100-$120.
NEO has shown that its accumulation period range from 600-900 days and after that you will be rewarded 800-900% profit.
The chart showing both short and long position trade carefully.

Buy Some New Shorts Pt. 2
Simple analysis here. The VIX is closing in on strong dynamic and static support.
Buy volatility, sell/short high-risk assets (1-6 month timeframe).
No change in my intermediate and long-term thesis. Still early innings of a bear market. Market conditions are steadily worsening.
Looking for a move in VIX to the static resistance level of 35.8 in the coming months.
Good luck! This is not financial advice.

A correction or a reversal?? AUDUSD give us a chance!No matter it's a correction or a reversal!
Most dynamic levels are broken but the strong SMA200 is still valid! I think what ever happen in future there is a good probabilities for a wining long trade!

USD/JPY Attracts More Buyers!Technically, the USD/JPY pair is positive as long as it remains above the R1 (138.20). Upside barriers are represented by R2 (138.90) and 139.07.
Additionally, the uptrend line functions as dynamic support; only a new lower low and a legitimate breakdown below this line might render the upward scenario incorrect and herald a bearish reversal.

BTC is at confluence point of four resistances !BTC is going to fight with 4 resistances simultaneously ! Is it able to win the battle? Lets follow.
As shown on the chart, resistances are :
1. Major down trend line
2. 100 days moving average
3. Minor static resistance
4. minor dynamic resistance
Order of numbers shows importance of resistances with 1 being the most and 4 the least.
Do you think BTC can break out all these resistances? We have to be open minded but I think it needs a very strong trigger (if it can find any) to be able to survive this battle.
Good luck everybody

$AMPH is building a nice pivot area!Notes:
* Strong up trend since late 2021
* Great earnings track record
* Building a base for the past ~4 months
* Building a pivot area around $37.8 for the past three weeks
* Bounced off of the 50 day line with higher than average volume
* Has been using the 50 day line as a dynamic level of support for the past month or so
Technicals:
Sector: Healthcare - Drug Manufacturers - Specialty & Generic
Relative Strength vs. Sector: 3.28
Relative Strength vs. SP500: 7.72
U/D Ratio: 1.5
Base Depth: 49.24%
Distance from breakout buy point: -17.32%
Volume 20.79% above its 15 day avg.
Trade Idea:
* You can enter now as the price is just bouncing off of its 50 day line
* If you want a better entry you can look for one around the $36 area as that seems to be acting as a pivot also
* If you want a safer entry you should wait for a clear break and hold above the $37.8 resistance area
* This stock usually has local tops when the price closes around 23.22% above its 50 EMA
* Consider selling into strength if the price closes 23.02% to 23.42% (or higher) above its 50 EMA
* The last closing price is 3.03% away from its 50 EMA

Is $PAG recovering from its pull back?Notes:
* Strong up trend on all time frames
* Great earnings track record
* Pays out dividends
* Coming up on the right side of its base
* Basing for the past ~9 months and creating a base within a base
* Just breaking above the ~112 (historical resistance weekly chart) area with higher than average volume and bullish price action
* In the Automotive industry which is pretty hot right now
* Using the 50 day line as a dynamic level of support for the past several sessions and now bouncing off with higher than average volume
Technicals:
Sector: Consumer Cyclical - Auto & Truck Dealerships
Relative Strength vs. Sector: 2.12
Relative Strength vs. SP500: 2.92
U/D Ratio: 1.02
Base Depth: 20.61%
Distance from breakout buy point: -8.45%
Volume 38.61% above its 15 day avg.
Trade Idea:
* You can enter now as the price is just bouncing off of its 50 day line with higher than average volume
* If you're looking for a better entry you can look for one around the ~110.5 area
* This stock usually has local tops when the price closes around 12.3% above its 50 EMA
* Consider selling into strength if the price closes 12.1% to 12.5% (or higher) above its 50 EMA
* The last closing price is 5.63% away from its 50 EMA

Double Resistance Challenge!BTC Needs to close above 23k and confirm the S/R flip, then it'll MOST LIKELY pump to the 26.8k area. It broke a few resistance but it's currently at a dynamic and horizontal resistance rn. Stay patient or enter with a tight stop for a breakout trade.
Every day the charts provide new information. You have to adjust or get REKT.
Love it or hate it, hit that thumbs up and share your thoughts below!
Don't trade with what you're not willing to lose. Safe Trading, Calculate Your Risk/Reward & Collect!
This is not financial advice. This is for educational purposes only.

Bitcoin Pump Signal 🚦I was looking at USDT dominance (1D time-frame), and just found interesting signals 🌞
1. USDT.D has broken the green bullish trend-line and now is on a bearish move.
2. It is being rejected after it has reached the red trend-line as a dynamic resistance area .
3. The static resistance above is a strong long-term resistance area that is rejecting the USDT.D
What I personally conclude from these 3 signals, is that there is a high possibility that USDT.D will start a strong down-trend. And as the Bitcoin is on a strong support area as well, it can help the Bitcoin PUMP!
Feel free to let me know about your ideas or any questions you got in comment section.

Reliance can be short for short Termafter making consecutive bullish upmove without any correction or pull back, Reliance has started to correct, the pullback may end taking support of Fibonacci Retracements or can take support on 5 EMA or 20 or any other EMA.try to observe this script for better understanding of price corrections , pullbacks and to learn Dynamic support and Resistances.
Disclaimer: Everything i post is for observation and Learning only, i am not a SEBI registered Analyst, consult your Financial Advisor Before Taking Position.

$SBLK ready to move higher?* Good earnings in the recent quarters
* Strong up trend in the recent years
* Sector: Industrials - Marine Shipping
* Relative Strength vs. Sector: 66.27
* Relative Strength vs. SP500: 15.88
* U/D Ratio: 1.21
* Distance from breakout buy point: 0.44%
* Volume 48.37% above its 15 day avg.
* Broke out of an ascending triangle and move ~32% higher from there before consolidating
* Yesterdays candle shows tonnes of demand along the 10/20EMAs
* Has been using it's 10EMA as a dynamic level of support
* Broke resistance of $29.87 with higher than average volume
Trade Idea:
* You can enter now as the price just broke out once again with higher than average volume
* Setting a 10% target seems achievable as it's just above a historical level ($32.32)
* Manage risk accordingly as shipping stocks have been hard to trade recently.

ETH symmetrical triangleHello, our very first ETH analysis.
Analysis
Under Strong dynamic resistance from ATH
Under strong Structure resistance
Symmetrical Triangle in progress
Actions
Let's wait for the squeeze
Wherever it broke we took the trade.
Most chances are a bearish broke with a 6-7% profit.

EURGBP Retesting The Daily Falling WedgeEURGBP successfully break the falling wedge on daily time frame, price is retesting the pattern right now, on Fibonacci Internal Retracement 0.618
Price target is the cluster area of Fibonacci External 1.272 and EMA 200 (the green dynamic line)
FX:EURGBP
-Fibomic International-

MATIC/USDT : Both side have the profit for your portfolio ! BINANCE:MATICUSDT
Hello everyone 😃
Before we start to discuss, I would be glad if you share your opinion on this post's comment section and hit the like button if you enjoyed it !
#MATIC is moving in a flat-top triangle, In other word; It has formed a bullish triangle and now the movement is approaching the edge of the pattern.
There will be scenario to play and both have separate profit on the movement, So we'll try to catch the majority and take the advantage into break out/down confirmations...
- Breakout above $2.700 with potential 60% LONG's profit on it :
In any terms of breakout above the higher resistance zone ; It'll confirm the bullish bias into the major movement and we can take a LONG on the breakout confirmation and set our SL as a candle close below our entry zone !
- Breakdown below $2.050 with potential 30% SHORT's profit on it :
In any terms of breakdown below the dynamic support zone ; It'll confirm the bearish bias into the major movement and we can take a SHORT on the breakdown confirmation and set our SL as a candle close above our entry zone !
📚 The meaning of the entry zone is the mentioned blue/red area of interest !
Hope you enjoyed the content I created, You can support us with your likes and comments !
Attention: this isn't financial advice we are just trying to help people on their own vision.
Have a good day!
@Helical_Trades

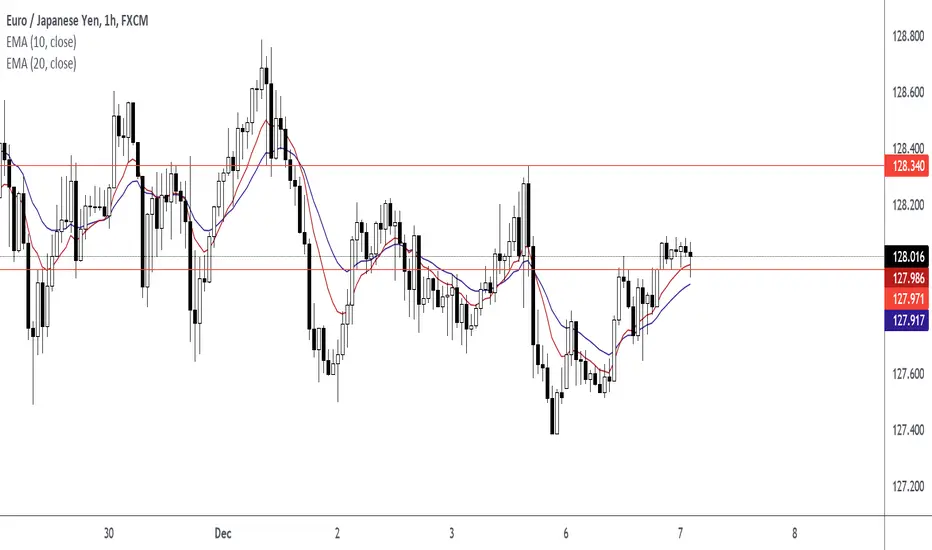
Entry At Dynamic Support and Horizontal Support Close Above 127.971
Retest At 127.971
Entry At 128.016
Exit At Previous Swing High