USD/CAD - Harmonic Patterns and Momentum IndicatorsTechnical Analysis of USD/CAD - Harmonic Patterns and Momentum Indicators
Overview:
The USD/CAD chart illustrates price action on the hourly timeframe, incorporating harmonic patterns, Fibonacci retracements, and momentum indicators to identify potential reversal and continuation points. The presence of a Crab harmonic pattern suggests a critical turning point, while momentum oscillators provide additional confirmation.
**Harmonic Pattern Analysis:**
1. A **Crab harmonic pattern** is evident, with the price reaching the terminal point at approximately **1.44627**.
2. The **XA and BC Fibonacci extensions** align with key retracement levels, reinforcing the likelihood of a reversal at this zone.
3. The price has **rejected the high point**, indicating potential exhaustion of bullish momentum.
**Support and Resistance Levels:**
- **HOP (Harmonic Optimal Point):** **1.44627** - The potential completion zone of the Crab pattern.
- **XA Retracement:** **1.43968** - A key structural support level.
- **BC Level:** **1.43721** - A secondary support level for price continuation.
- **T2 (Target 2):** **1.42596** - A potential downside target if bearish momentum continues.
**Momentum Indicators:**
- **Stochastic RSI & Relative Strength Index (RSI):**
- The **Stochastic RSI** shows a recent overbought condition, followed by a decline, indicating potential bearish momentum.
- The **RSI also exhibits bearish divergence**, where price made a higher high while RSI formed a lower high, suggesting weakening bullish strength.
**Market Sentiment & Potential Trade Opportunities:**
- Given the rejection at **1.44627**, a **short position** could be considered if confirmation of further downside emerges.
- A break below **1.43968** could reinforce the bearish bias, with **1.42596** as a potential target.
- However, if the price finds support and rebounds, a bullish continuation could be anticipated, requiring further validation.
**Conclusion:**
The **Crab harmonic pattern, overbought momentum indicators, and Fibonacci confluence suggest a possible bearish reversal**. Traders should monitor **key support levels and momentum shifts** to determine whether the bearish scenario plays out or if buyers regain control. Risk management and confirmation signals are crucial before entering a trade.
Search in ideas for "INDICATORS"

Best TradingView Indicators to Level Up Trading in 202513 best tradingview indicators to level up trading in 2025.
Momentum Radar best TradingView indicators are suitable for both beginners and advanced traders, providing insights that can help refine trading strategies and optimize market entries and exits.
Momentum Radar Indicator: This one’s been a game-changer for me. It’s super intuitive and focuses on trend-based setups. It’s been backtested on crypto and stocks, and it gives you clear BUY and SELL signals based on major resistance and support levels. Perfect for spotting breakouts!
Momentum Wave Indicator: If you’re into longer timeframes, this is a must-have. It’s designed to help you understand market structure and momentum over the long haul. Not the best for range trading, but it’s amazing for spotting strong trends.
Divergences PRO: This one’s all about finding those moments when the market might be ready to reverse. It’s great for spotting divergences and can be used in both trending and ranging markets. I use it as a confirmation tool alongside other indicators.
Institutional Algo: Ever wonder where the big players are positioning themselves? This ALGO gives you insights into institutional supply and demand zones. It’s packed with features like volume filters and trend tracers, making it a solid choice for spotting high-probability setups.
MoM Algo V15: This is one of the most customizable indicators I’ve used. It works on all timeframes and assets, and it even lets you tweak sensitivity and risk-to-reward settings. Plus, it has automatic TP and SL, which is a huge time-saver.
Momentum ALL-IN-ONE: As the name suggests, this one does it all. It combines volume, volatility, and trend analysis into one powerful tool. It’s been backtested for accuracy, and it’s super flexible with different volume oscillator modes.
Momentum Balance Finder: This one’s a bit unique—it helps you find hidden support and resistance levels. It takes some experimenting to get the hang of, but once you do, it’s incredibly effective, especially in crypto and stocks.
Momentum Insider: If you’re into Smart Money Concepts, you’ll love this. It works across all timeframes and helps you see what’s happening behind the scenes in the market. It’s also great for spotting potential reversals using divergences.
Sniper v3: This is a hands-off indicator that’s perfect for spotting major market structure breaks and order blocks. It’s best for higher time frames, but I’ve also used it for swing trading with great results.
Strong BUY / Strong SELL: This is one of the most profitable indicators I’ve come across. It’s got customizable sensitivity settings and includes trend cloud modes. It’s also got built-in risk management features, which I always appreciate.
Momentum Structure PRO: This one’s super versatile—it works for scalping, swing trading, and even long-term investing. It’s based on Smart Money Concepts and has tons of customization options, including multi-timeframe support.
Ultima +: If you’re trading in trending markets, this ALGO is a must. It works on all timeframes and assets, and it’s got adjustable sensitivity settings. I love the built-in TP and SL levels—it makes managing trades so much easier.
Impulse Targets: This is one of the oldest momentum-based ALGOS, and it’s still one of the best. It’s designed to catch new impulse waves, and while it requires some customization for each asset, it’s incredibly effective when set up correctly.
Feel free to share your thoughts on Momentum Radar best TradingView indicators

004. After many years of search and research, I understoodAfter consulting with experts on fields of math and physics, I wanted to know if there is some kind of mathematical transformation to get those information out of the price movements
To be clear, although we observe a point or a line on a two-dimensional (2D) graph, these elements may be projections or sections of more complex forms in three-dimensional (3D) spaces or even higher dimensions. This perspective can be very useful where transformations and representations in higher dimensions provide insights that are not visible in lower-dimensional projections
Fields of knowledge like multidimensional data and differential geometry can help us
As these areas of mathematics provide the basic tools for working with spaces of various dimensions, including transformations such as rotations, translations, and scaling. These transformations help to understand how lower-dimensional objects (like points and lines in 2D) might be representations of objects in higher-dimensional spaces
In multivariate analysis, for exemple, it deals with data that have multiple dimensions (variables). For example, principal component analysis (PCA) can be used to reduce the dimensionality of a dataset, identifying the directions (principal components) that capture the most variance in the data. These components can be visualized as new dimensions that provide insights into the underlying structure of the data
And finally, data visualization, our main goal here, to plot representation of multidimensional data in a way that allows us to capture additional information
The answer lies on... INDICATORS.
Indicators can serve as multidimensional information that plots extra-dimensions for us in a 2D form.
As an exemple, here is an incredible indicator that plots A LOT of extra-dimensions. Note that the data set indicated by the arrow goes up, almost together with the data set indicated by the blue arrow. And this happens when price goes down or remain almost stable.
And although those indicators show a down trend, they can represent a going toward the computer screen, and when those indicators plot a upward trend, we can understand the price is coming foward to us from the computer screen.
Because is impossible (yet) to have a 3D screen in front of us, we must dissect the 3D information in many 2D plots and interpret them
The vertical red doted lines '1', '2' and '3' shows the points of divergence between price movements and the indicators

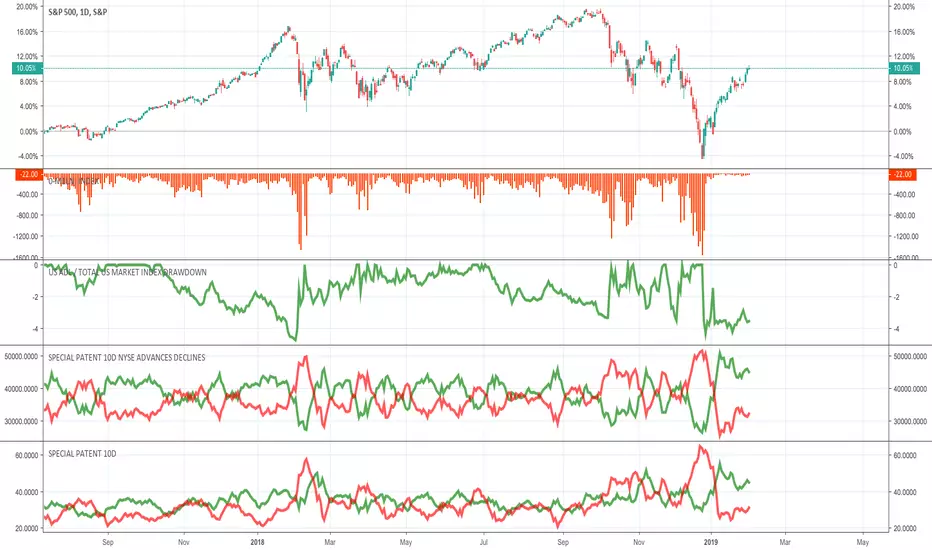
Significant Divergence in equity markets and leading indicatorsObservable for weeks now, and recently, the divergence is much more pronounced.
What I am referring to are that the equity markets appear to be more and more bullish, breaking out of trendlines; while the leading indicators (TIP, TLT, JNK and inversely VXX) show an imminent deterioration, about to breakdown of trendlines.
The combined US equity markets and particularly the NASDAQ itself is very bullish, spiking up and hard in the last two weeks, extending further from mean.
So, going forward the next couple of weeks, either one of two needs to happen.
EITHER, the equity indexes continue the upward surge and the leading indicators reverse course to align and exceed (and return to be leading indicators);
OR the equity indexes breakdown really hard to converge with the leading indicators.
Watch for the latter, as the leading indicators break down of the trend line and show commitment. Then the equity markets may give a swift reversion into convergence and confluence.
There are many ways to look at this and many more parameters to add in, but keeping it as simple as I would, perhaps waiting and watching for the next couple of weeks might be better than taking a committed position.
Stay safe, keep a watchful look, be ready...

Another TD sequential with divergence many other indicators.... Another TD sequential with divergence many other indicators.... and lowry upside vol 90 %

Onchain Indicators: Miners soldOnchain Indicators show an increase in bitcoin sales by miners and short-term investors
A summary of the onchain indicators is written on the chart.
These indicators confirm what the technical indicators show. This sale will reduce the price of Bitcoin and create a local bottom. The value of this local baton will determine the next trend of BTC (see the idea below)

Falling off the cliff, look at indicators..short now!!!Falling off the cliff, look at indicators..short now!!!


EURUSD Short sell using BUY2SELL2BUY easy to use indicatorScriptHere is the nice EURUSD Short sell using BUY2SELL2BUY easy to use indicatorScript.
predicted in 30min time frame ,Entry now.

BTC - Indicators- the SEC CFTC G20 - Regulations & OpportunityTalk about a triple witching Friday! Stocks Down, Metals & Oil Down, and another Down day for Cryptos. So what do we do, and how do we handle days and weeks like what we are going through?
Quite simple, I Look for bargains. Yesterday I posted a list of alt coins I was looking to buy though not quite yet. I also spent the better part of last night going over stocks that I want to buy making that list for next week.
Indicators:
I get a lot of comments on why I do not use indicators like the MA' or MACD'. Quite simply indicators lag the market over any longer period of time. They tell you where we have been and NOT where we are going. Above is a chart of BTC', and as you can see if you sold BTC' when the 50 day EMA crossed the 100 day MA' you almost sold the bottom twice, right before the rally. "Bravo"!! and there are still those that sell this signal. Below I use the standard MA's on the same chart and you can see you did not sell at the bottom twice but three times. Show me the cross on the daily and I'm a buyer! Secondly the MACD' is about the most useless tool, in my opinion, for longer term charts. If your day or scalp trading that is different, but for longer term charts totally useless. Look below at the MACD and tell me what insight you can get from that chart? The PPO' is a better indicator but only if used correctly. And quite frankly most do not use correctly. There is a use for them, but predicting future price action is not one of them. The RSI I do use often and interesting enough we touched the 30 level. This is one reason I am a buyer here. If you bought since 2015 every time BTC' hit the 30 on the RSI' you made money going forward. If you bought when it bounced off the 40 you made money all but once (currently). In addition many longer term robo traders trade the RSI' signal along with other MA's and indicators, but not how most use them.
SEC - CFTC
There is a bunch of hype about the SEC CFTC and G20 meetings coming up. First and foremost there is a huge misunderstanding of what is happening here. This is not about trading Bitcoin' or Ethereum' or a basket of other coins. This is about ICO's and regulations. The U.S along with other countries have already moved to regulate BTC' as best they can, which is at the point of entry and exit through exchanges where people turn bitcoin into cash, with the KYC' rules. So what is all the hype then? Simple, new ICO's and regulation of securities. Bitcoin is not a security because it already exists. Your simply trading a "commodity" (I won't go into the currency/commodity issue here due to space) in the form of a digital asset. So what is the difference?
The orange test.
If I own 100 acres of orange groves, and I sell oranges to you, this is simply me selling a commodity/product. The SEC & CFTC do not care how much I sell the oranges to you for, so there is no need to regulate. Simple free market economy.
If I own 100 acres of orange groves and I sell you a stake in my orange grove with the intent that you will get profits from the oranges, I'm selling an investment or security. Securities are regulated to insure the public is not duped by unscrupulous schemes. This is exactly what the SEC' CFTC' and other countries are looking to regulate. ICO's that make promises on future gains. Like I said months ago. This is good for the space.
This SEC' and CFTC' will not consider BTC' a security because its just like oranges, I'm selling something I own.
The G20
Simply about regulating ICO's, KYC' and how to crack down on money laundering. End of Story!
Bottom Line: The current correction provides opportunity to buy quality coins. I have my list and am going over the charts all day and tomorrow. I'm in no rush. Long term these are simply buying opportunities and long term these markets are headed up. If not why are you here? I believe after the SEC CFTC meeting and the G20 summit we move higher as large asset managers gain clarity into how regulators view BTC'.

How to use Quantity aka Volume Indicators for high profits.There are 3 data sets that are using in technical analysis of a stock, index, or ETF BTC chart.
Price, Time, and Quantity.
Two of these data are required for an indicator.
Using volume bars completes the data for candlestick chart patterns. It is easy to learn how to read and understand the relationship between price action and volume.
When volume has a fading volume pattern, then the run up or down is at risk of suddenly reversing.
When volume surges to the top of the chart, this warns of either extreme panic, or extreme euphoric speculation, OR that HFTs or MEMEs or Hedge Funds are instigating a surge of activity that most retail traders will chase and lose money.
It is important to learn to read volume and quantity indicators so that you can prepare for the end of a downtrend as a bottom begins. It is important to recognize a topping formation before price gaps or runs down wiping out your profits.
There are over 250 Stock and Market indicators. Most are based on price and time. Hybrid Leading indicators are the newest indicators and combine price, quantity and time which signals a day ahead of a shift of direction.

Gold (XAU/USD) Market Analysis: Indicators Point to Potential DoGold (XAU/USD) Market Analysis: Indicators Point to Potential Downtrend
Several factors suggest that gold prices may experience a decline in the near term:
1. Technical Indicators:
• Moving Averages: Current analyses indicate a ‘Sell’ signal based on moving averages, reflecting bearish momentum.
• Oscillators: Indicators such as the Relative Strength Index (RSI) are neutral, while others like the Stochastic Oscillator point towards a ‘Sell’ signal, suggesting downward pressure.
2. Economic Data:
• U.S. Economic Growth: The U.S. economy grew at a 2.8% annual rate in the third quarter, driven by strong consumer spending and increased exports. This robust growth reduces the appeal of gold as a safe-haven asset.
• Manufacturing Orders: In October, U.S. factory orders rose by 0.2%, the first increase after two months of decline, indicating a potential stabilization in the manufacturing sector.
3. Federal Reserve Policies:
• Interest Rate Outlook: The Federal Reserve’s regional survey reflects slight economic growth, with stable employment levels and modest price increases. This may influence the Fed to maintain or adjust interest rates, impacting gold prices.
4. Market Sentiment:
• U.S. Dollar Strength: A stronger U.S. dollar makes gold more expensive for holders of other currencies, potentially leading to a decrease in gold demand and prices.
• Geopolitical Factors: Recent geopolitical developments, such as cease-fires in conflict regions, can reduce demand for gold as a safe-haven asset, exerting downward pressure on prices.
Considering these factors, there is a potential for gold prices to decline in the near term. However, market conditions can change rapidly, and unforeseen events may alter this outlook. It’s advisable to monitor real-time data and news updates for the most accurate information.

A simple intraday Trading Strategy, 3 indicators: In ProgressHello,
I have been backtesting a strategy for the EURUSD currency pair for a while now. It is quite obvious that many people trade double tops (DT) and double bottoms (DB) when trading structure but what happens if you ignore structure and simply trade every DT and DB you see and try and take advantage of the short term trends, namely the 5m, 15m, and 1h time frames?
A few months ago, TradingView updated their DT and DB indicators to include a target instead of just highlighting the pattern. Before this, they had no target whatsoever, and was simply an M or W somewhere in the price action. I back tested these patterns at 1:2 Risk/Reward at the Bottom/ Top of the pattern with a 1% risk, with the idea of bringing stops to breakeven once the neckline has broken and adding a further 1% to the position after a rejection of the neckline with the original target being the target, bringing stops to breakeven and adding another 1% wouldn't make the returns that i expected. Roughly 50 something percent accurate, but with a lot of the trades coming out at breakeven wasn't able to cover losses. It looked like it would work, but I just couldn't get what I wanted out of it, so I have settled with structure trading
Now Trading view has updated their DT and DB indicators, I figured I wanted to try this strategy again and the results I have gotten so far are beyond awesome!!
I have given up with adding 1% and adjusting stops etc. The reason being is my personal life is relatively busy. I simply have a set risk of 2% of my account size for every trade, set the trade with stops and targets and walkaway
THE STRATEGY 5m Time Frame
Rules:
1) No new positions to be placed between the hours of 2100 and 2300 GMT (1 hour before and after market close to avoid excessive "volatility" as the spreads bounce relatively high. 1 hour before gives the trade time to move away from a potentially tight stop avoiding the spread increase, 1 hour after gives time for the brokers to bring the spreads to the normal amount)
2) All trades, whether in profit or at a loss are closed by 2100 GMT Friday, 1 hour before market closes for the weekend. No trades to be held over the weekend
3) Stops and Targets are not to be moved once trade is placed, exiting the trade is by either hitting stop loss, or take profit only, unless its Friday 9pm and only then can manual closing occur
4) 1:2 Risk: Reward at a minimum
5) Do Not react to new setups whilst in a trade. If you enter into a DB trade and mid way through, a valid DT occurs, do not close the position, and enter the second setup
Indicators required:
Trading view Double Top
Trading view Double Bottom
Trading view ATR
Conditions for entry (for LONG positions) (for short positions, reverse it)
Wait for double bottom pattern to show itself on the 5m time frame chart.
Rules for the double bottom are as follows:
I draw a rectangle from the first bottom low of the body, to the low of the wick. This is the termination zone. The second low cannot close below the termination zone (ie, below the wick of the first low)
A wick can go past the termination zone.
This termination zone MUST be touched and test either by a wick or by a candle.
Entry:
On formation of the second low, if the candle formed is green it is an entry. If it is red but a pinbar, then that still counts as bullish pressure (I define a pinbar by using the fibonacci tool, with 1 at the lowest low, and 0 at the highest high, the body must close inside the 0- 0.32 retracement).
If the second low is none of these, then I want to see the next candle green.
Entry is at the close of a valid entry candle on the 5m time frame
On the second low, if the low candle is red, and the candle immediately after is red and neither is a pinbar, then no entry, regardless of what the 3rd and onwards candles do.
Example of a good entry
Example of no entry
Stops:
Find the lowest point of the second low, and add 1 ATR to that to take into account the volatility of the market
Targets:
Defined by the DB indicator
Once trade is placed, switch to the 15m and 1 hour time frame. If DB is found there too, then target the 15m target instead for a really accurate entry and high RR.
For information, I have seen successful RR of 11:1 and numerous 6:1+ setups.
Stats so far:
February 2023
Total trades 26
Loss 17, Winners 9
Profit/loss (in £) £315.15 (based off of a £1000 account size)
Start account £1000, End account, £1315.15
31.5% gain over 26 trades
Most successive losses 7
Most successive wins 3
Average RR of all trades: 4.16:1
Average RR of winners: 3.43
Backtesting findings in February 2023
Example of successful trade

Why am I buying cryptocurrency right now?Hello Traders and Investors. I hope you are doing well.
In this article I want to show you one cool idea. This idea refers to the long-term plan of the cryptocurrency market.
On the chart you can see one of my additional indicators. This development allows me to determine the overbought and oversold levels of the cryptocurrency market.
If green columns appear on the histogram, this indicates a strong overbought market and the best time to buy cryptocurrency. Conversely, if the columns are red, it is time to start reducing your risks and prepare for a strong correction or the beginning of a bear market.
As you can see, the system has been talking about a strong oversold market for the last months. If you decide to buy cryptocurrency, this is a great opportunity (not financial advice). But I personally have already started buying cryptocurrency and at the moment I am using one of the best strategies for this period - the DCA strategy.
You can check for yourself how well the system worked in the past. You can say that now is a different time, there is a crisis in the world, etc., but it has always been like that, believe me, I remember very well the bottom of 2018, or the COVID drop of 2020. In such periods there was always a lot of bad news and fear on the market. This is normal.
In addition, I analyze many other technical and fundamental indicators (SOPR, LTH & STH realized loss/profit, liquidations etc.) and they all say that the market is quite undervalued and oversold. And this is evidenced not only by the indicators of the cryptocurrency market but even by the indicators of the stock market.
Friends, I will be very happy if you like this idea and subscribe to me. It will be the biggest gratitude for me and an incentive to make even more cool content for you. 💚💚💚

These indicators show BTC has LIKELY hit the bottom!Yesterday I was going through some of my old indicators I had saved from a few years back, got playing around with them, I have been really trying to find some way to figure out if we are coming down further or if the dump from the other day is the bottom.
These 3 indicators have predicted the bottom within 5.5%. So when its had 3 green bars, BTC has never gone over 5.5% further down. That for me is highly significant!
Past action is never proof of the future, but when we are all sitting here wondering, "is this the dip BTC takes our souls?!" I think there's some confidence to be taken from what I've found here that its LIKELY, btc will move in an at least a sideways trend for a few weeks.
PLAN FOR THE DUMP, SET YOUR STOPS, but have some confidence in buying bottoms here.. IMO
*Not sure how available these indicators are, if you're interested in getting your hands on them let me know, if theres enough interest I can try and figure out how to share them. I think the ULT RSI is no longer in the TV library online. I may have to check with the author first however.
* Authors name is ChrisMoody, hes here on tradingview, search that name, he has a ton of great indicators.

Ethereum - Best time to take profits using IndicatorsEthereum is about to print a bullish cross on the Stoch RSI on the weekly. The RSI is still low and have so much room to grow. Lets wait and see what happens 1200 UTC time Sunday... ;)
Learn to take profits with Indicators:
RSI: Between 89-99
Stoch RSI: 100
Will be taking profits when both indicators are reached! This will move very fast, so take profits when everyone is buying. I am thinking $7000 - 8000 will be reached mid to end of the year. Once the Ascending channel breaks up, we can see prices in the five digits!! Maybe end of this year to 2022. Be prepared for the biggest shift in Market history. Cryptocurrency bull market is just getting started!
Trade with confidence and with indicators to mitigate risk. Even though I see a huge correction to the downside, this market is going to be MASSIVE. Be prepared for huge moves, but in the end, only people with no emotions will win this game. 90% will lose.
"Markets are a device for transferring money from the impatient to the patient. - Warren Buffet
"Be fearful when others are greedy and greedy when others are fearful." - Warren Buffet.

Practice integrating indicators into my predictions. NIO.I find myself trading only MA's and pattern breakouts, and I want to see what adding indicators will do to my decision making. If I looked only at the indicators here I would say it is coming off of a recent low, and should be fine to continue higher. If all I am doing is reading the signals as they are presented, I would think it's coming off of recently oversold, and is a good time to go long for minimal risk.
*Correction on Slow Stoch: Recently Overbought, and now neutral. Makes me think sell.
*Correction on CCI: Recently Oversold, now neutral. Makes me think buy.
*Ma's are down / Neutral. Makes me think sell.
*RSI: Recently Oversold, now neutral. Makes me think sell.
*MACD: Oversold crossover. Makes me think buy.
*Trendline break: Obviously buy.
*Bull Flag: Buy at breakout.
*Candle formations at turn: red hammer, mix-up candle, strong green body. Makes me think buy.
So the indicators are giving me very mixed signals, and the price action/formations are telling me go long. I don't have good rules for indicators. Or else maybe the mixed-ness should just tell me to find a different stock. I did make up my mind I was trading this before I looked at it... just because I knew I was posting here. More gun at the head behavior... not an ideal trading system.

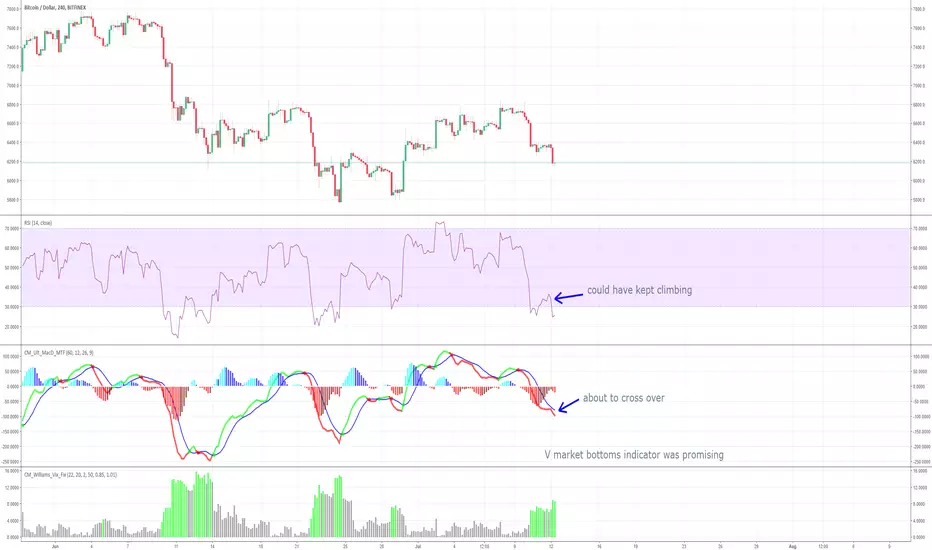
Proof indicators can be wrongBut know when to use the right ones. A lot of people were calling for a bounce to higher levels a few hours ago. Why were the promising 4H indicators shown above wrong? The timing seemed right, since we just got through a massive bull run, and now we're down. You can see the extent of the runs on the 1H, but the pumps kept getting rejected. It's not unlike bitcoin to bust through that anyway. Many people point at this and call manipulation, notably. The 4H as highlighted shows promising signs on MACD, RSI, and probably a great deal of other indicators.
Why were they wrong?
They weren't on the right scale. The 4H indicators don't matter enough right now. Most of the traders here were just trying to make a quick day trade on a few bumps, or possibly a shoulder. They're 1H traders, not 4H traders. A lot of 4H traders are smart enough not to catch a falling knife. Indicators on the 4H or even 1D have a tenancy to lag to the point of not being useful. Assuming the 4H trends could save a falling knife from the 1H and 1D trends was essentially invalid. The 1H MACD is very bad, and moments before the dump it had a death cross (MACD crossover). Secondly, larger trends always override smaller trends. The 4H doesn't matter nearly as much as the 1D here. The 1D RSI can still go lower. A larger trend of fear has already sat in. The 1D RSI only hit the bottom once after a long bear market. Most likely, it will do so 2 or 3 times to consolidate rather than quickly overcoming all that bearish momentum, and people subconsciously expect this. Bearish sentiment and disappointment is still fresh in their minds, not fully healed. Most importantly, all players expect doubt inside all others due to collective and obvious suspicion. They're used to it, which nagged in the minds of the bulls run leading to a sudden but dignified collapse.
This is why I called a second bottom after this run before we saw 7K. I sold after the first pump, which was a mistake of truly underestimating the bulls. I didn't see 3 more pumps coming. Now, I'm in the green despite a collapsing market. I waited it out for a week and managed to make a reasonable profit. This seems like a long time, but I was playing it safe due to the limit of my knowledge. Right now, trading 1H, as we just saw, is suicide. If I had believed it even for a minute, I could have lost everything, feeding the people more patient than me to let the 1D play out.
Will we see a new market low?
I don't think people are gonna let it go much lower than the previous bottom. While people are collectively suspicious and fearful, greed has a wonderful way of convincing people. As we just saw by the bull run, people are willing to bandwagon the bulls despite 6 months of crashing. It only took one pump to cause 3 more pumps afterwards. It's extremely volatile. While collective fear made it collapse this time, it might actually save them the next time in reverse. I knew it would show indecision at first, like the last few times. I risked moving out of my long position to capitalize on that while I knew it was generally safe, and that's why I made a profit. A lot of people who rode the pump to the top still lost money overall. I'm still waiting for the 1D RSI to play out. If I'm wrong, then I can still break even, but if I'm right then I make money. I think it's just gonna take one massive bull flag like the last few bull markets we had once it does get going though. People are tired of waiting. The end of the year is coming, after all. Just my thoughts.
Happy trading
Let's use indicators to predict BitcoinMy advice to begin with: If you trade using indicators, you usually lose money. The reason is that indicators have an offset. That's why you should be really cautious using them. If you begin having a better understanding of how the market behaves then these little fellows might help you predict the movements on the one hand and help you set up some targets on the other.
This chart takes me back to a week ago when I posted my idea "Prepare your shorts for the sea Bitcoin has a beach holiday trip". A week ago this idea was short. And I was right. The movement fits perfectly. The reason: The market often creates Head and shoulder patterns. Up and Down movement just result in that. We want to use this fact and predict the begin of an uptrend after a few days. After the bull run there will be a bearish run again. But that's it. We don't want to go further than that right now. No specific targets as you will lose money using clear targets! We can assume that it might be around fibonacci level, though.
Apart from that, let's see if that would work with other indicators:
RSI would drop when Bitcoin keeps dropping a bit and get into oversold area.
MA's would go on as shown as they have a big offset.
-> everything fits perfectly.
Will this whole Head and Shoulder end in a bigger bearish position? Maybe a bit. But NEVER go too far regarding your analysis. At the end of the day, you will fail. That's why we use what we've learned and apply just for now. Buy low, sell high -> make profits.

BTCUSD / H1 : The big cluster and the two major scenariosNo need to say that bulls & bears are fighting upon two radically different scenario that both can confirm or invalid near the current price area.
Which makes it very incomfortable,volatile, and hard to trade. The best option remains to stay out for a while !
I personnally decided to trade the raw signals from the indicators. Just got a double bearish signal from Sinewave & Momentum.. So I'm short toward the previous support area.
Hope this idea will inspire some of you !
Don't forget to hit the like/follow button if you feel like this post deserves it ;)
Indicators used in this forecast are PRO Sinewave & PRO Momentum .
You can check my indicators via my TradingView's Profile : @PRO_Indicators
Kindly,
Phil
If you want to learn more about the basic rules to trade with my indicators here's the educational video link :

Using Parabolic Sars and Squeeze Indicators IntradayGILD - 3 min intraday chart. Indicators: Squeeze Momentum, Parabolic Sar, and VWAP
These are new indicators for me, so I did this to help me to interpret and utilize them to execute an intraday trade.
First, here is a brief overview of the Indicators used in this chart.
The Squeeze Momentum Indicator is made up of 2 components: Graph Columns and Stars.
The graph columns show the direction on the trend and the intensity. Bright Green is uptrend growing intensity. Dark green signals a loss of momentum and the reversal to the downside. Bright red is a downtrend growing intensity. Dark red signals the loss of momentum and reversal to the upside
There are 2 colors of stars. Red is the squeeze. Grey is the release. When the stars go red to grey, it results in powerful move up or down depending on the color of the graph. Generally, you can enter a trade within 1-3 grey crosses, and exit a trade by 3rd red cross.
Parabolic Sars is really simple. If the price is above the green dots, you can go or stay long. If the price is below the red dots, go short or stay short.
VWAP: I basically use this as a line in the sand. Note: you could use moving averages, but I found that they just made it too confusing, and more difficult to read with no added benefit.
The red and green boxes mark the entry and exits of the possible trades. Ok, so executing the trades.
I skip the first 15 minutes to allow for a proper setup.
At 9:45 we have a grey cross within the red graph, the price is below the red dot, and the VWAP, so go short
At 10:33 we have the 3rd red cross and the the graph is dark red, so you cover. (Short 16 bars/48 min)
At 10:39 we get a grey cross, so go long. (You could have a more conservative entry by waiting for the 2nd or 3rd grey cross).
At 10:54 the price moves over the green dot. There was also a higher high, so you stay in.
At 10:57 the price is rejected by the VWAP, and it is the 3rd red cross on the squeeze indicator.
At 11:09 it is rejected again by the VWAP, it had a lower high, and we are now on the 7th cross, so it's time to sell. (Long for 10 bars/30 min).
It continues squeezing until 11:39 when we get an explosive move up! It goes up over $1.50 in 1 candle. It blew though the VWAP, and price is above the green dot, so go long.
Between 11:57 and 12:00 there is a small pullback, so you could take some profits, but there is no need to exit the position at this point.
At 12:12 The graph changes to dark green (loss of momo), there was a lower high on the last bounce, and it is also the 2nd red candle consisting of mostly tail at the top, so it's time to sell or reverse your position and go short. (Long for 11 bars/33 min)
At 12:15 you have either reversed your previous position, or you are entering a short here. You are on the back end of the move, you have a confirmed lower high, the price is blow the red dot.
13:12. A higher low was put in, and the dark red graph is getting smaller, so it's time to cover. (Short 20 bars/1 hour).
At 13:18 a green dot appears blow the price, so you go long) or you could have reverse your short position 6 minutes ago depending on how aggressive you want to be).
At 14:36, the graph is dark green and close to the midline, so it looks like it is just going to go sideways the rest of the day, close out the position, and keep watching it. (Long 26 bars/1 hour, 18 min).
The red crosses on squeeze momentum indicator stayed for the remainder of the day, and the graph stayed near the midpoint, so there was no momo in either direction, so no further trades were made.

BTC/USD Eyes $109K After Bullish Breakout!!🧠 Chart Type and Indicators:
Chart Type: Candlestick
Indicators Used:
EMA 50 (red line): 85,335.18
EMA 200 (blue line): 85,657.29
🔍 Technical Pattern Analysis:
Pattern Identified: Ascending Triangle
The price has formed higher lows (ascending trendline support) while repeatedly testing a horizontal resistance zone (~$88,000), forming an ascending triangle.
This is typically a bullish continuation pattern when it occurs after an uptrend, though in this context, it's forming after a consolidation, giving more significance to the breakout.
🚀 Breakout Confirmation:
The price has broken above the horizontal resistance and is currently trading at $92,766.51.
Volume is not visible but should be increasing during a valid breakout.
Both EMAs have been decisively breached to the upside, signaling momentum shift in favor of bulls.
🧩 Key Levels:
Support Zone (Post-Breakout Retest): ~$88,000
Previously a resistance zone, now likely to act as support.
Immediate Resistance: ~$96,000
Historical resistance zone shown on the chart with a horizontal black line.
Extended Target (measured move): ~$109,420
Based on the height of the triangle projected from the breakout point.
📈 Price Action Forecast:
Two possible scenarios (depicted with arrows on the chart):
Bullish Continuation:
A retest of the $88,000 zone followed by continuation to $96,000, then $109,420.
Short-Term Pullback:
Price may dip to retest the breakout zone (~$88,000), consolidate, then rally higher.
✅ Bullish Signals Summary:
Breakout from a bullish ascending triangle.
EMAs crossed and price holding above them.
Clear higher highs and higher lows formation.
Momentum suggesting further upside.
🧨 Risks to Watch:
False Breakout Risk: If the price fails to hold above $88,000 and falls back into the triangle range.
Macro Factors: Bitcoin remains sensitive to macroeconomic news and regulations that could disrupt technical setups.
