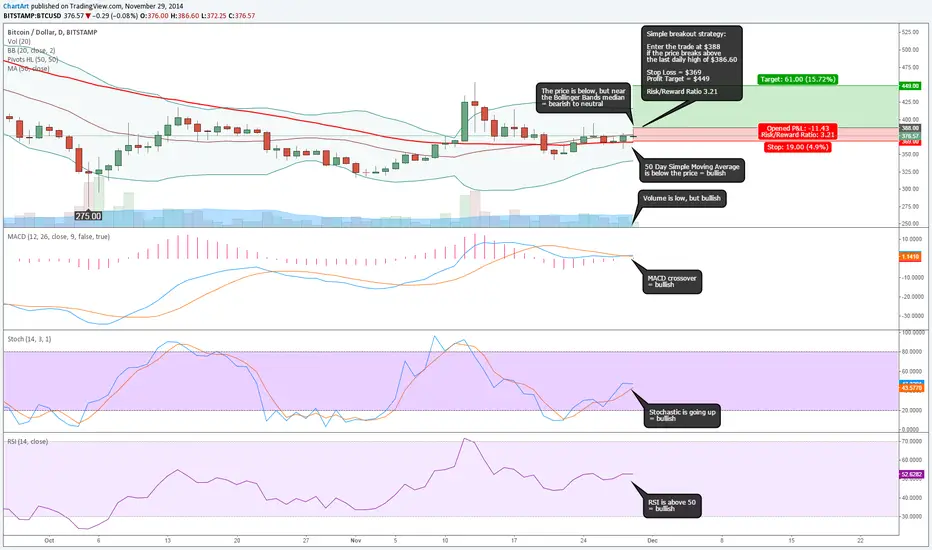
Bitcoin Breakout Trading With The Most Popular IndicatorsAs explained on the chart the goal of this breakout strategy is to avoid risk and therefore the trade should only be entered if the price breaks above the last high of $386.60 on Bitstamp, because this is the last and most important signal to confirm a new uptrend. (Please zoom in to better see the candlesticks).
Maybe this chart helps new people who are starting with trading to see the overall Bitcoin price trend. I researched what the most common day-trading indicators are and wanted to share with you what these show with default settings. The most popular indicators are the MACD, Stochastic and RSI (Relative Strength Index). The Moving Average wasn't mentioned as being the most popular, but I know it's a popular indicator, especially with the classic 50 day period.
Search in ideas for "INDICATORS"
btc/usdt, icp/usdt, and chr/usdt with sell programed indicatorsThe Market Looks Like It's Getting Ready for a Big Day Tomorrow!
Things are Definitely Looking Healthy!
I Hope You Guys Enjoy The Indicators I've Programmed


USD/EUR: 4h Indicators (short term)Expanding my TA beyond cryptocurrencies.
Looking at the indicators USD/EUR will make a little jump downwards when the market opens again and follow it up with some nice profit.

TSLA / D1 : Waiting for indicators to confirm that "perfecto"Hope this idea will inspire some of you !
Don't forget to hit the like/follow button if you feel like this post deserves it ;)
That's the best way to support me and help pushing this content to other users.
All my scenarios and portfolio managements are explained in a daily basis on my Youtube channel.
You'll find a link to get there in my profile signature here : @PRO_Indicators
The English videos are posted upon the "Market Forecast (ENG)" Playlist.
Kindly,
Phil
If you want to learn more about the basic rules to trade with my indicators here's the educational video link :
Effective IndicatorsJust want to share the indicators combination that's working well for me.
The chart demonstrates everything without words. 30 min timeframe.

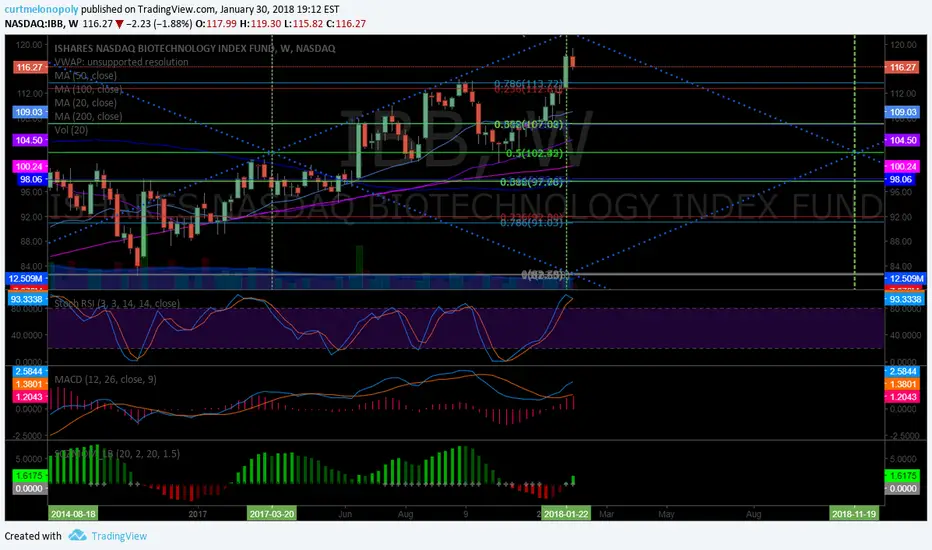
$IBB weekly chart indicators suggest a rest and go (MACD, Stoch $IBB weekly chart indicators suggest a rest and go (MACD, Stoch RSI, SQZMOM) - upper targets from previous chart most probable. #swingtrading

5 LTC entry indicators Coin - LTC/USD
Entry 50.25 & 51.70
Targt #1 - $69
Target #2 - $79
Stop - 46.75
5 Entry Reasons
Strong FA
LTC is a highly traded Alt coin with one of the largest most consistent growths for the year. The fundamentals are strong and Charlie Lee is very committed to the crypto space and the LTC project.
Elliot wave -
We have completed a full market cycle and seemed to be in a horizontal consolidation pattern after the bear correction.
RSI -
When BTC was at its previous ATH of $5k, LTC reached an ATH of $100. On the retrace BTC dropped to 3k and LTC down to $40 which showed more drastic overselling. Since then it has continued in an equilibrium pattern with lower highs and higher lows which is a sign of strong consolidation. However has BTC has completely retraced and gone to new ATH, LTC is still at 50% of the ATH(imagine BTC being at $2,500) and supported by the .236 Fib while the RSI had a double bottom on the over sold
Trend lines -
As we know trends are strong indicators of market direction. There is a long term bullish trend line that supports our purchase point that dates back to march. Also the bear trend line broke around 9/25
Volume -
We had a significant increase in volume after our entry launching our trade in the direction that we want. Volume brings momentum.
All of these alts hide in the shadow of BTC. As long as we don’t see any major sell off in BTC then we should be able to continue has planned. If we have any major BTC sell offs this could drastically impact our trade and stop us out, or cause new entry points.
Big shout out to @sean_vengan who posted this trade first. This is a live trade for me at the posted prices. Excited to see how this plays out!

Bitcoin Weekly Technical Indicators WeakBitcoin, on a weekly basis, looking weak, but still has room to fall. MACD, Premier Stochastic Oscillator, Vervoort Smoothed Oscillator, KDJ, and Ehlers Smoothed Stochastic & RSI with Roofing Filters all are bearish.
I am especially watch KDJ as its strong movement down makes it look like Bitcoin price could make another run at $340 or below.
None of these indicators has bottomed. So expect more downside before Bitcoin price recovers.

Indicators for cryptocurrency arbitrage. Video reviewIndicators allow you to track the spread for a selected trading pair in real time (the exchange rate difference on different exchanges, or the difference between spot and futures), see the price and the exchange for buying and selling at the moment, the history of the spread on the chart, the number/frequency of arbitrage situations for three different time periods, as well as set up alerts when the established threshold level of the spread.
1️⃣ Arbitrage Spread v1 : 1 pair + 1 charts
a lightweight version, all the described functionality is available for one trading pair (bundle).
2️⃣ Arbitrage Spread v2 : 3 pairs + 3 charts –
the same thing, only for three trading pairs at the same time.
3️⃣ Arbitrage Spread v3 : 12 spreads dashboard is
an arbitrage dashboard that allows you to track 12 trading pairs simultaneously, in real time!

indicators shows the "LONG" way!indicators shows the "LONG" way!I showed in the 1m res. but system didn't support to publish. so you should try to see with your eys. follow for more.


Indicators starting to turn. Buy to profit 30 -50 pips from hereIndicators starting to turn. Buy to profit 30 -50 pips from here


Indicators clearly say down!!! Sell now! Banks are welcome!Indicators clearly say down!!! Sell now! Banks are welcome!


