LONG - BULLISH INDICATORS! ADDING 500,000 SHARESAfter solid earnings, SWN just started moving up within the last few days with the price of Natural Gas.
The stock is trading at an extreme discount to other Natural Gas Companies.
Looking at the Weekly Chart... (We are not day traders)
Accum/Dist - Trending Up - BULLISH
On Balance Volume Trending Up - BULLISH
Stochastics Trending Up, Just Crossed the center line - BULLISH
RSI trending up, just crossed the center line - BULLISH
MACD flat looking to break up - BULLISH
Looking at the Monthly Chart...
All indicators mentioned above are trending up - BULLISH
RSI and MACD indicators look like the stock is going to run much higher!
RSI is trending up and HAS NOT even come close to the center line - BULLISH
MACD is below the center line trending up - BULLISH
SWN has plenty of room on the monthly chart to spike up to the $22.00 a share price!
Southwestern Energy Company (NYSE:SWN) is trading with a trailing P/E of 5.5, which is lower than the industry average of 13.6.
Summary for Southwestern Energy (SWN)
Profitable and cash flow neutral.
Trading at deep discount on price to book value multiple and price to net income multiple basis.
No significant debt maturity till 2022.
Cash on hand represents 50% of the market cap.
Increased focus on shareholder value.
"Seeking Alpha Article"
Search in ideas for "INDICATORS"

ETH hanging man's and indicators too highETH hanging man's and indicators too high. ETH hanging man's and indicators too high. I think we are about to see some down side so this thing can reset. lots of resistance at 227, little bit of retesting lower levels likely, but still strong

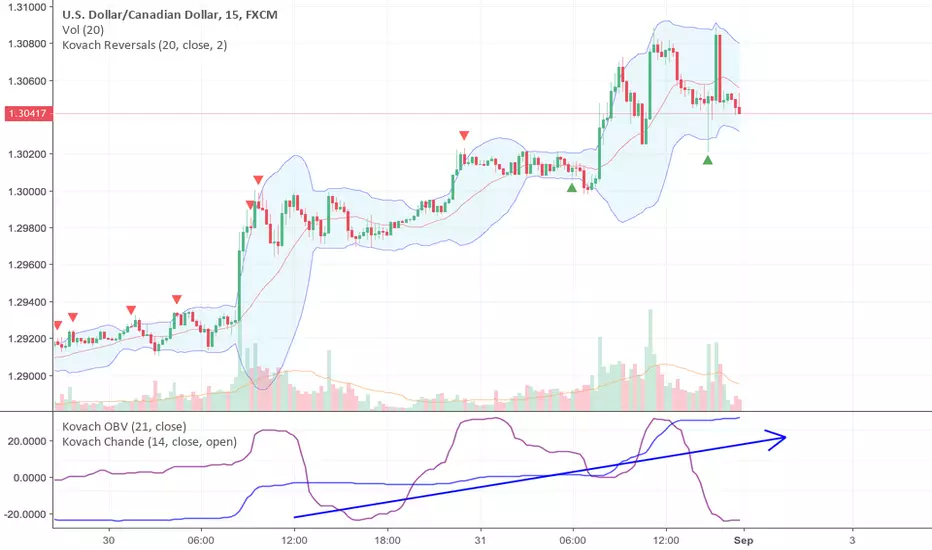
Momentum Indicators Point out a Great Trade in CADThe Kovach Momentum Indicators and Reversals indicator together gave the heads up on a great trade in the Canadian dollar on the back of the trade war on Friday. Those who were paying attention toward the end of the American session (its always thin trading on Fridays), could have made an easy 80 pips.
Observe how the Kovach OBV (blue line) maintains an upward trajectory, but the purple line, the Kovach Chande takes a dip. This is telling us that long term momentum is strong (likely due to insiders) in USDCAD (ie CAD is bearish), but that short term momentum has let up a bit, and thus this is the dip to buy. You never want to chase a trending asset, let you get caught in a pullback, and this set of indicators is perfect for pointing this out. Observe also, the green triangles which identify when you can add to a position.
GBPUSD LONGER TERM INDICATORS TURNING BULLISHThe British pound continues to recovery against the US greenback as the US dollar index remains under heavy selling pressure across. Longer-term indicators for the GBPUSD pair are now starting to turn bullish, with the RSI and MACD indicators starting to turn up on the weekly time frame after weeks of declines.
The GBPUSD pair is bullish while trading above the 1.2900 level, key resistance is now found at the 1.2958 and 1.3010 levels.
If the GBPUSD pair trades below the 1.2900 level, key intraday support is found at the 1.2844 and 1.2775 levels.

BITCOIN indicators conflicting $BTC TARGET HIT 6616!
1W conflicting indicators- look to lower TF's for direction
1D same here- look to MA which is bearish & pointed down
4H same here- MA is flat I will say watch for consolidation 6600-6K
45M indicators running together possible target of ~6400 (MA)
Be careful

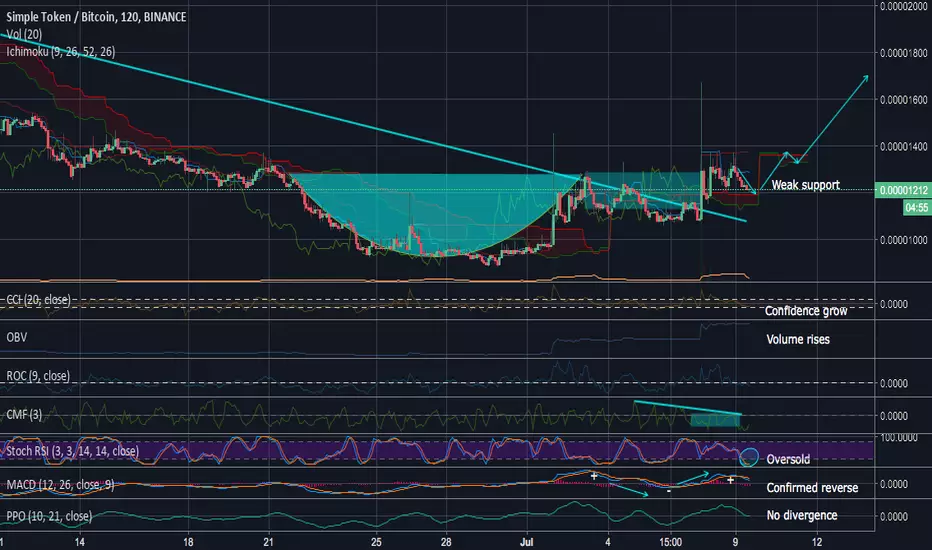
OSTBTC Cup and handle and bullish indicatorsThe price movement formed Cup&Handle pattern just after the breakout from the descending channel. Indicators MACD and Stoch RSI confirm trend reverse and are in bullish state. According to volume and on-balance volume indicators amount of transaction grows. However the price divergence is not observed and the support according to Ichimoku cloud is weak.
We expect a small decrease to the our buying zone and then confident growth to our targets
Reversal Indicators!Hey guys,
This is the first idea I post. All of the indicators are showing there will be a reversal soon. Other than the indicators, its is pretty clear that tradingview's chat is extremely bearish, and that is a major signal that things will turn around. Plus we have already crashed from 10k since the last bull run. If you think that the people who are manipulating this market will just let it crash instead of milking it all the way before it gets regulated, then youre gonna be buying my shitcoins at 8k because youre a sheep.
I think that there will be a bear trap to aprox. 6500usd then bounce to the 8k resistance... However, i think that BTC will eventually go back down to 3k or less....
Please share your thoughts. Constructive criticism is always welcome :) .
Disclaimer: this is not trading/financial advice, just an idea.

Stocks at Good PricesYesterday, the US Supreme Court decided that states could require online companies charge taxes, which caused major tech companies to tumble, which in turn, effected the tech heavy NASDAQ. This index bled through to the others, and it was a down day in stocks world wide.
Today, we have Trump threatening tariffs yet again , which caused a small hiccup in stocks and uptick in bonds, but this was short lived. Bull momentum in stocks seems to have resumed, and these events have provided a nice entry opportunity for us.
Both Kovach Momentum Indicators are bullish which tells us to go into BTFD mode. We have strong support from central moving average of the Kovach Reversals Indicator , which is another strong sign.
Fibonacci levels indicate that $276 is a good target for SPY.

Charts without Indicators
Charts without Indicators
I would suggest to remove all Indicators from your Charts

NANO-BTC Incredible indicators mix promising to run highI was very happy to see my first analyzing give many traders great profits "Thanks for all supporters", so I decided to not share any ideas if I'm not very sure of it.
Now my new idea is here for NANOBTC
Several strong indicators support this idea "up trend , safe triangle, Fibonacci, resistance line"
I'm newbie in the analyzing field, but these indicators together makes me sure it'll rise too high, it's an advice, enter at your own risk.
To be honest I'll not purchase before seeing the price break the triangle and resistance line, then it'll be more safe to wait for the fib lines targets and take safe profits.
Our targets in this deal are:
1st: 0.00157
2nd: 0.00170
3rd: 0.00205
4th: 0.00262 is so far but possible
Other fib lines are possible too depending on the buy volumes after every line.
(A declaration) As a normal trader " not a crazy bot :D " always keep your eye on the selling orders volume before the targets "the very close orders" if it's huge, then you can sell at this point, and follow the trade again from other new point.
All the comments and advice about the idea are welcome.
Happy safe trading all.

BTCUSD / H1 : so far the wave 2 looks like a possible flat..Can't record a video today but this is what I have for now on the Bictoin. It's still very early to confirm but this look like a possible flat correction. Can be regular flat, or an extended flat. I prefer the second option cause this would mean a pullback to the daily resistant trendline shown in red on the chart.
At this point I'll be ready to short again with the double the amount of the partial profit taken on the bottom.
Anyway for now the corrective structure seems to still be ongoing. So patience is the best option right here for a seller like me !
Hope this idea will inspire some of you !
Don't forget to hit the like/follow button if you feel like this post deserves it ;)
You can check my indicators via my TradingView's Profile
Kindly,
Phil
If you want to learn more about the basic rules to trade with my indicators here's the educational video link :

Bullish Daily IndicatorsDaily indicators appear bullish, weekly indicators have not exactly turned yet. Hoping for a quick 5% - 10%. Sorry that the chart is a bit messy, transitioning from Stockcharts.com so need to get used to new interface.

EURUSD / W1-H1 : nice weekly trade with trigger in real-time !Hope this idea will inspire some of you !
Don't forget to hit the like/follow button if you feel like this post deserves it ;)
You can check my indicators via my TradingView's Profile : @PRO_Indicators
Kindly,
Phil
If you want to learn more about the basic rules to trade with my indicators here's the educational video link :

BTCUSD / H1 : Update again ! ... Now it could get nasty...Hope this idea will inspire some of you !
Don't forget to hit the like/follow button if you feel like this post deserves it ;)
You can check my indicators via my TradingView's Profile : @PRO_Indicators
Kindly,
Phil
If you want to learn more about the basic rules to trade with my indicators here's the educational video link :

BTCUSD / H1 : One more short at 11.2K.. adding to 13K & 17KAfter the perfect shorts on both 17K & 13K (the indicators also gave a perfect signal on 14.3K but I simply missed it !!).
Anyway today another signal came in.. allowing me to reduce my stop losses again and afford a new reinforcement on this very nice Sinewave + Momentum trading signal right in a price area I was waiting for.
We're one step forward to the possible krash..
I'm not saying this will happen for sure, just saying it's getting closer to it.
Hope this idea will inspire some of you !
Don't forget to hit the like/follow button if you feel like this post deserves it ;)
You can check my indicators via my TradingView's Profile : @PRO_Indicators
Kindly,
Phil

ETHUSD / H1 : Bull VS Bear accumulation towards decision clusterThe most probable scenario on ETH could be to trigger both a bullish signal (the last valid signal confirmed by both PRO Sinewave &
PRO Momentum indicators) then a bearish signal.
If this happens, we will probable head towards a bull VS bear accumulation. This accumulation generally push prices to a "decision cluster" where the market will decide the next "big move".
I can be a bearish reversal or a new bullish extension. It's impossible to tell at this stage.
The only thing I know is that bulls have to reduce exposure on the possible bear signal, and bear could try an entry on this bear zone if a signal occurs.
Hope this idea will inspire some of you !
Don't forget to hit the like/follow button if you feel like this post deserves it ;)
You can check my indicators via my TradingView's Profile : @PRO_Indicators
Kindly,
Phil

(FINALLY) A Live BTCUSD chart minus the auxillary indicators!I finally spat the dummy and just created a new chart layout without all the additional indicators displayed below the candlesticks.
Now we have some clarity at last!
If anyone has any idea how to publish an idea with displaying all indicators, please let me know!
As we can see from channels, yesterday we broke below the upwards channel drawn between Wave 4 and Wave 5 on a 'cycle' EW timeframe.
This wasn't maintained for long before a bounce back. I spent ~2/3 of my fiat account on various crypto's at this point - prepared for the price to not reach this low again, but also prepared to have some remaining funds for a further potential drop.
We are nearing the end of an ABC correction no doubts about it. What remains to be seen is if we are now beginning Wave 5 in a EW supercycle, or if this rally is temporary - a 'primary' Wave B within a 'cycle' Wave C, with a final (primary and cycle) Wave C drop yet to come, which would complete the correction before the supercycle Wave 5 begins.
In any case, my projection for bitcoin is $33,000 USD by March 2018. However, at this stage, this figure is a guestimate at best. I am constantly modifying my analyzes to account for the most recently available data.
The red box drawn still accounts for all my predictions and speculations on BTCUSD since 29th December 2017. I still believe we will see price move to within this box, but most likely not lower than $11,000 USD - price is unlikely to move within the lower half of the red box.
That being said, a foreseen future event often becomes a self-fulfilling prophecy - making it occur earlier than anticipated. We may well see this at play in the near future.

All indicators in one!All indicators in one! All indicators in one! Hull MA (2 colors) + Bollinger Bands + 6 EMA + 50 SMA + 200 SMA + Parabolic SAR + SUPER TREND (2 colors) + Doji signals (yellow) + RSI Over Bought / Over Sold indicator and Trend Trader Strategy..

BTCUSD / H1 : Possible timing for a "Dead Cat Bounce"I post that chart because I know some of you are going crazy about the bitcoin... is it a bubble or not..
Well let's make this straight... if you think this kind of price action isn't typically a bubble.. then you need to review your classics !
Of course this is a bubble ! The only question is when is going to burst.. That's a tricky question.. and trying to short a bubble require quite some experience.
Every trade need a technical background to support the scenario (otherwise it's just random betting.. and that's gamble.. not trading).
Using my mighty couple of indicators, PRO Sinewave & PRO Momentum , here's what I have :
We can clearly highlight 5 sell signal (confirmed by both Sinewave & Momentum). These will obviously act as resistances during the technical bounce that we may see next.
AND I SAID "MAY SEE" because so far there's not a single sign of bullish support on Sinewave and neither on Momentum.
Finally we can add the "BEAR TREND" confirmation that showed up when things started to get a little nastier !
Which means that until we manage to break a resistance, we're still bearish in terms of probabilities.
Anyway I still think that a pullback is highly probable, but I'll use it to find a short entry...
From a technical prospective, it's possible to short any of these resistances if a Sinewave + Momentum signal shows up under them.
It remains bearish until we remain below the resistance that materialized the bearish trend ignition... and that's at 18400... Which is also 76,4% retracement of the whole bear move..
CONCLUSION :
Bulls have now hell of job to do in order to restore the trend that has now switched to neutral (before going bearish if we fail to reverse the H1 current trend)
If they fail I think the next bearish trend cycle will be a lot more agressive and will potentially drive a market krash. But that's too early to speculate at this stage.
All I can tell is that this thing is no longer bullish right now and after such a rally, searching shorts is certainly the best option now. But still remaining cautious and not shorting nowhere without signals..
Hope this idea will inspire some of you !
Don't forget to hit the like/follow button if you feel like this post deserves it ;)
You can check my indicators via my TradingView's Profile : @PRO_Indicators

BTC/USD UPDATING INDICATORS - BULLISHBTC/USD 4 HOUR TIME FRAME UPDATING INDICATORS FROM PREVIOUS POST. Los Angeles 3:54 PM.
Updating RSI and MAC D indicators from previous post.

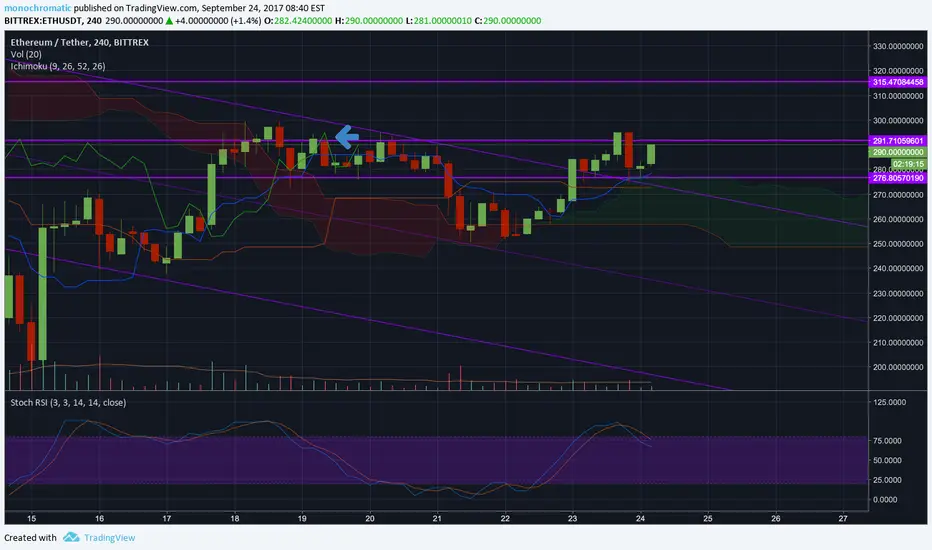
ETHUSDT and ichimoku indicatorsETH has been trying to break out of a downward trend and as of yesterday it appears to be successful. We can use four Ichimoku indicators to tell us when to go long on ETH:
Price breaks out above green cloud
Conversion line (blue) has crossed above base line (orange)
Lagging span (green) from previous period is above the cloud
Lagging span is above the current price line
Of these four indicators, the first three have been met, but the lagging span is still in-line with the current price, which means the overall trend hasn't changed much in the last week. Once the lagging span is above the price line, all four criteria will be met, and a long position is recommended based on the ichimoku. If the current trend continues, this should be around 300 USD.
BTC oversold on 3 indicators - Correction continuesover sold on 3 indicators with possible change of direction on the indicators
On daily chart we are not in that area yet but very close
Possible slow down
No clear indication for long term buy / reversal yet

Leading and Lagging Indicators Main DifferencePlease look at the chart for details. Which indicators can be used correctly during trending market or impulsive market and which indicators can be used correctly when we are having corrective market.
