Ili// Set the length of the SMA
len = input(20, minval=1, title="Length")
// Calculate the SMA
sma = sma(close, len)
// Check for a bullish trend change
bullish_trend_change = crossover(close, sma)
// Check for a bearish trend change
bearish_trend_change = crossunder(close, sma)
// Plot the SMA on the chart
plot(sma, color=color.black)
// Trigger a buy signal
plotshape(bullish_trend_change, style=shape.triangleup, color=color.green, size=size.tiny)
// Trigger a sell signal
plotshape(bearish_trend_change, style=shape.triangledown, color=color.red, size=size.tiny)
// Set the background color based on the trend
bgcolor(bullish_trend_change ? color.green : bearish_trend_change ? color.red : color.gray, transp=75)
Search in ideas for "PLOT"

Buy and sell// Set the length of the SMA
len = input(20, minval=1, title="Length")
// Calculate the SMA
sma = sma(close, len)
// Check for a bullish trend change
bullish_trend_change = crossover(close, sma)
// Check for a bearish trend change
bearish_trend_change = crossunder(close, sma)
// Plot the SMA on the chart
plot(sma, color=color.black)
// Trigger a buy signal
plotshape(bullish_trend_change, style=shape.triangleup, color=color.green, size=size.tiny)
// Trigger a sell signal
plotshape(bearish_trend_change, style=shape.triangledown, color=color.red, size=size.tiny)
// Set the background color based on the trend
bgcolor(bullish_trend_change ? color.green : bearish_trend_change ? color.red : color.gray, transp=75)

Anil chandeos//@version=4
study("Chande Momentum Oscillator (CMO)", overlay=true)
length = input(10, minval=1)
// Calculate CMO
cmo = cmo(close, length)
// Plot CMO
plot(cmo, color=orange, linewidth=2, title="CMO")
// Buy Signal
buy = cmo > 25
plotshape(buy, style=shape.arrowup, location=location.belowbar, color=green, title="Buy")
// Sell Signal
sell = cmo < -25
plotshape(sell, style=shape.arrowdown, location=location.abovebar, color=red, title="Sell")

Visualizing Business and Market Cycles Through Momentum: 2In part one, we discussed using a market momentum matrix to anticipate the business cycle, the potential inflection in the macro environment and shared the final distillation of the current momentum matrix. In part 2 we discuss how the MACD oscillator is used to build the matrix.
Methodology: Individual markets and ratios are plotted in the quadrant that best describes their combination of momentum and price action. The precise point where the individual plots fall in the matrix is not nearly as important as the overall pattern of multiple plot points and the general weight of the evidence. It is important to realize that the momentum state is not always obvious. Accept that its messy and use your best judgement in deciding on quadrants. The idea is build a general view of the market and economic cycle.
What defines the momentum quadrant? The monthly perspective moving average convergence divergence oscillator (MACD). The individual quadrants reflect the relationship between the 13 and 26 month exponentially smoothed averages.
Quadrant One: Waning Bear: In this quadrant momentum is bearish with the shorter average below the longer average, but the difference between the two is becoming less. Momentum is still lower, but at a decreasing rate.
Quadrant Two: Strong Advance: In this quadrant momentum is bullish with the shorter average above the longer average and the difference between the two is becoming greater. Momentum is higher at an increasing rate.
Quadrant Three: Waning Bull: In this quadrant momentum is bullish with the shorter average above the longer average, but the difference between the two is becoming less. Momentum is still higher, but at a decreasing rate.
Quadrant Four: Strong Decline: In this quadrant momentum is bearish with the shorter average below the longer average and the difference between the two is becoming greater. Momentum is lower at an increasing rate.
Trading Ranges: A market in a trading range is removed from the matrix until it breaks from the range even if MACD momentum has been falling/rising for months.
Recycling: It is not unusual for auctions to become overbought or oversold, lose momentum, move into a neighboring quadrant for a few months and then cycle back. When this happens, use your judgment as to which quadrant to place the auction in. This pattern most typically occurs in an market that has reached a momentum extreme in the perspective of one lower degree and typically appears only once.
I think this is currently happening in equities. Bearish momentum is waning as weekly momentum became deeply oversold, but monthly price charts, in my estimation, don't support a change in trend.
In part 3 we will place individual auctions into the matrix and begin to outline market relationships to the business cycle.
And finally, many of the topics and techniques discussed in this post are part of the CMT Associations Chartered Market Technician’s curriculum.
Good Trading:
Stewart Taylor, CMT
Chartered Market Technician
Taylor Financial Communications
Shared content and posted charts are intended to be used for informational and educational purposes only. The CMT Association does not offer, and this information shall not be understood or construed as, financial advice or investment recommendations. The information provided is not a substitute for advice from an investment professional. The CMT Association does not accept liability for any financial loss or damage our audience may incur.

Buy Sell Signal StrategyBuy Sell Signal Strategy 1 - Just Copy Paste this Script and Save in your Trading View Account:
//@version=4
study(title="BUY SELL", overlay=true, resolution="")
short = ema(close, 8)
long = ema(close, 21)
plot(short, color = color.red)
plot(long, color = color.green)
plotshape(crossover(short,long) , style = shape.triangleup , location = location.belowbar, color = color.green , size = size.normal)
plotshape(crossunder(short,long), style = shape.triangledown , location = location.abovebar, color = color.red , size = size.normal)

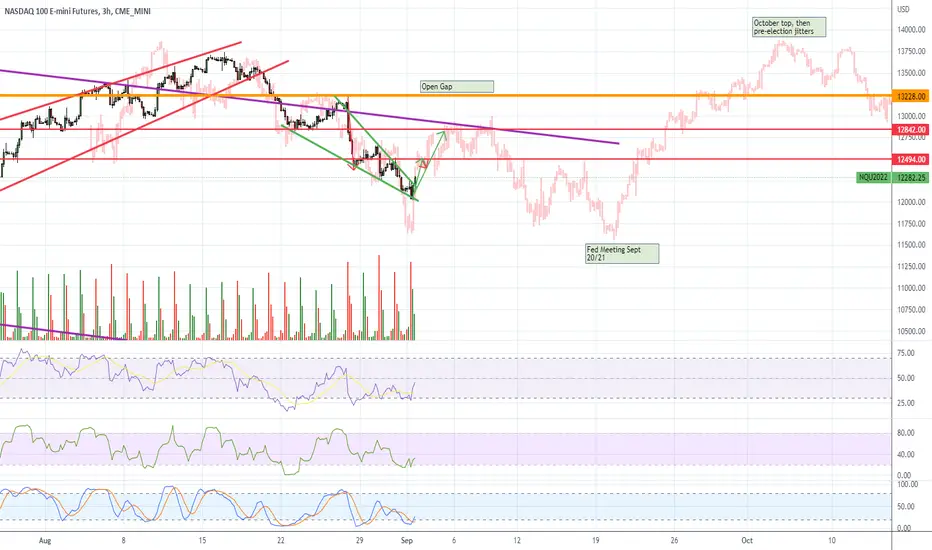
NQ Longer Term ProjectionMy short term projections are pretty good (like today, lol), my longer term ones aren't. But I figured I'd give it a stab...
We rally off this wedgie, then go down again, but rally off the Fed meeting until October. Selloff because of midterm elections, then what happens depends on if Dems retain control and give away more free money.
This is a rough overlay, all trading should be done by looking at 3hr plots. even if you trade long term, it sucks to time it wrong and be underwater as soon as you buy, lol.
You can't be bullish or bearish in this market, you need to read the indicators and play both sides. I played both puts in the morning and calls today, flipped sides right before I posted the NQ wedgie plot.
Cph idea
//@version=4
study(title="BUY SELL", overlay=true, resolution="")
short = ema(close, 8)
long = ema(close, 21)
plot(short, color = color.red)
plot(long, color = color.green)
plotshape(crossover(short,long) , style = shape.triangleup , location = location.belowbar, color = color.green , size = size.normal)
plotshape(crossunder(short,long), style = shape.triangledown , location = location.abovebar, color = color.red , size = size.normal)
The Indian trader
strategy("indian trader V4.0",overlay=true)
res = input(title="Resolution", type=input.resolution, defval="240",confirm = true)
ProfitPerc = input(title=" Take Profit (%)",type=input.float, minval=0.0, step=0.1, defval=1.4) * 0.01
stoploss = input(title=" Stop Loss (%)",type=input.float, minval=0.0, step=0.1, defval=0.7) * 0.01
CCI = input(8,title = "CCI")
ATR = input(3,title = "ATR")
Multiplier= 1
original = false
thisCCI = cci(close, CCI)
lastCCI = nz(thisCCI )
calcx()=>
bufferDn= high + Multiplier * wma(tr,ATR)
bufferUp= low - Multiplier * wma(tr,ATR)
if (thisCCI >= 0 and lastCCI < 0)
bufferUp := bufferDn
if (thisCCI <= 0 and lastCCI > 0)
bufferDn := bufferUp
if (thisCCI >= 0)
if (bufferUp < bufferUp )
bufferUp := bufferUp
else
if (thisCCI <= 0)
if (bufferDn > bufferDn )
bufferDn := bufferDn
x = 0.0
x := thisCCI >= 0 ?bufferUp:thisCCI <= 0 ?bufferDn:x
x
tempx = calcx()
calcswap() =>
swap = 0.0
swap := tempx>tempx ?1:tempx=0 ?color.yellow:color.blue
swap4=original?swap3:swap2
//display current timeframe's Trend
plot(tempx,color=swap4 == color.blue ? color.red : swap4,transp=0,linewidth=1)
htfx = security(syminfo.tickerid,res,tempx ,lookahead = barmerge.lookahead_on)
htfswap4 = security(syminfo.tickerid,res,swap4 ,lookahead = barmerge.lookahead_on)
plot(htfx,color=htfswap4,transp=0,linewidth=3)
//plotarrow( ? 1 : swap4 == color.yellow and swap4 == color.blue ? -1 :0 , title="Up Entry Arrow", colorup=color.green,colordown = color.blue, maxheight=10, minheight=10, transp=0)
plotshape( swap4 == color.blue and swap4 == color.yellow ? 1 : na , text="Sell", textcolor=color.white, style = shape.triangleup , color = color.green , location = location.belowbar , size = size.tiny )
plotshape( swap4 == color.yellow and swap4 == color.blue ? 1 : na , text="Sell", textcolor=color.white,style = shape.triangledown ,color = color.red , location = location.abovebar , size = size.tiny)
buy = swap4 == color.blue and swap4 == color.yellow and htfswap4 == color.yellow
sell = swap4 == color.yellow and swap4 == color.blue and htfswap4 == color.blue

ETCBTC Gann AnalysisUsing the Gann tool we can plot down trends and uptrends
Plotting both, it gives a support point for price, and also a resistance point
I expect a bounce off the support from the downtrend Gann line at some point
This bounce will hit the resistance Gann line (in red)
A large up channel can also be plotted if you place this up move (dotted line)
The indicator is what I expect will occur as price moves (in white)

GBP AUD - Correction completed? Longs addedHello Traders and Analysts,
A Note before reading - this is a forecast analysis - based upon our trading strategy. This is tagged Neutral for the short term. Long term, bullish, due to purchasing further increments upon imbalances.
Please do not take this as face value and conduct the relevant investment strategy to successfully trade the probabilities.
Note:
To see more information - review the linked ideas for more crypto and through the analysis links which provide explanation's for further resources.
Also to add - regarding the simplified method of the Shib Burning model, a full detailed model will be available - please contact me for further information.**
Master Key for zones
Blue = Monthly
Purple = weekly
Red = 4 Days
Yellow = 16 Hours
Orange = Daily
Dark Green = 8 Hour
Grey = 4hour
Pink = 1 hour
Review the full analysis below;
or below
Original analysis process.
Below is an explanation of the imbalance/inefficiency zones based upon the original analysis view.
1. Zone 1: - 1.72 - 1.75
we will be looking at a test of the order block, movement away to keep shorts flowing to keep the imbalance moving towards the zone of a 1.72 redistribution, liquidity to show bears further short options before the lows.
From here we will expect a spring and a test of said springs.
A rejection will occur and then see accumulation phase of price hitting the target on the AUD USD with bullish Aussie.
2. Exactly the same but making further gains moving down to 1.67-1.60 which will be the development.
We volume will be a key indicator here to see the set up of the buy/sell swaps.
Moving to now...
Monthly imbalances:
Pretty simple breakdown from a monthly perspective, where GBP maxed out in March 2020 and began the sellers imbalance to reach lows of 1.742 as previously stated above.
From a buying retrace imbalance - the targets are set at the 1.87 mark and 1.93 the next target. From a positional buy into 2022 if the 50% monthly Fibonacci retracement permits the target and holds above, then extension of 2.0X will be looked towards.
Weekly Inverse Fibonacci
1. this shows the inverse Fibonacci upon the previous imbalance whereby price has created a pivot structure on the weekly chart at 1.9158, price created a low formation to create a reversion of "0" at the base of 1.85, GBP AUD is very good at correcting to 61.8 or 70.5% using Fibonacci, personally the structure of this pair tends to ignore the 50% pivot structure as the pair is open to larger engulfing moves. .
-0.618% Pivot imbalance reversal
Overall this extension target was important to await the initial move, creating the High and low to allow the corrective imbalance to imbalance structure to navigate itself. Those who can form a basis understanding of the imbalance zone at will be able to place shorter term but maintain long opportunities as the overall monthly shows a buying imbalance probability in higher favour than sellers.
Monthly higher highs
The two highlights on this chart has been purposely left to show the 0.236 and 0.382 retracement zones where highly probable bullish moves will occur.
Looking left the white eclipse which is circling the bearish candle, note how the second highlight retraces perfectly to the body of the wick, closes out and nets - this is our net imbalance whereby price has closed out in favour of the bullish manoeuvre which will now show probability over >50% in favour of the bulls.
The second formation of this zone forming an imbalance is for two reasons which will be explained. Revert to the below chart to see why this 0.236 is important.
I. The imbalance candle has netted off and also in combination with higher low formation upon the monthly shows the buying opportunities to now test "0" and continue the trend to the up and right.
The netting is important here as the body of the bearish candle forming the imbalance at
II. The formation of the weekly and monthly inverse Fibonacci and Extension Fibonacci indicate a clear pivotal reactive zone where the inverse completion pattern is now overextended, and the monthly extension pattern is showing a corrective structure for a change of hands.
Daily Correctional Channel
The daily correctional channel in conjunction with the weekly shows the correctional pattern of the creation and formation of the higher lows and lower highs.
When plotting the trendlines upon the swing low of the formation "0" and the correctional pullback for the continued trend of selling over the short, medium term at 61.8% - 70.5%.
The channel lines are formed in line with top wick placed at "1" and now the channel will bounce within these zones probability.
Where the lowest low or completion has formed, the -0.618 has provided a change of hands upon a buying imbalance.
Now price looks to break the trend and resume longs at a discounted price.
The next step is to break the formation of the upper trend line, break and retests are a highly probable scenario where the zone will be testing the "0" and ultimately on a daily timeframe (once a high has formed) a retest of a pivot point be it -0.27 in this case).
Trades can be added here with confirmations for both buys and correctional sells for hedging.
AUD USD
Correlation of GBP AUD vs AUD USD
Imbalance spotting is important to note on one pair like GBP AUD, however the web behind the imbalance is just as important to keep in mind when looking for imbalance trades as pairs are called pairs for a reason.
Looking into two variables where correlation is either Perfect positive correlation +1, 0 or Perfect negative correlation -1 i in simple Lehman's terms.
AUD is coming from a monthly imbalance meanwhile GBP AUD will turn positive where price is coming from a monthly buy imbalance.
Comparing the GBP AUD to the AUD USD - using a monthly correlation grid.
The current at time of analysing is -79.7% negatively correlated. This has been due to the weak USD in play and the positive correlation against the SPX500 and the USD associated with the index. XAU is also a factor here whereby XAU a hedge against inflation and a propulsion for the Aussie to provide further additional strength.
Inverse correction pattern completed upon the weekly, but will now look to test the monthly zone where the AUD has not retested the lower imbalance of 0.70 as yet. The weekly trendline if plotted will show a formation of lower highs but at the same time forming higher low pivots, so where price will come to an apex, we will have to await the confirmation of the next move.
The DXY is pivotal
DXY to see the imbalance reverse upon the devaluation of the USD where the FED has created an abundance of credit which has financed the citizens essentially to 'stay put' in cases whereby specific industry sectors within the US are rendered 'useless' until the hospitality and entertainment, aviation can all be kick started again.
Below are the pivotal monthly imbalances on the chart which are hard to not notice. The Monthly imbalances clearly indicate where the profit targets for the DXY are as price has clearly rejected.
Use this monthly imbalance analysis to help trade in a higher time frame.
Where are now, currently using the weekly chart
Do you enjoy the setups?
Professional analyst with 5+ years experience
Focus on technical output not fundamentals
Position and swing trades
Provide updates where necessary - with new updated ideas tracking the progress.
If you like the idea, please leave a like or comment.
To all the followers, thank you for your continued support.
Thanks,
LVPA MMXXI

Mars4 / USDT Bullish on wave of new NFT project! For educational purpouses only, not a financial advice.! Do your own research, act on your own risk.!
Be carefull quick gains means even quicker loose if you are not carefull
Here is some interesting project emerging into NFT field.
Ever wanted to be a Martian? Here is your chance…Mars4 is a Metaverse and P2E gaming ecosystem where you can explore a geographically exact 3D virtual Mars, own and customize your land and even reap the rewards of the world's first revenue-generating NFT! Mars4 users purchase land plots where they can later cultivate civilisations and create economies. Landlords can build upon, rent and sell their lots. But there is much more to it. The mars4 metaverse will have multiple play to earn games combining the best of Decentraland, Star Atlas and Axie Infinity. Explore Mars in VR and visit the most beautiful places on Mars as a real pioneer… terraform your land and build various constructions like oxygen generators, mining rigs and much more to earn a passive income. Enter the first ever metaverse built on real maps and imagery of Mars and reap the rewards of play to earn or as a landowner… Be quick as the land is selling fast and the price is rising every 10,000 plots. The Mars token will be used for all in game purchases and also to buy the remaining plots of lands so we are not just going to the moon but shooting for Mars 🚀🚀🚀

The grass is always greener on the other side, final part!- After doing a macro analysis of the SPX, where we observed its ascent started right after the "SUBPRIME CRASH" in the distant year of 2009, we saw that it behaved "rationally", following a whole "FIBONÁTICA" chronology, respecting FIBO's targets , as well as their respective support points.
- Now to finish this analysis, let's use two smaller graph times, the medium (weekly) and short term (daily) to try to find the possible arrival point of SPX.
- By plotting the "pivot" of the weekly high, we saw that its arrival point is at 4,486 pts., that is, 1,618 from FIBO, so we can deduce from the weekly chart that the steep rise of the SPX may be starting to lose strength, which denotes a great possibility of correction somewhat "sharp", for this reason, I ask attention to this point.
- In the diary we found one more coincidence; if we plot a bullish pivot on the daily, we see their prices, oddly enough, as their final destination the same 4,486 pts., which by implication is 1,618 for FIBO and the bullish pivot plotted on the daily chart.
- So, with so many "fibonatical" coincidences, as well as the news that is around, such as: production in China falling, approval, but that the US infrastructure package is not moving forward, the lack of inputs, etc., we can even believe that the SPX's historical top is 4486 pts.
- Make your analysis and good business!
- Be aware, If Buy, Use Stop!

Testing for scriptingstrategy(
"EMA Cross Strategy",
overlay=true,
calc_on_every_tick=true,
currency=currency.USD
)
// INPUT:
// Options to enter fast and slow Exponential Moving Average (EMA) values
emaFast = input(title="Fast EMA", type=input.integer, defval=10, minval=1, maxval=9999)
emaSlow = input(title="Slow EMA", type=input.integer, defval=50, minval=1, maxval=9999)
// Option to select trade directions
tradeDirection = input(title="Trade Direction", options= , defval="Both")
// Options that configure the backtest date range
startDate = input(title="Start Date", type=input.time, defval=timestamp("01 Jan 1970 00:00"))
endDate = input(title="End Date", type=input.time, defval=timestamp("31 Dec 2170 23:59"))
// CALCULATIONS:
// Use the built-in function to calculate two EMA lines
fastEMA = ema(close, emaFast)
slowEMA = ema(close, emaSlow)
// PLOT:
// Draw the EMA lines on the chart
plot(series=fastEMA, color=color.orange, linewidth=2)
plot(series=slowEMA, color=color.blue, linewidth=2)
// CONDITIONS:
// Check if the close time of the current bar falls inside the date range
inDateRange = (time >= startDate) and (time < endDate)
// Translate input into trading conditions
longOK = (tradeDirection == "Long") or (tradeDirection == "Both")
shortOK = (tradeDirection == "Short") or (tradeDirection == "Both")
// Decide if we should go long or short using the built-in functions
longCondition = crossover(fastEMA, slowEMA)
shortCondition = crossunder(fastEMA, slowEMA)
// ORDERS:
// Submit entry (or reverse) orders
if (longCondition and inDateRange)
strategy.entry(id="long", long=true, when = longOK)
if (shortCondition and inDateRange)
strategy.entry(id="short", long=false, when = shortOK)
// Submit exit orders in the cases where we trade only long or only short
if (strategy.position_size > 0 and shortCondition)
strategy.exit(id="exit long", stop=close)
if (strategy.position_size < 0 and longCondition)
strategy.exit(id="exit short", stop=close)

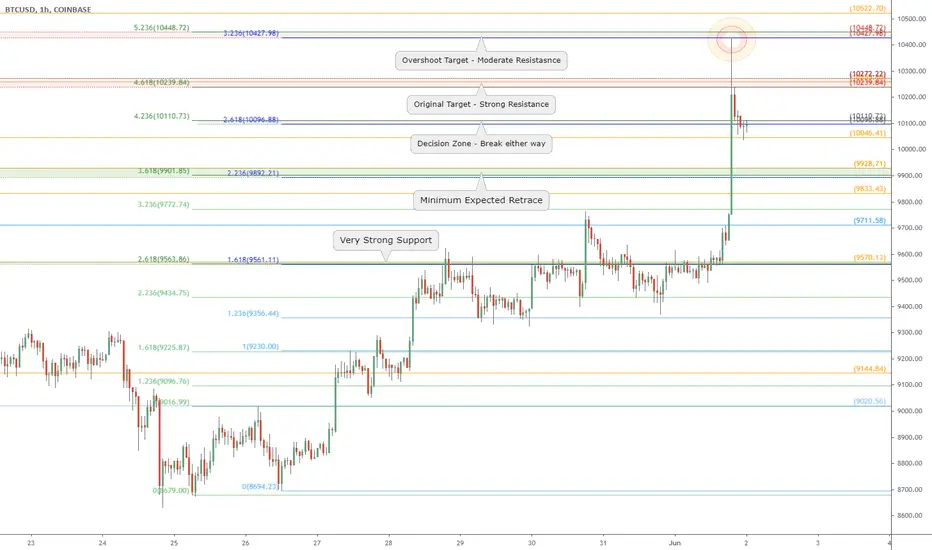
12644 and 38 cents: BTC target near, be Ready for Crash or SpikeThis is a followup and "heads up" to my $12,644 Call (click) .
As we get closer to that target, the more Alert we should be.
Maybe it will be a non event and we will just cruise right thru.
Maybe we have already topped at a lower fib and are done?
It is POSSIBLE that we have already toppped.
It is PROBABLE that we get a final push to target.
It is PLAUSIBLE that we blast thru to higher fibs.
Whatever happens, it is good to be prepared.
If we go higher look to the fibs above for TP's.
If we crash be ready at support zones below.
.
Recent Plots of Covid Recovery:
Covid-19 Crash : $3850 Bottom Taggged <= Fib nailed it.
Bounce Update: $6950 top Plotted
Bounce Update: $5900 launch caught
Bounce Update: $6800 launch caught
Bounce Update: $9335 breakout call
Last Retrace: $8106 Bottom Call
Last Bounce: 11,700 Bounce Caught <= Must See
.
My older charts catching every key turn and giving early warnings:
Mar 06, 2020: 9.2k Top Call
Feb 13, 2020: 10.5k Top call
Feb 10, 2020: 9.7k Bounce <= mapped within $10
Feb 08, 2020: 10k Targetted
Jan 17, 2020: 9k barrier Foretold <= Warning in Time
Jan 07, 2020: 8475 Top Call <= Mapped within $5
Jan 01, 2020: Sub 7k Foreseen
Dec 29, 2019: Big Picture Fibs <= the 3 Fibs of Life
Jun 02, 2019: 14k target call <=Perfect TP
May 12, 2019: 10k target call
Dec 03, 2018: 3.1k bottom call <=EXACT 2018 bottom
.
My "Book" detailing my Methodology with Numerous Examples:
Chapter 1: Introduction and numerous Examples
Chapter 2: Detailed views and Wave Analysis
Chapter 3: The Dreaded 9.618: Murderer of Moves
Chapter 4: Impulse Redux: Return to Birth place
Chapter 5: Golden Growth: Parabolic Expansions
Chapter 6: Give me a ping Vasili: one Ping only
.

BTC near term Support levels of interest: Market-Wide correctionAll markets pulled back today, stocks, gold, crypto.
Bitcoin is now approaching some high tf Fib levels.
Reaction at each fib to be observed for further clues.
11,150-163 is immediate support but was pierced.
11,035-077 likely to be tested, defending 11k round.
10,832-854 could support a sub 11k stop loss hunt.
.
Recent Plots of Covid crash recovery:
Covid-19 Crash : $3850 Bottom Taggged <= Fib nailed it.
Bounce Update: $6950 top Plotted
Bounce Update: $5900 launch caught
Bounce Update: $9335 breakout call
Last Retrace: $8106 possible Bottom <= Fib again.
.
Bitcoin "Genesis Fib" and 12,644 Next Target still in play:
.
My older charts catching every key turn and giving early warnings:
Mar 06, 2020: 9.2k Top Call
Feb 13, 2020: 10.5k Top call
Feb 10, 2020: 9.7k Bounce <= mapped within $10
Feb 08, 2020: 10k Targetted
Jan 17, 2020: 9k barrier Foretold <= Warning in Time
Jan 07, 2020: 8475 Top Call <= Mapped within $5
Jan 01, 2020: Sub 7k Foreseen
Dec 29, 2019: Big Picture Fibs <= the 3 Fibs of Life
Jun 02, 2019: 14k target call <=Perfect TP
May 12, 2019: 10k target call
Dec 03, 2018: 3.1k bottom call <=EXACT 2018 bottom
.
My "Book" detailing my Methodology with Numerous Examples:
Chapter 1: Introduction and numerous Examples
Chapter 2: Detailed views and Wave Analysis
Chapter 3: The Dreaded 9.618: Murderer of Moves
Chapter 4: Impulse Redux: Return to Birth place
Chapter 5: Golden Growth: Parabolic Expansions
Chapter 6: Give me a ping Vasili: one Ping only
.

BTC still on track to $ 10.9k target, maybe 11.5 extended TPPart of my ongoing analysis of Bitcoin moves (see links below).
Per my last big picture call , $10.9k still looks like a perfect target.
HOWEVER, we may need a pullback first, before attacking 10.5 again.
If a serious pullback starts, I will try to project bounce targets at that time.
If you are seeing BLURRY numbers, that is a TV rendering bug.
Click here for a Snap Shot , hopefully with clear digits.
.
Recent Plots of the Covid bounce:
Covid-19 Crash : $3850 Bottom Taggged <= Fib nailed it.
Bounce Update: $6950 top Plotted
Bounce Update: $5900 launch caught
Bounce Update: $6200 Foreseen
Bounce Update: $6800 launch caught
Bounce Update: $9335 breakout call
Last Retrace: $8106 Bottom <= Fib again.
.
The Big Picture: "One Fib to Rule them All":
.
My older charts catching every key turn and giving early warnings:
Mar 06, 2020: 9.2k Top Call
Feb 13, 2020: 10.5k Top call
Feb 10, 2020: 9.7k Bounce <= mapped within $10
Feb 08, 2020: 10k Targetted
Jan 17, 2020: 9k barrier Foretold <= Warning in Time
Jan 07, 2020: 8475 Top Call <= Mapped within $5
Jan 01, 2020: Sub 7k Foreseen
Dec 29, 2019: Big Picture Fibs <= the 3 Fibs of Life
Jun 02, 2019: 14k target call <=Perfect TP
May 12, 2019: 10k target call
Dec 03, 2018: 3.1k bottom call <=EXACT 2018 bottom
.
My "Book" detailing my Methodology with Numerous Examples:
Chapter 1: Introduction and numerous Examples
Chapter 2: Detailed views and Wave Analysis
Chapter 3: The Dreaded 9.618: Murderer of Moves
Chapter 4: Impulse Redux: Return to Birth place
Chapter 5: Golden Growth: Parabolic Expansions
Chapter 6: Give me a ping Vasili: one Ping only
.

LINK.usd next Target and Heads up at $3.8xx: ChainLink near top?Quick post to alert of upcoming strong resistance zone.
Confluence of major fibs defines a right range of strength.
If it gets there, the reaction thereafter will be quite telling.
.
Previous LINK analysis :
$3.75 Tragetted (underestimated)
$3.12 Targetted (conservative, safe)
$2.65 Key Support (important forever)
$2.9 Last Resistance (break out call)
$1.70 Bounce Plot (perfect Ping)
$3.17 Break Out opp (not triggered)
$2.87 Target Call (perfect exits)
$2.65 Support Call (several long entries)
$1.46 Bottom Call (caught exact bottom)
Of course, I have had total FAILS on some ideas too, not going to pretend.
But all of my plots show PRECISE entries, TIGHT stops, and EXACT targets.
Precision is the way of the Fib. Almost every turn happens at a Fib Line.
.

BTC top with Ping that may have rung in a Top, expected EXACTLYPart of my ongoing analysis of Bitcoin movements (see links below).
This is a mid-term update to my bigger picture Target of 10.9k (click) .
Strong surge ended with a "Loud" Ping (one could almost HEAR that one).
If you see Blurry numbers, that is a TV rendering bug.
Click Here for a Snap Shot hopefully with clear numbers.
.
Recent Plots::
Covid-19 Crash : $3850 Bottom Taggged <= Fib nailed it.
Bounce Update: $6950 top Plotted
Bounce Update: $5900 launch caught
Bounce Update: $6200 Foreseen
Bounce Update: $6800 launch caught
Bounce Update: $9335 breakout call
Last Chance Long: $8106 Bottom Tagged <= Nailed it.
Expected Target: $10.9k on the Table
.
The Big Picture: "One Fib to Rule them All":
.
My older charts catching every key turn and giving early warnings:
Mar 06, 2020: 9.2k Top Call
Feb 13, 2020: 10.5k Top call
Feb 10, 2020: 9.7k Bounce <= mapped within $10
Feb 08, 2020: 10k Targetted
Jan 17, 2020: 9k barrier Foretold <= Warning in Time
Jan 07, 2020: 8475 Top Call <= Mapped within $5
Jan 01, 2020: Sub 7k Foreseen
Dec 29, 2019: Big Picture Fibs <= the 3 Fibs of Life
Jun 02, 2019: 14k target call <=Perfect TP
May 12, 2019: 10k target call
Dec 03, 2018: 3.1k bottom call <=EXACT 2018 bottom
.
My "Book" detailing my Methodology with Numerous Examples:
Chapter 1: Introduction and numerous Examples
Chapter 2: Detailed views and Wave Analysis
Chapter 3: The Dreaded 9.618: Murderer of Moves
Chapter 4: Impulse Redux: Return to Birth place
Chapter 5: Golden Growth: Parabolic Expansions
Chapter 6: Give me a ping Vasili: one Ping only
.
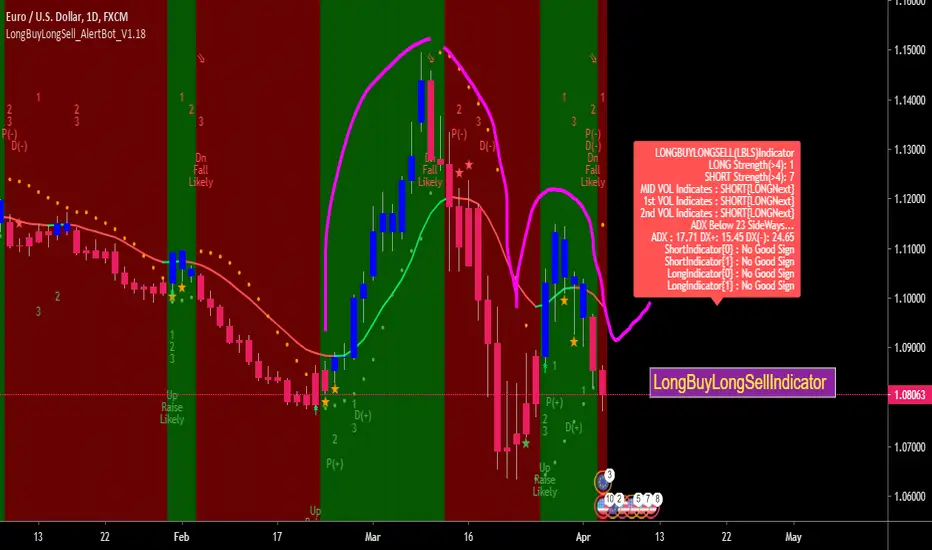
EURUSD LBLS indicator Analysis A SHORT CHARTLooking the Daily time-frame of the Chart with the LongBuyLongSellIndicator plotter graph
This is very clear the Downtrend to continue again to the support level of 1.0700 before any move happens
As LBLS indicator plotted the candles are RED means this is continue to go down
And the Strength-meters shown in the Top shows good to short and continue the short for 3 to 4 trading days.
The Background color of the chart also plotted in red by the LongBuyLongSell indicator which is a good sign for short ;
All the needed criteria by the LBLS is met for short here ,
What is this indicator and what is the Easiest of this Indicator like Color of Background and Candle and The Strength-meters you can check this here by clicking the below image
ETH approaching Key supports during market wide sell offCrypto has been following equities pretty closely.
Ether like many coins is approaching Key supports.
Plotted are some zones that should cause a reaction.
$ 179-182 is first support, should bounce a bit.
$ 167-169 should another strong support below.
$ 142-143 is Bulls Last stand, below is much doom.
Please hit the LIKE to encourage more of these publications.
Between mod duties and my own trading it is not easy to post.
Follow this IDEA for updates, follow ME for new Ideas/updates.
See my previous ETH plots below, under "Related Ideas".
Please feel free to share your opinions under "Comments".
I also plot Forex and some stocks, see my " TV Profile Page ".
.
If interested in my methodology, see these "Chapters" of my "Book": (click links below)
Chapter 1: Introduction and numerous Examples
Chapter 2: Detailed views and Wave Analysis
Chapter 3: The Dreaded 9.618: Murderer of Moves
Chapter 4: Impulse Redux: Return to Birth place
Chapter 6: Give me a ping Vasili: one Ping only

LINK.usd at Resistance now, but "Wave 5" still in on the TableFriends, please hit the LIKE to encourage these publications.
Between mod duties and my own trades it is not easy to post.
Part of my ongoing analysis of ChainLink movements (links below).
Since my last post, Link pulled back a little deeper than expected.
But even then it bounced with a clean Ping on a predrawn fib line.
That bounce gave me an updated road map of the possible wave 5.
Of course, all depends on BTC which also looks ready for bounce.
The immediate resistance above is also first invalidation zone.
We can expect a small pullback here, but it must be a small.
$ 4.2078/2579 is current resistance and possible failure point.
$ 5.0620/0953 is the minimum expected target for wave 5.
$ 5.6470/6900 is the maximum expected for a strong wave 5.
.
Previous LINK analysis (click links below):
$3.75 Tragetted (underestimated)
$3.12 Targetted (conservative, safe)
$2.65 Key Support (important forever)
$2.9 Last Resistance (break out call)
$1.70 Bounce Plot (perfect Ping)
$3.17 Break Out opp (not triggered)
$2.87 Target Call (perfect exits)
$2.65 Support Call (several long entries)
$1.46 Bottom Call (caught exact bottom)
Of course, I have had total FAILS on some ideas too, not going to pretend.
But all of my plots show PRECISE entries, TIGHT stops, and EXACT targets.
Precision is the way of the Fib. Almost every turn happens at a Fib Line.
.
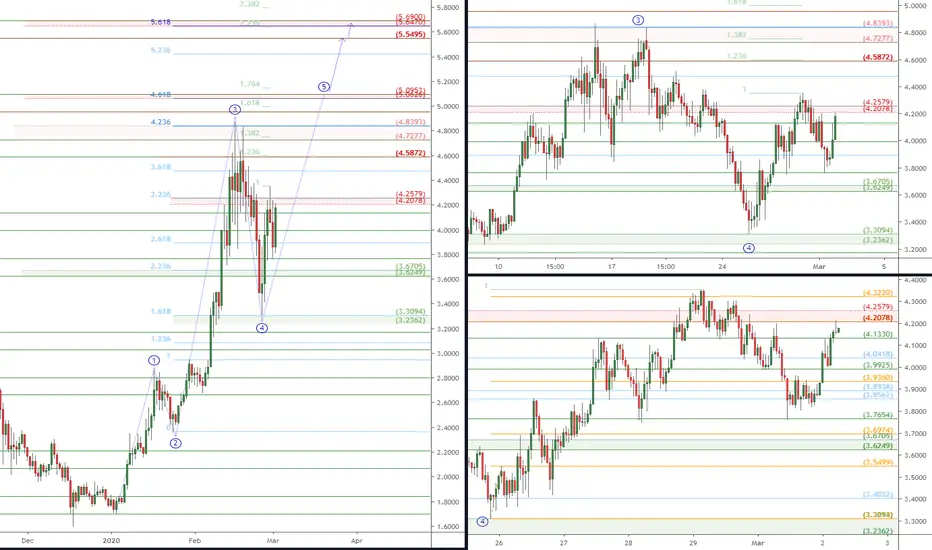
LINK.usd nearing a Temporary (double) Top, but new ATH coming?LINK has been one of the outstanding performers over last few days.
Its parabolic growth is a typical "wave 3" with a w4 and w5 to come.
If it does not "crash" from the double top, we should see another leg.
Left Chart is 1D tf, showing the larger 5 wave impulse under way.
Right upper is 4h tf, for a closer look at the larger order wave 3.
Right lower is 1h tf, with the last small order 12345 of larger 3.
$ 4.4762 - 4.5051 is immediate resistance and possible end of small order wave 3.
$ 4.6277 - 4.6422 should be STRONG resistance aligned with the previous ATH.
$ 4.7035 - 4.7277 could be a STOP HUNT target above the previous high mark.
.
Previous LINK analysis :
$3.75 Tragetted (underestimated)
$3.12 Targetted (conservative, safe)
$2.65 Key Support (important forever)
$2.9 Last Resistance (break out call)
$1.70 Bounce Plot (perfect Ping)
$3.17 Break Out opp (not triggered)
$2.87 Target Call (perfect exits)
$2.65 Support Call (several long entries)
$1.46 Bottom Call (caught exact bottom)
Of course, I have had total FAILS on some ideas too, not going to pretend.
But all of my plots show PRECISE entries, TIGHT stops, and EXACT targets.
Precision is the way of the Fib. Almost every turn happens at a Fib Line.
.

BAT.usd initial Rejection from Strong Resistance, retrace LevelsFollowup to my previous post showing the Massive Resistance at 27 cents (click) .
As expected, we have a pullback from the first Strong Resistance zone.
The pullback thus far looks to have "Fib Legs" so it might continue further.
Plotted are some key levels to watch for further clues about bull strength.
The rejection was a classic "double top" pattern, usually telling of a top.
The last leg down appears to have "fib rhythm" so it may well continue.
It is "possible" that retrace is complete, but "likely" another leg down.
See my Previous BAT analysis: (click links below)
27 cent Resistance
15 cent Bottom
23 cent Break Out
30 cent Break Down
I also plot Forex and Stocks, see my TV Profile Page .
Of course, I have had total FAILS on some ideas too, not going to pretend.
But all of my plots show PRECISE entries, TIGHT stops, and EXACT targets.
Precision is the way of the Fib. Almost every turn happens at a Fib Line.
