The TradingView Show with TradeStation: Bull Market or Fake Out?Join us for a timely TradingView live stream with David Russell, Head of Global Market Strategy at TradeStation, as we break down the latest rebound in the markets and what it could mean for traders and investors. In this session, we’ll dive into:
What the recent bounce off the lows might signal about a potential bull market return
How global trade dynamics and tariff news are shaping asset prices
Key charts, indicators, and technical patterns to watch for signs of sustained momentum
Essential strategies for navigating market recoveries, corrections, and upcoming Federal Reserve decisions
Bonus: Discover our latest broker integration update with TradeStation—now supporting equity options trading directly on TradingView. This upgrade brings advanced tools like the strategy builder, options chain sheet, and volatility analysis to your fingertips, making it easier to trade through uncertain market conditions.
This session is sponsored by TradeStation, whose vision is to provide the ultimate online trading platform for self-directed traders and investors across equities, equity index options, futures, and futures options markets. Equities, equity options, and commodity futures services are offered by TradeStation Securities Inc., member NYSE, FINRA, CME, and SIPC.
Disclosures from TradeStation:
www.tradestation.com
www.tradestation.com
Search in ideas for "TRADINGVIEWS"

The TradingView Show: Charting Markets with TradeStationHello to all global traders! We're live with David Russell, TradeStation's Global Head of Markets giving us an inside look at the most important moves in markets. He’s the expert behind the research and analysis from TradeStation’s official TradingView account.
Follow them here: www.tradingview.com
In this show, we examine the most important charts, interesting trades, and offer valuable education for all traders. What’s on David’s radar? The Fed, inflation, the upcoming Apple iPhone, the big money shifts moving from energy to tech, and other areas to watch including homebuilders and more.
We look forward to connecting with traders worldwide. Share your questions in the comments, contribute your insights, and don’t forget to subscribe for more shows on TradingView with our partners, influencers, sponsors, and global community. Thanks for watching!
This show is for educational and entertainment purposes only, not financial advice. Markets require hard work and dedication, so stay informed and keep learning.
Look first, then leap!
- TradingView
Important disclaimers for ETFs: www.tradestation.com
Important disclaimers for options: www.theocc.com
All other important disclaimers: www.tradestation.com

9 LIVE TRADES 7 WINED 2 LOSEDIt is up to you to comment these trades just watch the previous videos and comment all of them, as you know the aim of this exchange into this site (tradingviews ) is to share our work and improve our selves,
so your opinions will be more usefull for me and for the tradingviews comunity.
leave your folllow and likes if you apreciate this modest work

ATHUSDT.P – Trap Zone Absorption → Reversal | High-Timeframe ValBITGET:ATHUSDT.P
🕐 Timeframe: 1H
📊 Strategy: Trap Zone Reversal | Absorption + Delta Flip + HTF Value Reclaim
⸻
📘 CONTEXT:
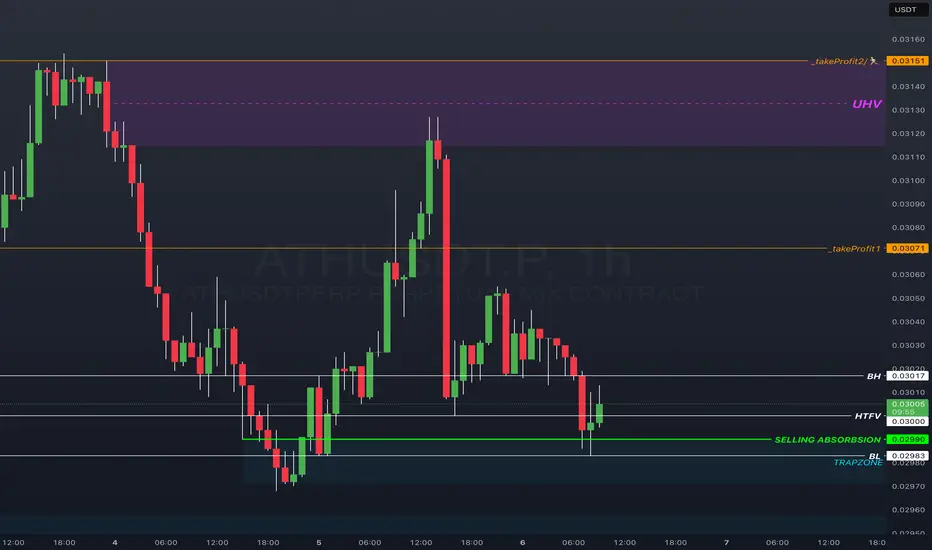
We’re observing a reversal setup on the 1H chart of ATHUSDT.P (BitGet Mix Perpetual).
Price has recently swept a key trap zone and shown aggressive selling absorption near the lows. We’re now seeing reversal momentum building as price reclaims structure.
This follows a period of:
• Failed sell climaxes at the trap zone
• Absorption of aggressive sellers
• Re-entry above higher timeframe value (HTFV)
These are classic markers of a shift from distribution (short bias) into accumulation (long bias).
⸻
🔍 STRUCTURE BREAKDOWN:
• 🔲 Contraction Box High (BH): 0.03017
• 📉 Higher Timeframe Value (HTFV): 0.03006
• 💚 Trap Zone Absorption Level: 0.02990
• 🔵 Trap Zone Low: 0.02983 (Suggested stop-loss zone)
The chart also marks:
• 📈 Sell climaxes that failed to follow through
• 📉 Buy climaxes that have now been absorbed
This suggests wholesale price acceptance has shifted to the upside.
⸻
🎯 TRADE PLAN:
• Entry Zone: Around 0.02990
• Stop Loss: Below 0.02983 (trap zone low)
• Target 1: 0.03071 ✅ (Remove ~33% at this level)
• Target 2: 0.03151 ✅ (Remove ~90%, leave runners)
• Risk/Reward: Designed for a +5% move
• Execution Type: Reversal entry off structural sweep + absorption
⸻
🧠 NOTES ON INDICATORS:
This chart is deliberately stripped of indicators to maintain focus on raw structure and price behavior.
The following zones are marked visually:
• HTFV = Higher Timeframe Value area (drawn manually)
• Trap Zone = Where previous aggressive sellers are now trapped
• Absorption = Inferred from prior failed lows and clustering behavior
• No footprint data shown, but reversal pressure is visible through price structure alone
⸻
✅ TRADE STATUS:
📈 Active – Position Open
Monitoring structure for expansion continuation and scale-out levels.
XAUUSD GOLD AT KEY SUPPORT ZONE (READ CAPTION)hi trader's what do you think about gold
Gold price is currently consolidating between strong support and resistance levels.
Support zone 3527: This is the first short-term area where buyers may step in and push the market upward.
Support zone 3510: A deeper zone of interest; if price falls here, we may see strong bullish reactions.
Resistance 3550: This is the key barrier. If broken with strong volume, the market can extend bullish momentum.
Supply zone 3580: A heavy zone where sellers may appear; price might face rejection here.
📌 Market structure suggests:
If support holds (3510–3527), buyers may aim toward 3550 and even 3580.
If support breaks, price could retest lower levels before stabilizing.
⚠️ Always manage risk properly, as these zones are reaction levels — not guarantees
and please like comment and follow thank you

XAUUSD GOLD RETRACEMENT SETUP RESISTANCE REJECTION OPPORTUNITYHi trader's.
sherigul58: Gold has recently tested the 3486–3488 resistance zone and faced rejection. Since the market has not broken this level, there is a possibility of a retest and retracement move to the downside.
If rejection holds, price may move lower toward the next support area 3452–3448, where buyers could step in again.
Target 1: 3468 support
Target 2: 3452–3448 demand zone
Risk/Stop Loss: Above 3496, this retracement setup becomes invalid.
This is a retracement-based short-term setup, and traders should always manage risk properly.
sherigul58: For more chart updates and detailed setups, you can follow my TradingView profile.
💬 Feel free to share your thoughts in the comments — your feedback is always welcome!

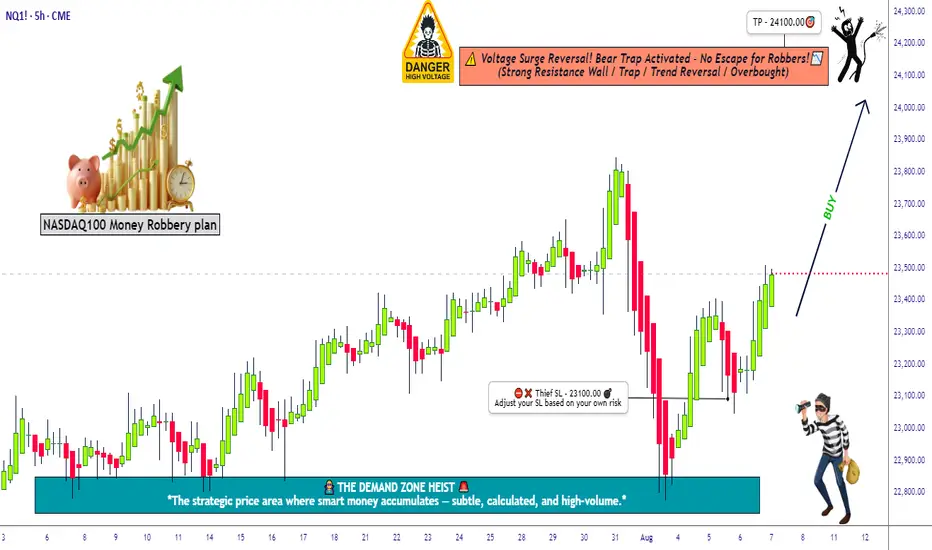
Robbing the Nasdaq Futures | NQ1! Plan with Precise Targets💥🚨NQ1! “E-Mini Nasdaq 100” Heist Alert 🚨💥
🎯Thief Trader Bullish Takeover Plan🕵️♂️📈
🌍 Dear Global Looters & Market Bandits, 💰💸💎
It's time to crack the vaults of the Nasdaq 100 Futures (NQ1!) — Thief-style! No mercy. No fear. Just profits. 🔥
🔓 The digital vault is open — we’re layering multiple limit orders like pros to snatch the tech treasure chest. This isn’t just a trade…
👉 This is an organized robbery of Wall Street’s most elite index. 🏦🕶️
💎 Entry Point = Anywhere on the Grid!
Set your buy limit orders at juicy dips — 15m / 30m / 1H zones, support bounces, or wherever the chart whispers "steal me." 🎧📉
⏰ Stay alert — we don’t chase, we trap. 🐍
🛑 Stop Loss = 23100.00
Set it & forget it below key swing low.
You’re not in this heist to bleed. Risk small. Layer tight. Protect the stash. 🛡️💼
🎯Target = 24100.00
That’s the exit zone before the feds (aka market makers) catch on.
Be smart — take profit early if the heat gets real. 🚓🚨
🧠Strategy Mode: Layering Limit Orders
Thief never enters with one shot. We layer in like ghosts — scaling into value zones, controlling the risk, and building power before liftoff. 🚀📊
This ain’t gambling — it’s structured robbery with exit plans. 🎯💼
🧲 Scalpers & Swingers Welcome!
⚔️ Got big capital? Smash the levels and ride the breakout.
💼 Small cap thief? Ride with the swing crew — safer, smoother, more stealthy.
📍Always use Trailing SL — never let the market take back what you stole. 💰
📰 Market Sentiment: Bullish Bias 😈
AI hype. Earnings season. Rate cuts. You name it — it’s all fueling the Nasdaq rocket.
We’re riding momentum, not hope. This ain’t luck — it’s Thief precision execution.
🔔 Pro Thief Tips:
⚠️ Avoid entries during high-impact news.
🚀 Use alerts. Monitor VIX + QQQ.
💻 Watch for liquidity zones & trap setups.
🚀💣 Smash that 🔥Boost Button🔥 if you love robbing the market like a pro!
Help grow the Thief Trading Crew — one like = one stolen candle from the whales. 💵🦈
We rob institutions, not each other. 💯🤝
Stay locked in — next heist plan coming soon. 📡📈
#NQ1 #Nasdaq100 #EminiFutures #ThiefTrader #RobTheMarket #LayeringStrategy #SmartMoneyMoves #BullishPlan #WallStreetHeist #TradingViewSetup
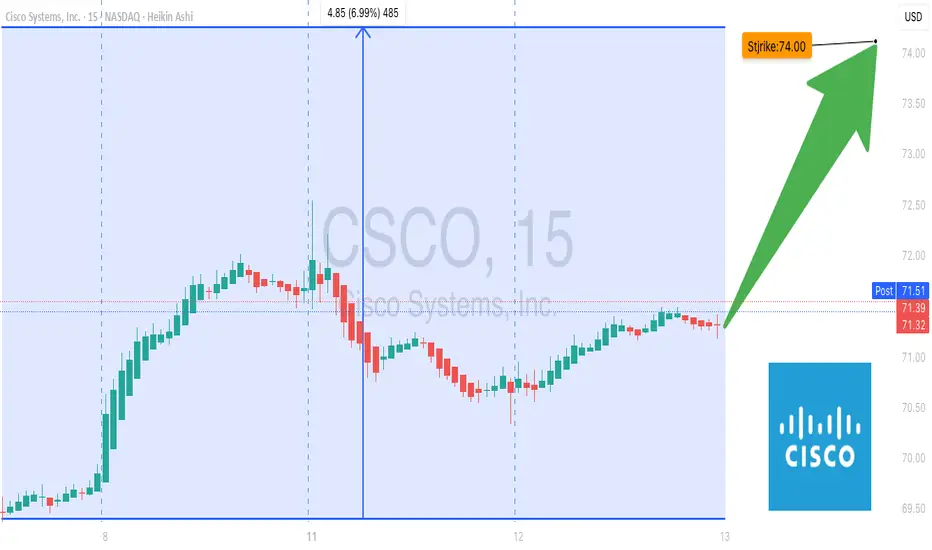
CSCO Earnings Play – Bullish Setup into AI Boom! (2025-08-12)
# 🚀 CSCO Earnings Play – Bullish Setup into AI Boom! (2025-08-12) 🚀
💡 **Cisco Systems (CSCO)** is setting up for a potential post-earnings breakout. Fundamentals, technicals, and sector momentum all align for a **moderate-to-high conviction CALL play**.
---
## 📈 Fundamentals Fueling the Bull Case
* **Revenue Growth:** +11.4% TTM – steady demand from enterprise & AI infrastructure
* **Margins Holding Strong:**
* Gross: **65.2%** 🏆
* Operating: **23.3%**
* Profit: **17.6%**
* **Earnings Consistency:** 8/8 quarters beat, avg. surprise **+5.1%**
* **Guidance Strength:** Forward EPS est. \$3.90 – confidence in profitability
---
## 📊 Options Market Intel
* **Low Volatility:** VIX at 15.52 → calmer market backdrop
* **Call Bias:** Heavy OI in \$73 & \$75 strikes → institutions loading up
* **Put/Call Skew:** Leaning bullish
* **Gamma Setup:** Low vol = reduced whipsaw risk
---
## 🔍 Technical View
* **Trend:** Trading above 20d (\$68.71), 50d (\$67.45), 200d (\$61.68) – clear bullish momentum
* **Resistance:** \$72.55 (52-week high) → breakout trigger zone
* **Support:** \$69.00 – defended by put concentration
* **Pre-Earnings Drift:** Steady climb → accumulation signs
---
## 🌍 Macro Tailwinds
* AI & cybersecurity demand surging
* IT spending cycle favorable for enterprise tech leaders like Cisco
* Sector rotation favoring growth & infrastructure plays
---
## 🎯 Trade Plan – Long Calls for Earnings Pop
**Type:** Buy to Open CALLs
**Strike:** \$74.00
**Entry Price:** \$0.85
**Expiry:** 2025-08-15
**Confidence:** 75%
📈 **Targets:**
* PT: \$2.00 (+135%)
* SL: \$0.42 (-50%)
* Time Exit: Within 2 hrs post-earnings if PT/SL not hit
---
## 🛡 Risk Management
* Max Risk: 1 contract = \$85
* R/R Ratio: \~1 : 2.5 – 4.0
* Avoid overnight hold past expiry
---
### 🧠 TradingView Takeaway
This is a **trend continuation earnings bet**. Strong balance sheet, bullish options flow, and favorable macro backdrop make CSCO a prime candidate for an earnings breakout.
---
💬 **Question:** If CSCO clears \$72.55, do you see a \$75+ close by Friday?
\#CSCO #EarningsPlay #OptionsFlow #BullishSetup #AIStocks #BreakoutWatch #TradingViewSetup #TechnicalAnalysis #LongCalls #EarningsTrade
DFDV Earnings Setup – Bearish Play Ahead! (2025-08-12)
# 🚨 DFDV Earnings Setup – Bearish Play Ahead! (2025-08-12) 🚨
💡 **Institutional & Options Data** are flashing red for **DeFi Development Corp. (DFDV)** ahead of earnings this week. Here’s why this setup is 🔥 for traders.
---
## 📉 Fundamental Red Flags
* **Revenue Crash:** TTM growth **-30.2%** 💔
* **Margins Bleeding:** Profit Margin **-128.6%**, Operating Margin **-329.9%**
* **Analyst Disconnect:** “Strong Buy” ratings… despite collapsing fundamentals 🤔
---
## 📊 Options Market Signals
* Heavy **Put OI @ \$15.00** → 1,612 contracts
* Weak call interest → Bulls missing in action
* **Put/Call Skew** confirms bearish bias
---
## 🔍 Technical View
* Price **well below** key moving averages → strong downtrend
* RSI in oversold zone → possible dead cat bounce
* **Critical Support:** \$15.00 → break here = 🚀 for bears
---
## 🌍 Macro Factor
* **Crypto Dependency:** Highly tied to Solana price movements
* Crypto volatility could amplify earnings reaction
---
## 🎯 Trade Plan (High-Conviction Put Play)
**Type:** Buy to Open PUTs
**Strike:** \$15.00
**Entry Price:** \$0.55
**Expiry:** 2025-08-15
**Confidence:** 80%
📈 **Targets:**
* PT: \$1.10 (+200%)
* SL: \$0.28 (-50%)
* Time Exit: Close within 2 hrs post-earnings if PT/SL not hit
---
## 🛡 Risk Management
* Size: **2% of portfolio** max
* Stick to PT/SL – IV crush will be brutal post-announcement
---
### 🧠 TradingView Takeaway
This isn’t a “buy the hype” setup – it’s a **fade the fundamentals** play. Options flow + technicals + fundamentals all point one way: 📉
---
💬 **Question:** If \$15 breaks, do you see \$12 coming before month-end?
\#DFDV #Earnings #OptionsFlow #BearishSetup #PutOptions #SolanaLinked #TradingViewSetup #ShortTheHype #TechnicalAnalysis #EarningsPlay

GBPUSD LONGCheck comment for the proper multi-timeframe layout due to TradingViews publishing restriction
MT5 screenshot also attached.
Still moving in line with the bullish bias I shared in Monday’s post.
Things may shift eventually, but for now — we ride it.
4H supply in control, aligned with weekly demand. 5M demand held strong.
Waited for price to return to the mapped zone, dropped to 15s for execution.
Tapped out after 3RR achieved — not more, not less.
Same system. Same pair. Different day.

GBPUSD LONGCheck comment for multi-timeframe clean layout due to TradingViews publishing restriction. M5T screenshot also attached.
Price reacting from weekly demand, as mapped out in Monday’s post.
Still expecting a bullish move — unless 4H supply holds again.
Today, demand showed strength across timeframes.
5M demand held firm, aligning with 4H demand.
Waited for price to return to the 5M zone, then dropped to 15s for entry.
Tapped out after 3RR was achieved — no more, no less. same system, same pair
Data never lies.

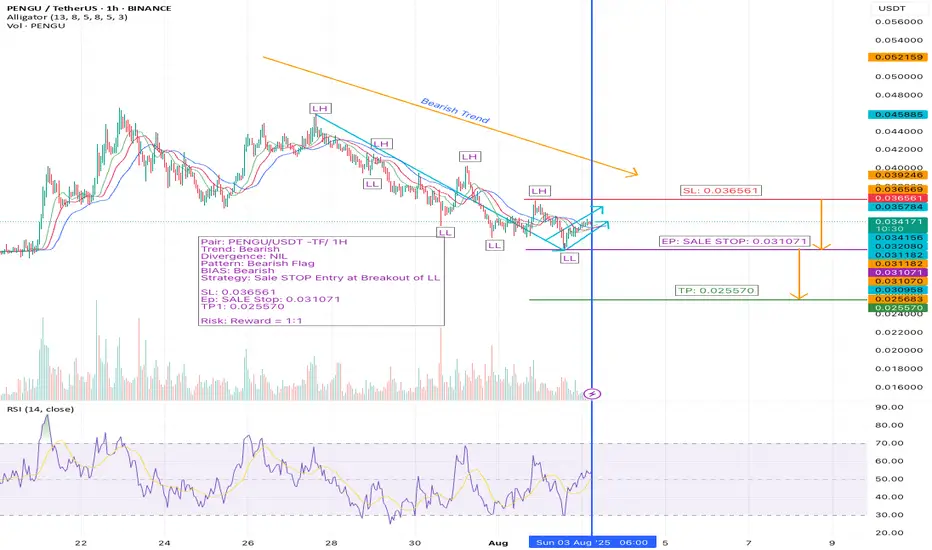
PENGU/USDT 1H Setup – Bearish Flag Breakdown on WatchWe’re analyzing PENGU/USDT on the 1-hour timeframe, and the structure is setting up for a potential continuation to the downside.
🔹 The current trend is bearish
🔹 Price is in a retracement phase, forming a new Lower High (LH)
🔹 A bearish flag pattern is developing — often a strong continuation signal
🔹 We are executing our Sell Stop strategy at the breakout of the Lower Low (LL)
🔹 Expecting a bounce after LH, followed by resumed bearish momentum
📌 Trade Setup Overview:
Pair: PENGU/USDT
Timeframe: 1H
Trend: Bearish
Divergence: None
Pattern: Bearish Flag
Bias: Bearish
Strategy: Sell Stop at LL Breakout
🔻 Entry (EP): 0.031071
🔴 Stop Loss (SL): 0.036561
🟢 Take Profit (TP1): 0.025570
⚖️ Risk:Reward Ratio: 1:1
💼 Why This Trade Stands Out:
✅ Bearish flag within a strong downtrend
✅ Classic LH formation signaling exhaustion of retracement
✅ Tight SL and logical TP based on recent structure
✅ Clean 1:1 setup ideal for short-term swing execution
💬 What do you think about PENGU/USDT?
Are you seeing the same bearish setup? Comment your analysis below 👇
🔔 Follow me for more price action-based setups, altcoin breakdowns, and clean risk-managed trades. Let’s grow and win together! 🚀
#PENGUUSDT #CryptoSetup #BearishFlag #AltcoinAnalysis #PriceActionTrading #1HChart #TrendContinuation #BearishBias #CryptoTechnicalAnalysis #AltcoinBreakout #SellSetup #BearishStructure #RiskReward #TradingStrategy #CryptoSwingTrade #ChartPatterns #BearishTrend #CryptoCommunity #TradeWhatYouSee #CryptoTraders #TradingViewSetup #AltcoinWatchlist #SmartEntry #VolumeAnalysis #CryptoShort
CVX Earnings Trade Setup — August 1, 2025
## 🚨 CVX Earnings Trade Setup — August 1, 2025 🚨
🔍 **Chevron (CVX) Earnings Analysis | High Conviction Call Play**
### 🧠 Model Consensus (Multi-LLM Blend)
* 📉 **Revenue Trend:** -1.0% TTM growth, margin pressure from falling oil
* 📈 **Analyst EPS Expectation:** \$11.04 with 26.2% YoY growth est.
* ⚠️ **Miss Rate:** 50% EPS beats w/ average surprise -2.2%
* 💬 **Consensus Sentiment:** ⚖️ *Moderate Bullish (Confidence: 60%)*
---
### 🔥 Options Heatmap
* 🟢 **Most Active Call:** \$152.50 strike, 🔥 ask volume at 152
* 🔺 **IV Rank:** 63% → *Moderate move expected*
* 🧊 **Put/Call Skew:** Defensive bias with light bullish divergence
* 🕵️♂️ **Dark Pool:** Mild accumulation hints by institutions
---
### 📉 Technical Breakdown
* 🔹 Near 50/200 MA — Neutral Pre-Earnings Drift
* 🔸 Support: \$150 | Resistance: \$155
* 🔻 Volume: 0.53x avg → *Weak conviction*
---
## 🎯 TRADE SETUP
🛠️ **Strategy:** Long Call (Pre-Earnings Entry)
💰 **Strike:** \$152.50
📅 **Expiry:** 2025-08-01
💸 **Entry Price:** \$3.70
🧠 **Profit Target:** \$11.10+ (200–300%)
🛑 **Stop Loss:** \$1.85
📊 **Risk/Reward:** \~2.5:1
🕓 **Exit Timing:** 1–2 hrs post-earnings (to avoid IV crush)
---
### 🧪 Earnings Catalyst Trade
Chevron’s setup shows a **classic low-volume/high-upside IV play**. Risk tightly managed with a defined stop, but room for explosive move if earnings surprise to upside.
---
📦 **Trade JSON Snapshot:**
```json
{
"instrument": "CVX",
"direction": "call",
"strike": 152.50,
"expiry": "2025-08-01",
"confidence": 60,
"profit_target": 11.10,
"stop_loss": 1.85,
"size": 1,
"entry_price": 3.70,
"entry_timing": "pre_earnings_close",
"earnings_date": "2025-08-01",
"earnings_time": "AMC",
"expected_move": 5.0,
"iv_rank": 0.63,
"signal_publish_time": "2025-08-01 13:05:25 UTC-04:00"
}
```
---
📈 **#OptionsFlow #CVX #EarningsPlay #TradingViewSetups #LongCall #EnergySector #IVCrushProtection #PreEarningsTrade**

USD/CAD 1H Setup – Bearish Reversal Incoming? We’re closely watching the USD/CAD pair on the 1-hour timeframe, and the chart is flashing multiple high-probability reversal signals.
🔹 The trend has been bullish, but momentum is weakening.
🔹 A clear bearish divergence has formed on the oscillator.
🔹 A rising wedge — one of the most reliable reversal patterns — is fully developed and ready to break.
🔹 All signs point toward an imminent bearish shift, and we're preparing to catch the move early with a Sell Stop below the key Higher Low (HL).
📌 Trade Setup at a Glance:
Pair: USD/CAD
Timeframe: 1H
Trend: Bullish (for now)
Divergence: Bearish
Pattern: Rising Wedge
Bias: Bearish
Strategy: Sell Stop at HL Breakout
🟡 Entry: 1.38379 (Sell Stop)
🔴 Stop Loss: 1.38847
🟢 Take Profit 1: 1.37911 (R:R 1:1)
🟢 Take Profit 2: 1.37443 (R:R 1:2)
📊 Position Sizing & Risk Management
🔹 Lot Size: 0.25
🔹 Risk Per Trade: $200
🔹 Total Reward Target: Up to $300
🔹 Executing two trades – one targeting TP1, the second targeting TP2.
📈 Why This Setup Matters:
✅ Bearish divergence shows clear loss of bullish strength
✅ Rising wedge pattern aligns perfectly with reversal expectations
✅ Well-structured entry with favorable risk-to-reward
✅ Using a split-target strategy to lock in profits smartly
📣 Let’s Discuss!
💬 Drop your thoughts and analysis in the comments — how are you trading USD/CAD?
🔔 Follow me for more high-probability trade setups, chart breakdowns, and real-time analysis. Let’s trade smart and grow together! 🚀
#USDCAD #ForexSetup #RisingWedge #BearishDivergence #PriceActionTrading #SmartMoney #TrendReversal #FXSignals #SellSetup #TradingStrategy #ChartPatterns #BreakoutStrategy #TradeSmart #1HourChart #RiskReward #ForexTrade #TechnicalSetup #TradeIdeas #TradingCommunity #ForexEducation #TradersOfTradingView #SmartEntry #SwingTrading #TradingMindset #TradingViewSetup #ForexAnalysis

HIMS WEEKLY TRADE IDEA (7/29/25)*
**💊 HIMS WEEKLY TRADE IDEA (7/29/25)**
**🔥 Bullish Flow + Rising RSI + Institutional Volume**
**📈 Trade Setup**
• **Stock**: \ NYSE:HIMS
• **Direction**: CALL (LONG)
• **Strike**: \$64.00
• **Entry**: \$0.92
• **Target**: \$1.38
• **Stop**: \$0.46
• **Size**: 2 contracts
• **Expiry**: Aug 1, 2025 (3DTE)
• **Confidence**: 80%
• **Entry Timing**: Market Open
---
**🧠 Why This Trade?**
✅ **Call/Put Ratio = 1.37** → Bullish sentiment
✅ **RSI Daily: 65.2 / Weekly: 61.3** → Momentum building
✅ **1.8x Weekly Volume Surge** → Institutional accumulation
✅ **\$64C OI = 2,616** → High liquidity + interest
⚠️ **Gamma Risk + Fast Decay** → Time-sensitive play
---
**🎯 Strategy**
→ Play the momentum spike into expiry
→ Exit quickly on profit target or 50% stop
**#OptionsTrading #HIMS #SwingTrade #EarningsPlay #TradingViewSetup #FlowTrade**

TradingView Show: Trade Ideas You Can't Miss with TradeStationJoin us for a timely TradingView live stream with David Russell, Head of Global Market Strategy at TradeStation, as we break down the latest rebound in the markets and what it could mean for traders and investors. In this session, we’ll dive into:
- New sectors to watch, like homebuilders
- Prior insights on companies like Coinbase and Micron
- What trades are setting up, why, and educational concepts to plan for them
- Upcoming economic news and more to have on your calendar
- Key charts, indicators, and technical patterns to watch for signs of sustained momentum
- Essential strategies for navigating market recoveries, corrections, and upcoming Federal Reserve decisions
Bonus: Discover our latest broker integration update with TradeStation—now supporting equity options trading directly on TradingView. This upgrade brings advanced tools like the strategy builder, options chain sheet, and volatility analysis to your fingertips, making it easier to trade through uncertain market conditions.
This session is sponsored by TradeStation, whose vision is to provide the ultimate online trading platform for self-directed traders and investors across equities, equity index options, futures, and futures options markets. Equities, equity options, and commodity futures services are offered by TradeStation Securities Inc., member NYSE, FINRA, CME, and SIPC.

ONDO/USDT Breakout Watch – Reversal Incoming
🔍 Overview:
The ONDO/USDT pair is currently at a critical inflection point. After months of being suppressed in a downtrend, price action is now testing a major descending trendline that has capped the market since the peak in December 2024. A breakout here could be the beginning of an explosive bullish phase — but failure might confirm further downside.
📉 Pattern: Descending Trendline Compression
ONDO has been forming consistent lower highs, creating a clear descending trendline structure.
Price is now pressing against this resistance, attempting a breakout with a strong 2D candle.
A confirmed breakout will occur once ONDO closes above $0.916 on the 2D chart, which also acts as a horizontal resistance.
✅ Bullish Scenario – The Start of a Mid-Term Reversal?
If the breakout is confirmed, we could see strong upward momentum, as there’s relatively little resistance in the upper zones.
🎯 Potential Targets:
1. $1.11 – First psychological and technical resistance.
2. $1.327 – Previous consolidation zone from Feb–Mar 2025.
3. $1.577 – Major supply zone before the heavy correction started.
4. $2.045 - $2.145 – All-time high area, the ultimate mid-to-long-term target.
📈 Note: Although not shown in this chart, RSI is likely leaving oversold territory, supporting the bullish momentum shift.
❌ Bearish Scenario – Classic Bull Trap Ahead?
If price fails to break and close above the trendline and $0.916, this could turn into a fakeout or bull trap.
📉 Possible downside levels:
$0.8399 – Minor support currently holding.
$0.70 – Strong horizontal demand zone.
$0.53 – Long-term support base, potential double bottom zone.
If momentum fades here, ONDO could revisit these lower areas before finding a true bottom.
🧠 Sentiment & Trading Strategy:
Breakout confirmation: Wait for a solid 2D candle close above the descending trendline and $0.916. Look for volume spike.
Conservative strategy: Enter on break + retest of the trendline, with SL below $0.83 and multi-level TPs.
Aggressive strategy: Enter on the initial breakout with dynamic trailing stops and resistance-based targets.
🏁 Conclusion:
ONDO/USDT is at a make-or-break moment. A confirmed breakout from this long-term descending structure may trigger a strong reversal with over 100% potential upside. However, if the market rejects this breakout attempt, it could extend its bearish trajectory.
Patience, confirmation, and disciplined risk management are key here.
📌 Key Levels to Watch:
Support: $0.8399 – $0.70 – $0.53
Resistance: $0.916 – $1.11 – $1.327 – $1.577 – $2.045 – $2.145
#ONDO #ONDOUSDT #CryptoBreakout #BullishSetup #AltcoinAnalysis #CryptoReversal #TradingViewSignals #TechnicalBreakout #DescendingTrendline #PriceAction

Waiting for Pullback at Green Support GBP/USD Forex Update – Waiting for Pullback at Green Support 📈
GBP/USD is currently in an uptrend. One option is to wait for a pullback to the green support zone level, where buyers could step in and push the price back up again. 📊

$TSLA Short Trade – Breakdown in the Making “When pressure buil⚡🔻 💣📉
Tesla ( NASDAQ:TSLA ) is coiling tighter than ever inside this symmetrical triangle — but this isn’t strength… it’s stress.
With lower highs stacking and bulls running out of breath, the breakdown could hit like a spark in a lithium mine. ⚠️🔋
Is this just technicals? Or is the market doubting the Elon engine again? 🚗🧠
📌 Trade Setup:
Entry: $322.17
Target: $308.07
Stop-loss: $327.52
From breakout darling to breakdown candidate — Tesla’s chart is whispering a warning.
Will it hold… or will gravity take over? 🧲
#TSLA #ShortSetup #BearishChart #TeslaTrade #TradingViewSetup #ChartBreakdown #TechnicalAnalysis #OptionsPlay #ProfittoPath

What happens when war whispers... and Wall Street listens? 🦅🔥
"🌍 📉📈
Lockheed Martin ( NYSE:LMT ) just pierced through a tightening triangle 🔺— like a fighter jet breaking the sound barrier ✈️💥
Coincidence? 🤔 Or is this price action a signal of something brewing behind the scenes? 🕵️♂️
⚔️ Global tension is rising.
💰 Defense budgets are booming.
And NYSE:LMT ?
Quiet no more. 📢
🎯 Trade Setup:
📌 Entry: $470.50
📈 Target: $481+
🛑 Stop-loss: Below trendline
The chart speaks 📊. The world watches 🌐.
👁️🗨️ Are you paying attention?
#LMT #DefenseStocks #StockBreakout #WarTrade #TradingWithEdge #MarketMoves #Geopolitics #TradingViewSetup

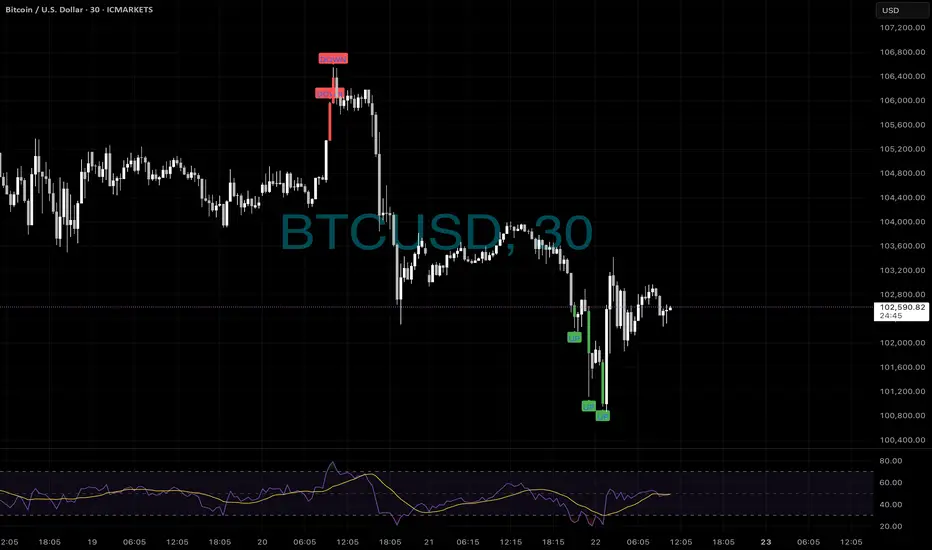
More BTC trades📊 BTCUSD 30m – Top AND Bottom Nailed with ELFIEDT
🔻 First, our system warned of a major top with double DOWN signals — just before the market dumped over 3,000 points.
🔼 Then, as panic set in, multiple UP signals printed near the low — before a clean reversal kicked in.
💡 This is the power of structured, data-backed reversals.
When price disconnects from value, and RSI confirms, our indicator steps in with laser precision.
🚫 No guessing.
🚫 No hype.
✅ Just consistently mapped turning points — visible in real-time.
🧠 If you’re still sitting on the sidelines or relying on lagging tools, it’s time to upgrade.
📲 Message us to get access and learn how to catch the turns, not chase the trends.
⸻
#BTCUSD #Bitcoin #CryptoReversals #ELFIEDT #RSIReversion #BTCSignals #CryptoTrading #BTC #TechnicalTrading #SmartEntries #TopAndBottom #NoLagJustEdge #ReversionStrategy #XReversion #BTC30min #CryptoEdge #TradingViewStrategies
Oil diggers?🚀💥 OIL-DIGGERS, where you at?!
WTI delivered a picture-perfect reversal off the ELFIEDT – X-REVERSION signal, printing a clean “UP” just before price launched over 300 ticks straight up!
This is what happens when you combine exhaustion, momentum shift, and smart signal logic — early entries, minimal risk, and maximum juice.
🎯 SL below the signal candle. No hesitation. Just execution.
🛢️ If you trade oil and didn’t catch this one… it’s time to add this tool to your chart.
#WTI #OilTrading #Reversion #ELFIEDT #SmartMoneyMoves #TradingViewScripts #TrendReversal #CrudeOil

TradingView Show: New Trade Ideas and The Leap TradeStationJoin us for a timely TradingView live stream with David Russell, Head of Global Market Strategy at TradeStation, as we break down the latest rebound in the markets and what it could mean for traders and investors. In this session, we’ll dive into:
- The upcoming Fed meeting and what policymakers might signal heading into the second half of the year
- Why the 10-year yield nearing 4.5% is important — and how to set alerts to stay ahead of key moves
- Summer trading strategies to navigate slower market conditions and spot emerging opportunities
- A closer look at Latin American equities, with names like Mercado Libre in focus
- The surprising strength in stocks that have doubled since the tariff-driven selloff
- How energy and oil markets are reacting to renewed geopolitical tensions in the Middle East
- And other trends that are shaping the broader investment landscape
Whether you're trading short-term setups or planning longer-term plays, this session will give you fresh insights and practical takeaways to help you stay prepared and informed through the summer months.
Bonus: Discover our latest broker integration update with TradeStation—now supporting equity options trading directly on TradingView. This upgrade brings advanced tools like the strategy builder, options chain sheet, and volatility analysis to your fingertips, making it easier to trade through uncertain market conditions.
This session is sponsored by TradeStation, whose vision is to provide the ultimate online trading platform for self-directed traders and investors across equities, equity index options, futures, and futures options markets. Equities, equity options, and commodity futures services are offered by TradeStation Securities Inc., member NYSE, FINRA, CME, and SIPC.
Disclosures from TradeStation:
tradestation.com/insights/etf-disclosures/
tradestation.com/important-information/
