US2y to stay below 1.500The chart patterns indicated that the US2Y yield is going to break and stay below 1.500.
The implications are that the spread (or difference) between US10Y minus US2Y is getting smaller. This, in turn, is suggesting reversion or a correction in US Indices towards the mean
You can see the initial chart pattern A, which led to the corresponding drop to point 1, and chart pattern B, which led to drop point 2
I think the US2Y will hold at 1.418 and then fall to 1.365 as the maximum potential drop
Search in ideas for "US2Y"

US2Y - FedFunds comes down to zeroUS2Y - FedFunds comes down to zero coincides with fed funds pausing, which is bullish for S&P


US2Y Treasury Yield vs Gold The correlation between the 2Y & gold indicates that when the US2Y peaks, there is a US recession & gold rallies to new highs subsequently after.
** 1 = Peak in US2Y ( 1989 ) did not see a rally in gold because gold was depegged from the USD in the mid 1970's.
2 = Peak in US2Y ( 2000 ) saw a massive rally in gold as investors look for a safe haven from the incoming recession.
3 = Peak in US2Y ( 2007 ) saw a massive rally in gold as investors look for a safe haven from the incoming recession.
4 = Peak in US2Y ( 2020 ) saw a massive rally in gold as investors look for a safe haven from the incoming recession.
Speculation
5? = Do we see a continuation of the opposite correlation between the US2Y & Gold when the US2Y peaks?
I believe so. However, I see two scenarios for gold if & when the US2Y peaks.
Scenario #1: Gold rallies to new highs after the peak in yields
Scenario #2 ( Base Case ): After peak in US2Y, Gold rallies to tests previous high & fails to make new highs.

US2YR Bond Yield Topping OutUS 2 Year Yield seems to have confirmed a reversal on the weekly which in turn seems to have given stocks and crypto some cause to rally. Too early to say yet if it will be sustained. Lets see if we get a continuation.

Expecting yields to take a breather soonAll goes down to CPI readings this Thursday but purely from a technical perspective, US2Y and US10Y are expected to cool down in the next few weeks from their current trading ranges that could go up to 1.4% and 2.1% respectively. If invalidated and they go higher into the coming week, expect more volatility and suffering for the stock market.
US2Y
US10Y

Tut Tut - US10Y-US2Y rises to highest in 3 yearsCurve Steepening is alive and well as the basis point difference between the US 10-year bonds and the US 2-year bonds reaches its highest level since 2017. This largely due to the Fed purchasing of shorter term bonds every month as part of its QE program to support the economy. Expect this trend to continue as the Fed maintains its support and refrains from purchasing longer dated bonds. However, should the Fed announce they are now going to purchase longer dated bonds, then a quick reversal is on the cards.

Same as the US2YT, I've decreased the upside potentialFor the same reason, I think the US30YT and the US2YT can be inverted at this level by -0.25% and no more can be done because of the high recession level incoming.
In next weeks this will happen, this summer in my point on view


US2Y - BUY (SELL BOND) strategy 3 hourly chart - regression The 2Y US yield has move lower and broken important yield level of 3.9650 area. The GAP lower 3.8500 currently, is providing an extremely oversold reading and other time frames are oversold as well but not as severe.
Strategy SELL BONDS @ 3.78-3.8350 yield and take profit with a 15 basis points toughly benefit. It does also support some US$ strength in coming sessions, is my personal view.


US2YR SFP M1With the 2YR printing a M1 SFP we can expect a sharp reversal on yields shortly - this may be confluence for the bias of a FED pivot and return to risk.

US10y vs FED rate. Should u put $ into bank or buy gold? 10/Jan/US2Y and 10Y bonds yields always “follow” FED rate paths. Now we “see” some “experts” encouraged us to “save” money into banks (especially USD denominated a.c) to gain higher rate. Hope to enjoy high fixed guaranteed return like early 1980s which was above 10%!!! Looking at those chart and gold price do you think “fixed deposits “ into bank is “worth” as investments?


2Yr Yield Set to Break HigherUS2yr yield looks like it was just having a temporary retrace before blasting higher. Looks set to break out which will be bearish for stonks.

US2Y with DXY - moving togetherSince the begining of the rise in 2 year yield, USD was following closely. However, USD did not follow rates to new high, but diverged instead. Note that the momentum in 2y yield is slowing, which could portend fall in interest rates in not very distant future, which could in turn hurt USD.


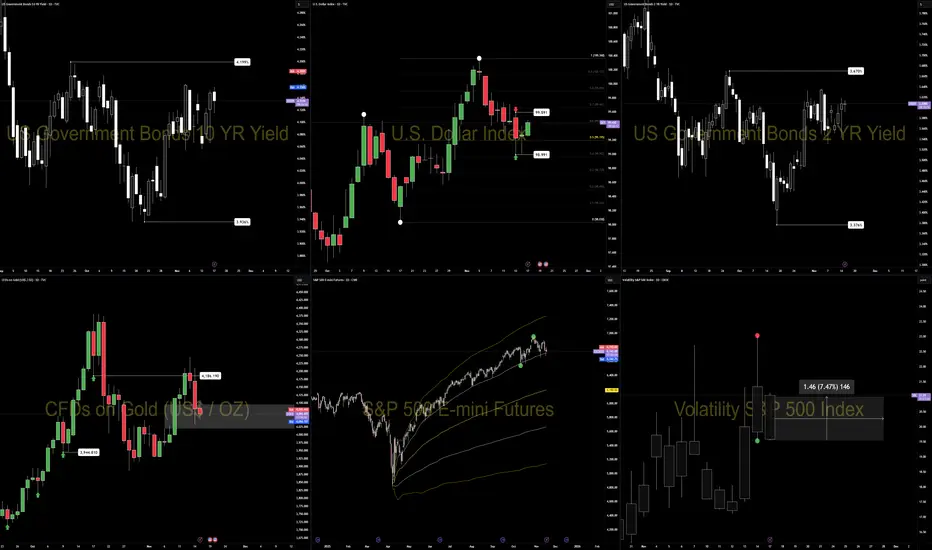
PRE-NY CONDITIONS — 17 November 2025New York inherits a defensive London session: steady Dollar, firm short-end yields, weaker equities, and rising volatility.
1. Market Environment (London → NY Transition)
Dollar:
DXY holds mid-range near 99.40. No shift in macro tone during London.
Yields:
US10Y near 4.15%, US2Y near 3.60%. Both stayed contained inside narrow ranges — policy tone unchanged.
Risk Tone:
ES weakened through London. Volatility elevated. Global tone remains cautious.
Liquidity:
Thinner into NY as VIX climbs and equities soften.
Quick Insight:
Stable 2Y = stable policy tone.
Rising VIX = cautious liquidity.
2. Six-Chart Snapshot (Operator View)
DXY:
Mid-range (98.991–99.981), inside-bar structure. No bias until a break.
US10Y:
Range-bound. Today’s move sits inside a 1.03% range.
US2Y:
Up 0.64% on low volume — quiet policy tone, data-waiting behavior.
ES:
Bearish through London with clear rotation lower into NY.
Gold:
Lower inside daily imbalance. Down 1.46% — weak safety demand.
VIX:
Up 7.47% — rising volatility regime.
3. Cross-Asset Signals
Yields:
Stable long-end + firm short-end → Dollar supported.
Equities:
ES weakness maintains defensive tone.
Gold:
Lower → no significant safety bid.
Volatility:
Higher VIX → cautious liquidity and reactive flows.
Global Risk:
Neutral-to-defensive.
4. Core Drivers for NY
• Dollar reaction inside the inside-bar range
• Short-end yield firmness (2Y)
• ES tone post-NY open
• VIX regime (expanding vs contained)
• Yield alignment (10Y + 2Y)
5. Execution Notes — CORE5 PEM
Follow higher-timeframe direction
Ignore noise from earlier sessions
Wait for structure + flow alignment
Act only on confirmation
One-Line Summary
NY opens into a defensive setup: steady Dollar, firm yields, weak equities, and rising volatility.
— CORE5DAN
Institutional Logic. Modern Technology. Real Freedom.
Alarm bells ringing on the 2's 5's curve...Recession is callingThis chart comes after a conversation with Citi... only 4 times in the past 30 years has the US 2's vs 5's curve inverted whilst being in an upward moving yield environment, via Fed QT.
We know from history a few lessons;
(1) Every other time this happened it ended badly for the global economy.
(2) A Fed that lags will only add fuel to the flames .. "it's different this time"...
(3) The longer the delayed reaction from Fed, the worst the blow in Equity markets. Assuming Fed moves in July (even with a more aggressive cutting profile e.g 50bps) it is still the 3rd longest delay over this time period. A 25bps is a 'done-deal' so should the Fed buckle and not move (very unlikely) it will mean that markets look at September which would then make this monetary policy 'delay' just marginally quicker than 2000/2001.
Best of luck those tracking for the end of the cycle... this chart will be one for the history books.

PRE-NY CONDITIONS Dollar is pressing into a major cross-asset high, recognized across FX, yields, and risk assets. London kept DXY inside a tight structure with no clean breakout, which turns this level into stop-time: the point where liquidity pauses and the market decides whether the move extends or fades.
Front-end yields remain firm, anchoring the Dollar’s support. The 10-year is indecisive, offering no confirmation and keeping the curve without a clear macro signal. ES holds its overnight gap on Nvidia strength, but volatility near 21 keeps risk fragile. Gold remains neutral, reflecting a balanced but uncertain safety tone into the U.S. session.
DXY: Testing a major high; range-bound after London; structure stretched but supported by 2Y strength.
US10Y: Indecisive daily structure; long end is not confirming Dollar strength; macro tone remains unclear.
US2Y: Firm short-end repricing; maintains policy pressure and supports Dollar tone.
ES: Holding gap; risk appetite supported but shallow; volatility still limiting follow-through.
Gold: Neutral safety tone; neither attracting nor rejecting flows; reflects cross-asset indecision.
VIX: Near 21; elevated volatility keeps conditions reactive and reduces trend reliability.
Cross-asset alignment remains mixed. The Dollar is firm, but only the front end confirms it. Long-end yields hesitate. ES shows controlled appetite, but volatility denies conviction. Gold confirms the indecision. Liquidity conditions lean cautious, shaped more by bond market signals than by clean macro drivers.
Pillar Focus: PEM — Confirmation Entries
Today's environment aligns with PEM logic. A stretched Dollar at a major level, split yields, and elevated volatility mean operators should rely on confirmation-based triggers, shorter engagements, and strict timing. High-frequency windows (NY open → 10:00 → London fix) carry more clarity than directional assumptions.
Follow higher-timeframe direction
Ignore noise from earlier sessions
Wait for structure + flow alignment
Act only on confirmation
Summary: NY opens into a cautious environment defined by a stretched Dollar, mixed yields, and elevated volatility — a clear PEM day.
— CORE5DAN
Institutional Logic. Modern Technology. Real Freedom.
