Bearish version of BTC drop, bottom $0 - $3500Hi tv
As opposite to my BTC version going at 300k based on Oil pattern this is bear version that should be fast... at least not another 1-2 bearish years or sideways.
I see BTC in downtrend channel and will not end correction until channel is breached and Ma50 breach on 4H chart or higher timeframes.
Cheers
Search in ideas for "Version"

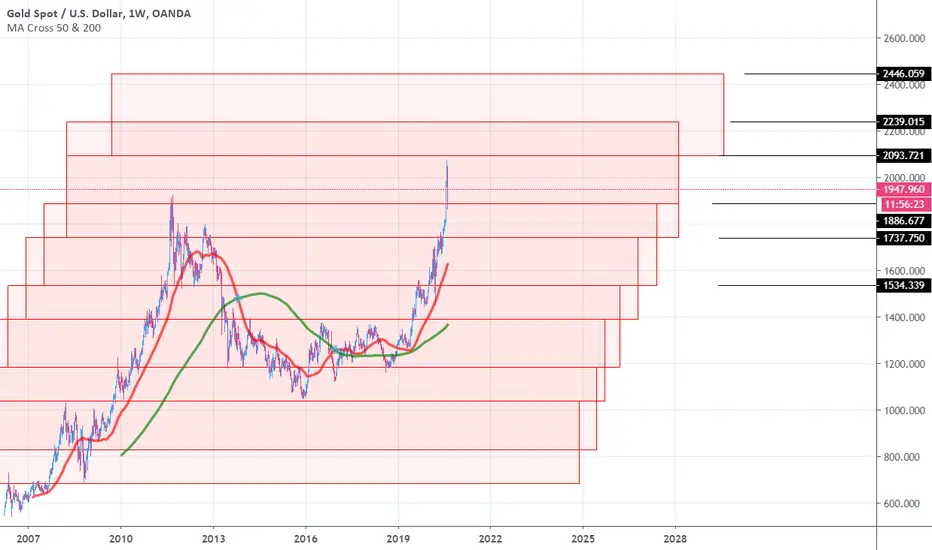
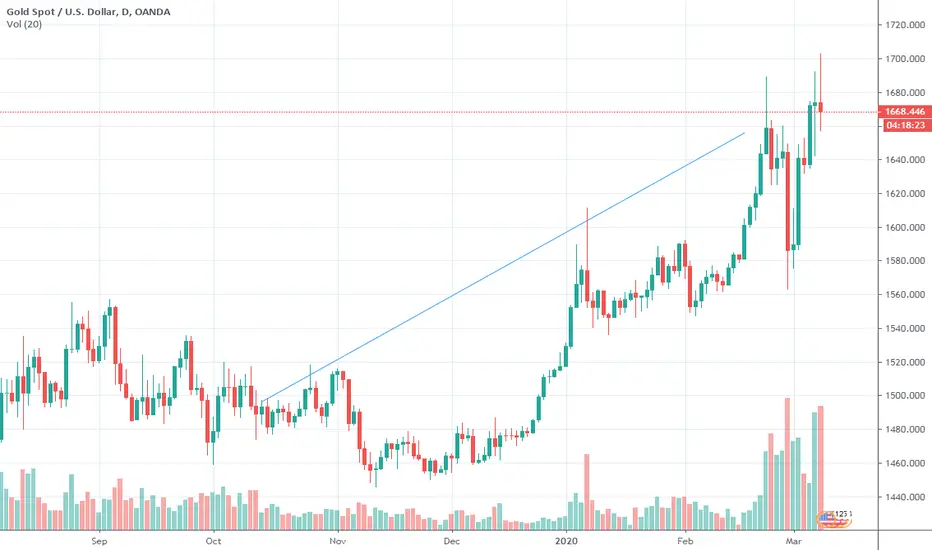
horizontal target version 2unlike version 1 which is acknowledged 1960 and 1660 and 1460
this version 2 not seeing 1660 as important one, so the case when 1960 ignored then go down 1860 area could happen again
so the scenario when breaking down from 1735-1760 area = targeting 1535-1560 area
if 1535-1560 breaking down will see 1360-1395 area
It is possible to use the Pro version of TradingView absolutely It is possible to use the Pro version of TradingView absolutely free for 30 days. After the time has expired, you can register a new account to another mail and again work in the professional version for 30 days. The only negative is that data from the previous account will not be transferred.
It is possible to use the Pro version of TradingView absolutely It is possible to use the Pro version of TradingView absolutely free for 30 days. After the time has expired, you can register a new account to another mail and again work in the professional version for 30 days. The only negative is that data from the previous account will not be transferred.
It is possible to use the Pro version of TradingView absolutely It is possible to use the Pro version of TradingView absolutely free for 30 days. After the time has expired, you can register a new account to another mail and again work in the professional version for 30 days. The only negative is that data from the previous account will not be transferred.

It is possible to use the Pro version of TradingView absolutely It is possible to use the Pro version of TradingView absolutely free for 30 days. After the time has expired, you can register a new account to another mail and again work in the professional version for 30 days. The only negative is that data from the previous account will not be transferred.
It is possible to use the Pro version of TradingView absolutely It is possible to use the Pro version of TradingView absolutely free for 30 days. After the time has expired, you can register a new account to another mail and again work in the professional version for 30 days. The only negative is that data from the previous account will not be transferred.
It is possible to use the Pro version of TradingView absolutely It is possible to use the Pro version of TradingView absolutely free for 30 days. After the time has expired, you can register a new account to another mail and again work in the professional version for 30 days. The only negative is that data from the previous account will not be transferred.
It is possible to use the Pro version of TradingView absolutely It is possible to use the Pro version of TradingView absolutely free for 30 days. After the time has expired, you can register a new account to another mail and again work in the professional version for 30 days. The only negative is that data from the previous account will not be transferred.
It is possible to use the Pro version of TradingView absolutely It is possible to use the Pro version of TradingView absolutely free for 30 days. After the time has expired, you can register a new account to another mail and again work in the professional version for 30 days. The only negative is that data from the previous account will not be transferred.
It is possible to use the Pro version of TradingView absolutely It is possible to use the Pro version of TradingView absolutely free for 30 days. After the time has expired, you can register a new account to another mail and again work in the professional version for 30 days. The only negative is that data from the previous account will not be transferred.
It is possible to use the Pro version of TradingView absolutely It is possible to use the Pro version of TradingView absolutely free for 30 days. After the time has expired, you can register a new account to another mail and again work in the professional version for 30 days. The only negative is that data from the previous account will not be transferred.
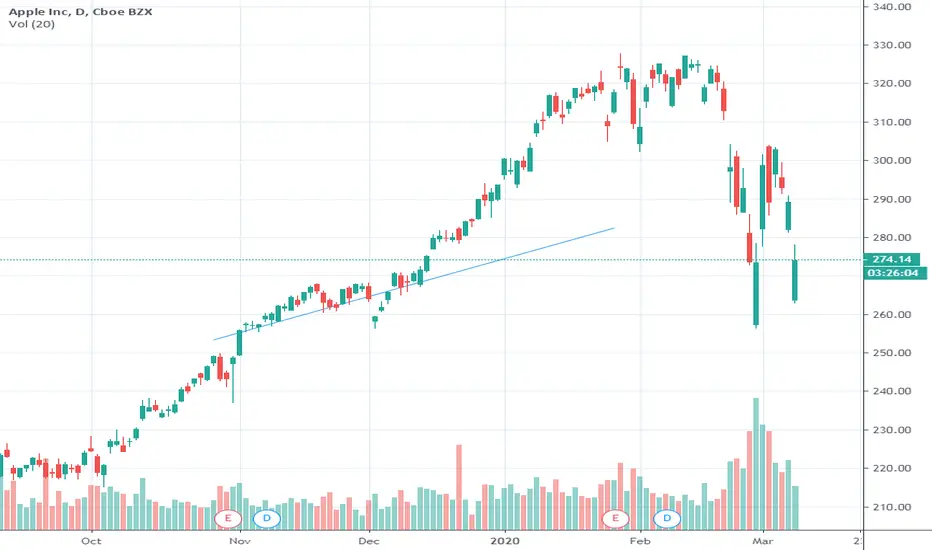
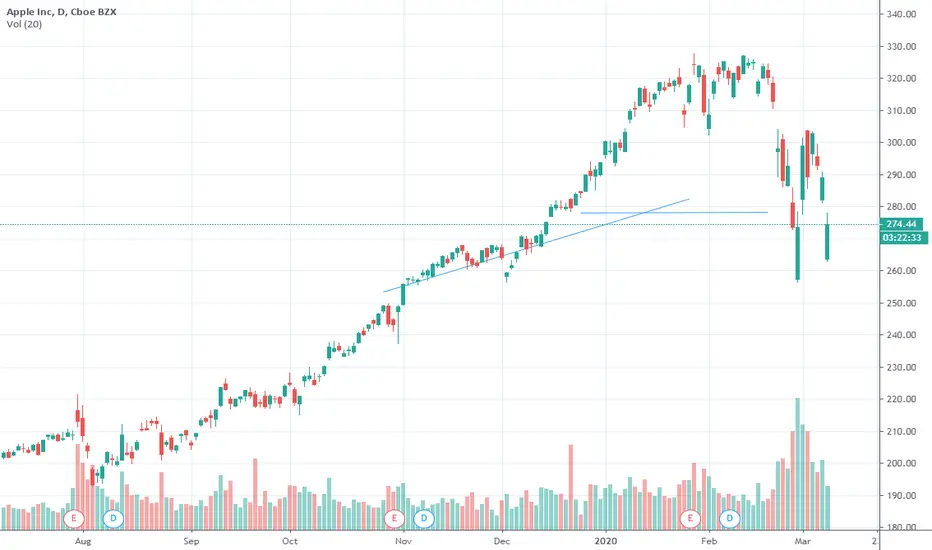
Modernized version of regression trend I've been studying price action for some time in an attempt to best make my market entries and improve my profit to loss ration
The lines you see are a revised version of the regression trend brought bout by ideas of Laurentiu Damir an Italian trader and the author of "Price Action Breakdown." I am not sponsored by him by any means but I highly encourage you to pick up his book! He takes his own version of the regression trend and breaks it down in terms of supply and demand. This idea has completely transformed the way I look at price and has given me an incredible tool to work with.
Orange High - Increased Supply
Orange Low - Increased Demand
Pink - "Fair Price" the price where price was most traded in the channel (or where buyers and sellers felt price was "fair")
Blue High - Price high of the channel
Blue Low - Price low of the channel
This understanding of supply and demand has given me a new definition of support and resistance and I have found this to work very well I conduction with my knowledge in harmonics, Elliot waves and previous price action knowledge. It has also allowed me to have a lower stop loss range understand where the supply and demand is within ranges.
The idea is simple: as supply increases (or moves towards the upper band between the orange and blue) I am in looking for sell opportunities or a break in the range if any of the resistance becomes pivotal resistance
Same idea on the low end: as price moves towards the lower band and demand increases I am looking for buy opportunity within the range of support.
*notice how I said zones*
Laurentiu's theory is to trade from one zone of supply or demand and trade to the fair price. However, I use this theory in conjunction with my own analysis and I trade to one zone of the other based on my chart structure and fib extension towards a major zone of support or resistance

TRON (TRX) 200% Short Term Trade (LOW RISK) - BETA VERSIONThis is a BETA VERSION meaning that this is a rough draft of what targets we have for TRON. We will be releasing full version of TRON chart within hours/days - please be patient as we get everything ready!
Members had early access to this trade and updates!
Invest only what you can afford to lose - we are not your financial advisors

iROC Pro [instantaneous Rate of Change Deluxe version]This updated version of iROC replaces the previous version which is labeled simply "calculus".
Thanks to Dr Richard P, Feynman . You might enjoy his classic 1961 Cal Tech lectures on Physics too, available for free on line.
Peace.
Tarzan

A new visual version of haOscillator, B-right side of the brainThis post is not a new trading idea.
I just want to show you a new and visually improved version of haOscillator indicator.
The script was editted and developed further by Pereira.Alex.
Please compare the second and the third panels. The calculation method is same for both, but as you see in the new version (second panel) we have a lot more colorful visual support, to help identify changes in momentum.
Very much "right brain" approach! :-)
Please remember, that neither haDelta, nor haOscillator can be used alone as a mechanical trading signal to enter long or short! They are important parts of the whole Heikin-Ashi concept, and are used as quantification tools!
Thanks a lot again for Alex for sharing his work with me!
By the way, it shooted a bit higher than I expected, but I still believ Oil will have to consolidate or pull back first before it makes next bullish leg, and moves a lot higher.

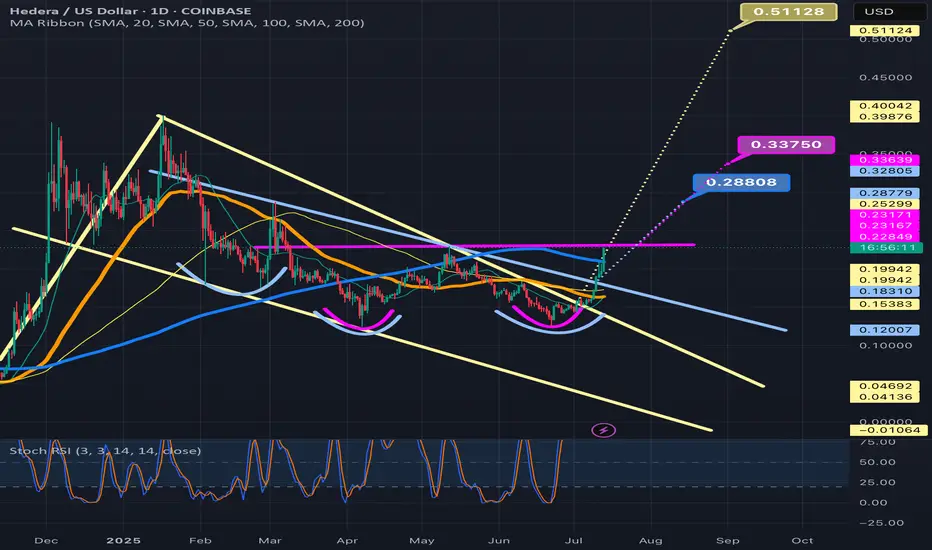
A linear Chart version of the current HBAR bull patternsIt just dawned on me that I had my chart on logarithmic for the previous 2 posts I amde about HBARUSD. As usual, the chart patterns on the log chart tend to have much higher breakout targets than the version of the chart patterns that appear on the linear chart. As soon as I realized this I went back in and adjusted the patterns to their linear chart erosions. The inverse head and shoulders remained mostly the same but the bullflag/desceding channel has now morphed into a falling wedge/bullish pennant. As you can see the breakout target for all 3 patterns is a much lower price than what the price targets were on the logarithmic chart. That’s not to say that the logarithmic targets are invalid, I think what will most likely occur Ike usually is both chart’s targets will be validated, it will likely just take much longer for the logarithmic chart’s targets to be reached as is how things usually pan out. *not financial advice*
Weekly timeframe version of previous HBARUSD postWanted to show my previous hbar idea which was on the daily time frame on the weekly as well so I could fit the pole of the bullflag in the frame here. I will put a link below to my daily time frame version of this post which goes into slight more detail about each pattern and also the Nvidia hbar news. *not financial advice*

Here’s the updated version with your additions: --- SpeculatiHere’s the updated version with your additions:
---
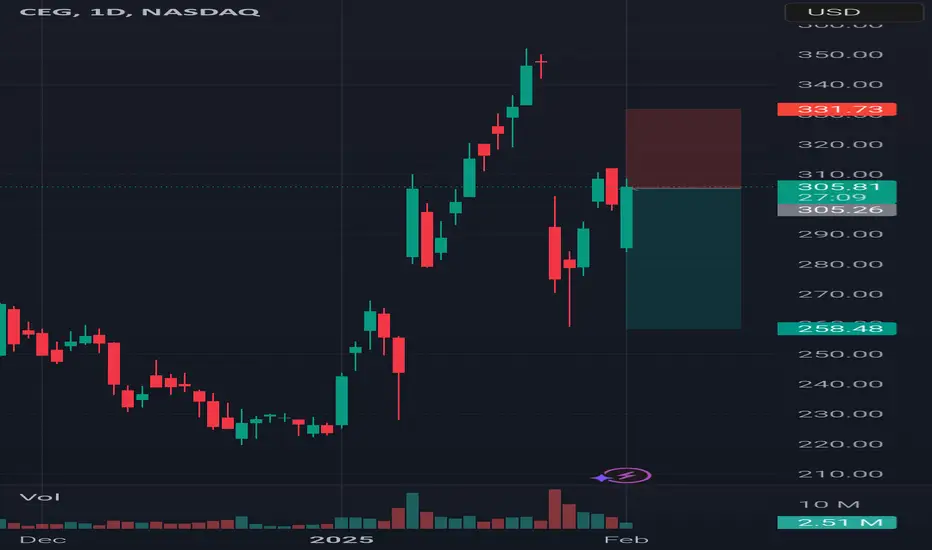
Speculative Madness: The Market’s Bubble Stocks
Some stocks aren't just overvalued—they're in full speculative bubble mode. Fundamentals? Irrelevant. When euphoria takes over, rationality disappears.
Here’s my list of bubble stocks that scream unsustainable pricing:
SBUX, T, PLTR, BMY, PYPL, NFLX, GS, ISRG, ARM, C, SHOP, BSX, SPOT, UBS, IBKR, RELX, CEG, CRWD, MSTR, MMM, DASH, COF...
And let’s not forget the obvious: TSLA, META, AMZN, AVGO, GOOGL, JPM, MA, V, WMT.
Honestly, the entire banking sector, brokers, and tech are in bubble territory.
What the hell is going on with this market? Why are algos just buying, buying, buying, squeezing all the shorts?! Unbelievable.
The dump will be insannnnnnnne!!! 🚨
XRP/USDT - (25-12-2024) G-Money's short version analysis based BTC/USDT 2H G-Money's short version analysis based purely on technical analysis only, no nonsense or "BS". I do totally ignore any fundamental analysis, technical analysis only
BTC/USDT - please pay an attention, It has a 2 take profit levels.
What do you think?
Chart is itself explaining. Kept a "KISS" approach all the way ( "Keep It Simple, Stupid") & beginners friendly... ;)
I do hope that nobody ignoring SL ( Stop Loss) ! Without it, It is a fastest way to loose hard earned money...
;)
Trade safe & don't do "gambling". In the end it never pays, not worth it to risk loose all your $...
PS: above technical analysis is done for the community & educational purpose only! It is not a financial advice. Just share my very own insight to it.
Merry Christmas to ALL !

BNB/USDT - (25-12-2024) G-Money's short version analysis basedBNB/USDT G-Money's short version analysis based purely on technical analysis only, no nonsense or "BS".
I do totally ignore any fundamental analysis, technical analysis only
BNB/USDT still possible that is going return to the Enter level ... It is not too late to enter at the right time...
What do you think? Comment and share your thoughts please!
Chart is itself explaining. Kept a "KISS" approach all the way ( "Keep It Simple, Stupid") & beginners friendly... ;)
I do hope that nobody ignoring SL ( Stop Loss) ! Without it, It is a fastest way to loose hard earned money...
PS: above technical analysis is done for the community & educational purpose only! It is not a financial advice. Just share my very own insight to it.
Merry Christmas to ALL !

DASH/USDT - (25-12-2024) G-Money's short version analysis basedDASH/USDT G-Money's short version analysis based purely on technical analysis only, no nonsense or "BS". I do totally ignore any fundamental analysis, technical analysis only
DASH/USDT still kinda on the "move" waiting for a signal to TP. Trade was open with 10X leverage & should bring *2 account size...Who did enter this trade congratulations! Who missed it... See you all next time! ;)
What do you think?
Chart is itself explaining. Kept a "KISS" approach all the way ( "Keep It Simple, Stupid") & beginners friendly... ;)
I do hope that nobody ignoring SL ( Stop Loss) ! Without it, It is a fastest way to loose hard earned money...
;)
Trade safe & don't do "gambling". In the end it never pays, not worth it to risk loose all your $...
PS: above technical analysis is done for the community & educational purpose only! It is not a financial advice. Just share my very own insight to it.
Merry Christmas to ALL !

XRP/USDT25-12-2024 G-Money's short version technical analysisXRP/USDT 2H G-Money's short version analysis based purely on technical analysis only, no nonsense or "BS". I do totally ignore any fundamental analysis, technical analysis only
XRP/USDT still kinda on the watchlist waiting for a signal to enter trade. Some early/partial entries are done as well already. Still waiting for crossing & closing candle over "entry" level...
What do you think?
Chart is itself explaining. Kept a "KISS" approach all the way ( "Keep It Simple, Stupid") & beginners friendly... ;)
I do hope that nobody ignoring SL ( Stop Loss) ! Without it, It is a fastest way to loose hard earned money...
;)
Trade safe & don't do "gambling". In the end it never pays, not worth it to risk loose all your $...
PS: above technical analysis is done for the community & educational purpose only! It is not a financial advice. Just share my very own insight to it.
This Technical analysis is my Christmas "Present" for You ! Merry Christmas to ALL !
