NQ Weekly Levels (Nov13-17)NQ had a big follow through week after the previous week's 6.42 % gain and finished up another 2.61%. NQ broke the downward trendline and closed above the Oct 12 pivot confirming a higher high. From a higher time frame perspective last weeks move also confirmed a successful retest of the Aug 16th high breakout point. The July 19th high is now in play.
Chop to be expecting until CPI comes on on Tuesday.
SUMMARY
NQ finished the week with a gain of 2.61% after trading in a range of 502 pts.
NQ had a strong follow through week closing above the Oct 12th pivot high and the MTF 618 Fib RT.
Price now above all key emas & the 200 SMA
NQ has made is first higher high since July.
Strong sector rotation back into XLK & XLC from XLU & XLE
Market pricing in a pause in rates due to a slowing economy.
10 Year yield down to 4.65 & VIX at 14.18
Higher time frame look confirms a successfull retest of the Aug 16th high breakout point
MTF 886 Fib RT at 16000 now in play.
First support is now at the MTF 618 Fib RT (15412).
First resistance in now at the MTF 786 RT (15776)
Econ data this week includes CPI and PPI + many Fed Heads speeches.
Search in ideas for "nq"

NQ/QQQ Weekly Levels & Trade Prep (May15-19)NQ finally broke above the multiweek range last week. Friday price action pulled back to the the break point so this week with either confirm or deny the break of range. Heavy week of Feb speakers ahead. Hawkish tone likely to bring market down. Dovish tone likely to push the market higher. Powell scheduled to speak on Friday.
SUMMARY
• Nasdaq posted a 0.45% gain last week after trading in a range of 290 points.
• NQ made the highest weekly close since Aug 8th
• NQ closed above the 9/21/55 emas & 200 sma.
• Strongest sectors to close the week were XLY & XLC. Weakest was XLE, XLB & XLF
• NQ closed above the recent range high
• Positive reaction to CPI data but neg reaction to Mich. Sentiment on Friday
• Key catalyst this week likely to come from comments by long list of Fed speakers
• Earnings this week include reports from WMT, TGT, BABA, TJX, DE, HD, CSCO, AMAT
• Bearish Harmonic still in play with completion at 13640.
• Sell in May psychological effect in play
• Market balancing hopes of a rate reversal with potential recession stagflation
WEEKLY EVENTS
Monday NY Manufacturing, Fed’s Bostic, Kashkari, Barken & Cook speak
Tuesday US Retail Sales, Can CPI, Industrial Prod. & Fed’s Bostic, Barr, Williams & Logan speak
Wednesday US Housing Starts, EIA Crude & Building Permits
Thursday Initial Jobless Claims, US Home Sales & Fed’s Logan, Barr & Jefferson speak
Friday Fed’s Williams, Bowman & Powell Speak
NOTABLE EARNINGS
Monday Nothing notable
Tuesday BIDU, DOCS, HD, IQ, SE
Wednesday CSCO, TCEHY, TGT, TJX, TTWO, ZTO
Thursday AMAT, BABA, BBWI, FLO, ROST, VIPS, WMT
Friday DE, FL
BULLISH NOTES
Highest weekly close since Aug 8th
NQ above 9/21/55 emas
50 SMA is above the 200 SMA
Bearish harmonic completion zone may act as magnet (13640)
Dropping inflation pressures
Recent bank failures may soften Fed’s hawkish tone
Potential positive reaction to Fed Speakers
Rate pause hopes
Potential strong retail numbers (lowers recession fear)
BEARISH NOTES
Stoch 5.1 is overbought
Potential hard reversal at bearish harmonic completion (13640)
Sell in May psychological effect
Potential negative reaction to Fed speakers
Service & wage inflation is persistent
Potential shock event (more bank failures)
Recession fears may outweigh Fed rate pause hopes

NQ's Channel is Back 10/8/2020NQ at the daily view.
Whelp, I told you that "Big Daddy Sunshine" is back. That's the channel that I named. I said NQ's downtrend was broken and we are heading back into an uptrend. I also said that we won't even close a day below 10800 any time soon. I get messages from permabears that the markets will crash at any time. Election volatility or some bad headline will crash the market by tomorrow. What they demonstrated is that they only accept data that matches their permabear bias. They ignored every other factor that runs counter to their perma-bias. Out of the 15 factors that I consider, 13 of them are leaning bullish. Now, the same permabears are definitely bagholders. Of course, the permabears would lie to me saying that their trades and accounts are doing fine.
Real traders do not care which direction that they profit from. Real traders know that they should trade based on what the market are now and not what they want it to be.
Here is a very big lesson in trading. There are 4 major factors in trading. By priority order, they are price action, internal market data (liquidity and breadth), market cycles (time), and sentiment (news). If your short positions are relying on the hope of a bad news and NOT on the first 3 factors, then you are already on the wrong side of the trade. Permabears mock hope or "hopium." Ironically, their short positions rely on the hope of some random bad news (also called gambling). You only short when all 3 factors favor shorting - not the other way around. Here's a good example. The President contracted COVID. The first 3 factors turned bullish. The news was bearish. Price action, internal data, and time will always triumph over news.
There should be a smaller pullback in the NQ before breaking out completely. If not, there should be some sort of backtest. If NQ closes a day above 11600, shorts will definitely cover. Liquidity is definitely rising - ridiculously fast. It's not the Federal Reserve doing that. We've known this for over a week now. Every dip will be bought until that prime factor changes. The IHS pattern may play out soon too. A right shoulder has formed and NQ definitely has a bull flag going on.

NQ: What's a "Resistance?" 8/26/2020NQ at the daily view.
A basic trading no-no is shorting a bubble. Bubbles can last longer and inflate larger than anyone's imagination. Calling a top is just purely gambling. A real trade is a calculated risk. Gambling is just ignoring all risk management and going based off emotion. Half of the battle in trading is risk management.
This morning, I read multiple posts from permabears shorting and re-shorting the NQ on the way up. Every single one of them was calling a top. What happened to them? It was like watching the Red Wedding from Game of Thrones.
The NQ can drop 1200 points and still be at an uptrend. The top of my channel didn't even stop the NQ. Though, I did project a VIX jump around August 26th. So, the NQ may pullback due to the VIX algorithms for all I know.
The amount of calls placed for tech stocks was insanely high today. So high that it broke the VXN's most recent wedge resistance.
How long can this last? Who knows. I don't know. I don't care to guess. I would rather wait for the NQ to pullback or correct first before diving in. Why? If I long now, I have no idea how much further it is. If I short now, I would very likely join the bear graveyard.

Requested NQ Levels - NQ Bias chartJust one of my charts requested by the two people who read. On the 4h time frame they DO NOT, and I'll repeat, DO NOT leave fair value gaps untested. The only one theyve left is from the August 5 Yen unwind, which was quite artificial. Anyway, not super bearish or bullish, just cautious at the moment. Risk reward for me plays out in a question that sounds like, "Do you want to risk -30% for another +10%?" or would you rather forgo the 10% and find something a bit more better value? Think that's how a lot of NQ stocks are being looked at end of year. Again not calling for a rug, but quite possible NQ lags the IWM for this next leg. We will see, anyway feel free to ask any questions the chart is a bit messy, like my brain.

NQ Weekly Levels (Feb26-Mar1)NQ and ES concluded the week in the green once again after testing the low of the recent range early in the shortened trading week for US markets. The NQ closed 1% off its (ATH), while the ES finished 0.56% off its ATH. The late-week recovery was fueled by another strong earnings report from NVDA, although big tech showed signs of weakness, closing out the week with most of the Mag 7 in the red on Friday as money rotated back into XLP, XLV, and XLB. Earnings season will wind down this week with reports from some big retailers, Canadian banks, and small-cap growth names. PCE data is on tap for Thursday, and the Fed heads will continue their speaking tour.
SUMMARY
NQ gained 1.35% las week after trading in a wide range of 771 pts.
NQ has now closed 3 weeks above the 2021 high
T1 = 1.618 Fib X (18118)
T2= 2.24 Fib X (18477)
S1 = 9 ema (17473)
S2 = 2021 high (17706)
Uptrend remains intact above the upward trendline.
Sector rotation last week from XLK, XLC & XLY to XLP, XLB & XLV.
Durable Goods & Consumer Confidence on Tues. PCE & Consumer Spending Thru. Manufacturing PMI on Friday.
Earnings this week include reports from U, ZM, LOW, M, MARA, CRM, SNOW, CELH, BBY & Canadian banks.
Elevated terrorist/war risk with escalaton of conflicts in the Middle East.
RSI 59.55 | VIX at 13.74 | 10 year 4.25%

NQ [ NASDAQ ] WEEKLY BREAK DOWNNQ Is Strong Bullish And Has Been Forming New Highs On Wednesday Till Friday, I Am Still Expecting The NQ To Still Form New Highs This Coming Week. From My Mechanical Analysis There's Probabilities That The NQ Will Make A Retracement To The "4H BISI" I Mention On The Charts, Then Continue Expanding Higher. I Am Expecting This Move To Happen Monday And Tuesday. If Price Fail To Retrace Back To The "4H BISI" I Am At least Expecting Price To Take Out The Last Week Friday New York Low, Since There Are Sell Stops Resting Below There. But The 4H BISI Makes More Sense Because I Am Also Expecting Price To Drop Down To Discount Level Below 50% Of The FIB. To Accumulate More Orders Before Offering The Buyside.
If NQ Fail To Hold The 4H BISI Then I Am Expecting The 4H Sell Side Liquidity To Be Swept, But More Logic I Will Get On Market Open On What Is Really The Price Is Likely To Go To. :)

A clear deviation between NQ and ES CME_MINI:NQ1! CME_MINI:ES1! We can see that the ES chart is weaker and more "bearish" than the NQ. That means in the next week open if ES breaks the checkpoint "1" we can easily see an ATH for NQ , because we have already broken the checkpoint "1" on NQ . So I think the direction and the sentiment of NQ are highly based on whether ES breaks above or bellow the checkpoint "1" . We should also wait to see where the weekly gap will open. Up or down the current weekly close.

NQ Nasdaq retraced all gains fr Mar2021 rally;1.272 (11k) next ?NQ gave back all gains from its Mar2021 rally & even broke its 12200 support. If NQ does not reclaim 12200 & hold 12k in the next few days, then the next strong support will be 11k.
16775 ATH is near the 2.618 Fib of 13950 to 12200(Mar2021 crash)
15k is around 1.618
13300 is at 0.618
After the Mar crash, NQ went to make ATH at 2.618, came back to 0.618 for the A wave, relief rally to 15k for the B wave, was rejected down to current price near 12k for the C wave.
If you zoom to lower time frames, NQ has formed a bearish flag & that measured move( blue line) may take it down to 11k.
12k to 11k would be a good accumulation zone. 11k is a strong support. It is also a 1.272 retracement of the Mar2021 rally to ATH so I think 11k will be the worst scenario for now. This will also be a triple bottom ending ABC correction.
Not trading advice

We may see NQ test the previous low and then riseWe may see NQ test the previous low and then rise
It is very likely that NQ will visit the previous lows and build on one of them and then we will see a strong rise to the nearest top

Scenarios Intraday for Nasdaq (NQ) - 7th October 2021Analysis of Options flow with our tools alongside with combining modified Pivots strategy (based on Volume and Options flow), would trigger to automatic set up Intraday Levels posted on chart. When combining it with VSA Sequences Scanner and Volume Zones (blue rectangles), it leads to have present x-ray picture (or simply a map) of instrument for Intraday Trading. Please find trading ideas marked on chart - beginning of arrow is trigger point and end of arrow points Take Profit level. When combining places marked on chart with dynamic results coming as signals from VSA Scanner, you would have complete Trading Suite at your hands :)
Coming back to situation on NQ - we're after nice Bullish Run. First possibilities to Shorting NQ are after passing Gamma 0.25 level at earliest. It's hard to predict when next Bullish moves can happen, but Gamma 0.5 is very strong Resistance Level so after passing it we can try to place Long Positions with Target on Extreme High of Day. NQ opened Overnight session relatively close to yesterday High, therefore I don't expect going as low to bottom Demand Zone (green box), but we need to be prepared for different scenarios.
Good luck!

What’s next for NQI am still following NQ closely. I find it most interesting of the instruments I trade right now.
You can see how NQ ended Friday at support. I exited my NQ position on Friday for an break even trade.
So what next? I have noticed in the past that when an instrument ends a week right at support or a resistance that chances are that it will gap up or down at the open. So I wouldn’t be surprised to see a big up or down gap. But we will see.
Short scenario
- if price goes below support this is a breakout (or breakdown). As I always say you can enter a sell trade on break of support for aggressive entry. But I will wait for confirmation of resistance before entry. This is safer way to go, but you also chance missing an entry if it doesn’t retest and just drops. But it is okay to miss a big move which happen sometimes. You can always look for other entry.
Long scenario
- if open show move up I will enter right away. Is this a aggressive entry or safe entry. I say it is a safe entry, because if price goes up then support is confirmed. It will retested support. But I will keep a close eye on an exit because we are in a general down trend.
You can see the profit targets and possible retraces for both long and short entries.
That’s it for now. Please drop me a comment and or give a thumbs up on me. I appreciate so much when people read my ideas.
I hope every one is a winner.
❤️ Ms Bunny

January 13, 2020 1245a CT NQ analysis1/13/21 1240a CT NQ analysis
I base most of my NQ trading on the 2 hour chart, using FIB arcs and the 200 ema (dark red). The white arrows designate important pivots for how the fib arcs are drawn. These 2 arcs have been in place since 1/8/21 and have not been adjusted. Notice how the .0786 arc from the 1/6 low is perfect resistance for the last 2 swing highs.
Also, note the red arrows pointing to 3 of the swing lows that tested the 200 ema. Note how the market rallied each time those were tested.
It required much work during today's volatility, but I have averaged my long NQ position down to the 12850s, looking for a test of all time highs and hopefully higher.

NQ's Flatter Channel 12/23/2020NQ at the daily.
It's been a while since I looked at the NQ chart. I cannot believe those trend lines are still working. Currently NQ is in an ascending wedge. However, NQ had many ascending wedges before. There are 9 supports before 11,000 can be touched. So a March 2020 crash is very much unlikely. Besides, if there is one lesson that I've learned in 2020, lockdowns tend to be bullish for tech stocks.
I've noticed that permabears keep repeating 1929. There is a huge difference between 1929 and today. That's the benefit of history. In 1929, the Federal Reserve didn't know what to do as it was only 16 years old at the time. In 1929, there was a great liquidity crisis. Meaning, there was a great lack of money supply. Available cash is the lifeblood of the stock market. Without it, the market tends to seize up. In October 2008, the Federal Reserve tried to inject liquidity into the markets, but it was already too late. Today, the Federal Reserve has the benefit of history. The Fed knows that liquidity needs to be injected early enough where the markets can recover. That's what happened in late March of 2020.
It worked. Since I come from the 2008 era, I didn't think it would work. Guess who feels stupid now? Me.
Nowadays, the Federal Reserve's repo operations have halted since July 2020. Treasury security operations have been reduced to near pre-March levels. Basically, since July 2020, the market has been largely on its own. After all, if you were part of the Federal Reserve, why would you waste your ammo when the markets are above the previous highs? It would probably make more sense if the market crashed more than 20% from the highs that the Fed would legitimately intervene.
What does this mean? It means that the rallies were not the Fed alone. In June 2020, there were over 600,000 new trading accounts for Q2. That's record-breaking actually. How many more accounts do you think opened since June? How many people do you think are waiting below at major supports?
I'm asking these questions because there is more to the market than the Federal Reserve.

NQ Trend Change 9/23/2020NQ at the daily view.
The NQ is forming a new downward channel . I was waiting to see if this is a dip or an actual trend change. From the looks of it, the downtrend is pretty much confirmed. Why is that?
1) Former uptrend channel is broken. Now, there is a solid resistance at the top of the new channel. However, I am not quite sure where the bottom of the channel is. That will be changing over time.
2) Liquidity levels are getting weak. For example, HYG (junk bonds) have broken its uptrend and key support on the same day. Corporate credit is now destabilizing.
3) Market breadth is at a downtrend or made some lower lows. That's NYAD and NAAD.
4) VXN is in an uptrend.
5) FOREX traders are running to safe haven assets (e.g. Japanese Yen).
6) DXY or dollar strength re-entered into its old 11-year-old channel again and in a RSI uptrend. The NQ is allergic to a stronger dollar.
7) Bonds are starting to breathe life again.
I didn't trade for nearly 2 weeks because of all the evidence I need to confirm a trend change. You don't trade purely based on gut feeling. You need to process data and multiple charts to make sense of the big picture. That's the difference between real traders and sports gamblers. Gamblers just trade based on feelings and then get hurt.
This is not a crash. This is a correction or downtrend. If this was a true crash, then no asset would be considered safe like what happened in March 2020. How far will it go? I don't know and I won't guess. I just take it one day at a time. That said, I do not see a black swan event that would recreate the March crash nor do I see the need for people to cash out quickly like they would in a disaster... or a pandemic.
This downtrend is pretty on par with election year volatility. Besides, Amazon, Apple, and Tesla are cult stocks. Even if you sold the NQ off, there will always be a group of fanatics.
I think the best quote I found today is "Tesla traders who are bagholders now identify as investors."

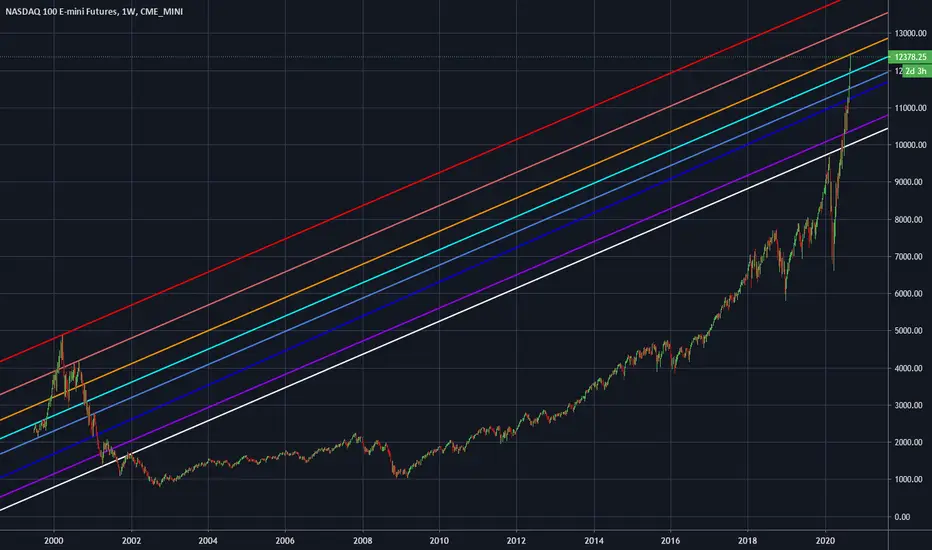
NQ - Dotcom Bubble's Channel Returns 9/2/2020NQ at the weekly view.
I refined my historical lines on the NQ. After find the angle of the Dotcom Bubble's old channel, I extended it to today.
I nearly spit my coffee when I saw how well these lines interacted with the price action at the daily view.
The NQ entered back into its old Dotcom Bubble trend lines. It's more like a fork or a channel. After looking at the price action, each line was where the NQ was struggling to get further up and then launched from that trend line.
If these lines hold up, then this 2020 NQ bubble is far from over. We might get a pullback, but I personally do not think we are anywhere near an actual top. So, my bias is at the long side after a bigger dip.
NQ Long (NDX, QQQ)NQ is showing the first signs of recovery from its recent decline. The overall decline and first day of recovery is structurally similar to the last pullback in April. Price has pushed through the bottom BB and is starting to bounce back inside. RSI has turned up on the daily after being pushed below the lower threshold which has only happened 3 times this year and price has bounced each time. Given that the latest PCE was on target, rate cuts appear to be within sight. For the period between now and when the first rate cut actually occurs, I think NQ will rally to the previously developing POC around 20,000.
The 20,000 level is also supported by a massive open interest for QQQ 496 calls (image linked below) which roughly works out to the 20k NQ level. The call wall should act as a progressively stronger magnet since MMs will buy the underlying to hedge their exposure. It will also act as a major resistance which is why my final scale out is a range to be adjusted as the trade progresses.
Risks
There is a lot of uncertainty at the moment, so these assumptions are based on macro data meeting forecasts and the remaining MAG7 earnings being neutral to favorable. If the remaining MAGs miss on earnings, then I expect a drop to around 18,500.
QQQ Open Interest
drive.google.com

NQ DROPPING ????? I THINK SO!!!!NQ failed to reach the C.E of the daily wick which is 50% and DXY is pushing higher to a liquidity void. NQ and ES should drop. I want to see NQ reach down and take that low at19728.00 and fill the rest of that BISI/FVG on daily chart. Going in to next week this is what i'm expecting and will be trading accordingly.

NQ Weekly Range (03-11-24)NQ contract roll week, M (June) contract is active. The Friday volume was the combined highest in weeks, on a down day. The prior O/N (low volume) Long play/props are highlighted in the attached chart and are now targets. The moves balance out, for your reference. The Chart is the March NQ, not NQ1 as this is off. We have 10 trading days until Fed day and we may see a lower move with typical Long Only Rocket up. This has been the typical knee jerk FOMO move. On March Chart below: 2 white arrows are U-Turn moves in or near the O/N (fake, low volume). These usually come back on retest just like Friday. The Fib Levels are the YTD range (Yellow Arrow). NAZ is near lower end of Channel, KL 17920-60 is what to watch. The point brackets (white / yellow) will account for value of drop offset (fake U-Turns) and the effects of. The brackets under Fib level 50% could have been the true NAZ position, without U-Turns. The current YTD range may play out until the end of 2nd quarter. The point is use these as downside targets, no drop keep buying the dip and FOMO forever. Friday volume was huge and on a down day, during the regular session and we need to see the results of the Monday reg session. This may be the pattern break that I have been looking for. I will update on Teams with intraday moves/calls and will leave this post open for TV followers (daily updates).
NQ H March Chart

NQ 1 HOUR SET UPNQ has been in a trading range for almost 2 weeks, today NQ may go search for 16025-16040 ( achored VWAP superior band). As always two ways the market can play ( may be a third one haha ), either we try to break ( be careful with fakeout, NQ specialty ) and fail which will lead to the market to retrace back down because of lack of liquidity and great presence of sellers; other way is we break above, wich is less likely looking to the positioning of the POC.
retracement to the POC will give us the conclusion that the market lacks liquidity to go up.

Weekly Plan NQ Futures Week Of 9-2409/25 Weekly Plan. NQ Futures December ESZ2023.
Weekly Pivot is 14,988
Targets
15,151 9/20 gap top
15,361 last week's vpoc
15,514 prior 5D balance half back
Targets
14,816 250% extension of 5D balance break down
14,628 300% extension of 5D balance break down
15,526 6/8 gap bottom
Now trading at 14,880 NQZ
Alerts
You will receive alerts in this channel every time NQ hits (2M candle close):
Weekly opening 14,880.
Weekly pivot at 14,98.
Each weekly target.
Side notes:
Prior day balance zone is H15,714, HB15,535, L15,352
When trading off weekly levels, each level will act as support and resistance, “no trade zones” do not apply to weekly plan.

NQ/QQQ Weekly Levels & Trade Prep (May1-5)NQ closed the week on a positve note finishing at the high of the 4 week range setting up a potential spike move into the 886 Fib before the FOMC rate decision on Wedneday. All recent moves have been reversed so watch for a clean break and follow through before any aggresive entries long.
SUMMARY
• Nasdaq posted a 1.91% gain last week after trading in a range of 524 points.
• Price reclaimed the 9 ema & remained above the 21/55 emas & 200 sma.
• Strongest sectors to close the week were XLC, XLK. Weakest was XLU
• NQ recent 4 week range is poised to finally break one way or the other
• Key catalyst this week will be the FOMC rate decision & commentary on the Wednesday
• This week’s earnings include reports from AAPL, LYFT, UBER, MRO, AMD, SEDG, COIN, BUD & PFE
• Bearish Harmonic still in play with completion at 13640.
• Still in a historically bullish period for stocks but talk will start about sell in May.
WEEKLY EVENTS
Monday US S&P Manufacturing PMI
Tuesday US Factory Orders & US JOLTS
Wednesday US ADP Employment Change, US S&P Serviced PMI, EIA Crude & FOMC Rate Decision
Thursday ECB Rate Statement, US Trade Balance & US Initial Jobless Claims
Friday US Unemployment Rate, US Non Farm Payrolls
NOTABLE EARNINGS
Monday ANET, CAR, DF, FANG, L, MGM, NXPI, SFM, SOFI, SYK,
Tuesday AMD, AME, BP, CHK, CMI, CZR, ECL, EIX, ETN, F, MAR, MPC, MTCH, PAYC, PFE, QSR, SBUX, SRPT, SYY, TAP, UBER, WU, XP, ZBH,
Wednesday ALB, ALL, CFLT, CTSH, CVS, EL, ETSY, FTS, GOLD, IR, KHC, MET, MRO, PSA, QCOM, QRVO, RUN, SEDG, TT, WING, YUM, Z
Thursday AAPL, AIG, BCE, BUD, CAH, CNQ, COIN, COP, DASH, DBX, DDOG, DKNG, ED, EXPE, FTNT, H, K, LYFT, MCHP, MRNA,
Friday DISH, ENB, FLR, JCI, NVO
BULLISH NOTES
NQ reclaimed 9 ema & held Feb 2nd high
Closed at 5 week high
Price above 9/21/55 ema and 200 SMA
50 SMA is above the 200 SMA
Harmonic completion zone at 13604 may act as magnet
Top of longer term Neutral zone within striking distance
Yields holding below 4%
Potential positive reaction to FOMC Meeting and Earnings
Historically bullish period for stocks
Earnings momentum led by AAPL
BEARISH NOTES
Potential double top at Mar 27th High
VIX is at 15.77 and due for a spike.
Stock 5,1 overbought
Potential negative reaction to FOMC and earnings (AAPL)
Momentum concentrated in a small number of stocks
Potential hard reversal at harmonic completion zone (13604)
Yields and the USD close to support and may reverse trend
Sell in May talk will begin

Nasdaq NQ QQQ - Reality Will Be a Tough Pill for PermabearsNo matter how much you read in the establishment media or in the narrative-controlled and socially engineered Twitter and Discord and Reddit forums about "recession" this and "bear market" that, the reality is that while some individual stocks have certainly been a bear market for well over a year, the indexes are not a bear market.
I made the call back at the beginning of November that the Nasdaq would head towards 14,000. The results were that it went up to 12,000 and came back near the lows, and three months has passed.
Nasdaq NQ - Unpopular Opinion #2,118: 14,000 is Coming
Price action is easy, timing is hard. That's the most significant thing I have enlightened to.
But here we are in February after a serious rally, and now that the post-FOMC pump has come and gone, the narrative has become "this is the top" and "the crash is coming."
However, just look at the weekly and monthly bars. This isn't bear market stuff.
Monthly
The literal last five months of Nasdaq futures has been a psychological operation against the COVID-June and COVID-October trendlines and the 2022 low of the year.
It's incredibly obvious on the weekly candles
Weekly
The most notable thing is that the end of the year did not breach the October low, and 2023 opened with a big bounce.
This tells us both that the low of the year isn't very likely to have transpired yet, and that we're still far away from a LOY unfolding.
Moreover, I've seen posts on Twitter that were tracking the SPX and the VIX against the 2008 GFC, 2002, and even the Dot Com bubble, and the January bullish divergence has thrown out all the prior price action to at least the 1970s crashes.
It's time for a revolution in our thinking.
What people don't understand or want to understand about the fundamentals is that when the fundamentals are bad, price is often bound to do what's contrary to expectations, and go up. So long as the market makers have time to work with, they will raise the prices and raise the prices for the purposes of selling YOU, retail dead money, the stocks they've held for a long time and bought more of at each successive low, at higher and higher prices in anticipation of the real crash.
The secondary effect this has is that while you're told by whoever it is that you're consciously or unconsciously taking orders from that the markets are about to crash BECAUSE RECESSION, FED FUNDS RATE, PROFIT/EARNINGS TOO HIGH, you're buying puts while it goes up. They expire worthless, you blow your account, and some Chad at JP Morgan goes for Happy Hour at 1:00 and wakes up under his car after a prostitute stole his Rolex.
Modern human life is total garbage. Return to tradition and find art and family again.
What's important about where we're at right now is that Nasdaq has finally retraced to its September CPI dump candle pivot, which it failed to breach, and looks to be setting up a double top after Friday's pullback.
In my opinion, we're about to get a very nice pullback that will serve as a simultaneous scare to shake out longs, and also a trap for permabears to leverage their entire accounts on puts and 1.5-3x short ETFs.
I'm specifically looking for a dump back under 12,000, which I believe is a long for price action that will take out the August highs by the end of March.
If you don't believe that Nasdaq can take out the August highs, then let me ask you a question: Why did the Dow, the most bearish of all indexes, take out the August highs in the middle of December?
In fact, the Dow as it stands is less than 10% away from setting a new all time high.
After what now amounts to 3 months of market action that isn't going lower combined with the Federal Reserve slowing its rate hikes, ask yourself why you think stocks should go down?
The truth is that the markets are going to crash. A terrifying market crash unlike the others has been arranged. But why do you think that the indexes either setting new highs, or doing a 76% retracement to the old highs, or setting a double top at the old highs, is out of the question before it unfolds?
Nobody has an answer to that, besides that they think it's out of the realm of possibility, for really no reason at all.
What you think can happen has nothing to do with what is actually happening, and this is the fatal flaw of an ordinary person, who only believes in what they can see while refusing to believe in what they cannot see.
Once the truth stands before your eyes, it's too late to profit. All you can do is feel regret that you missed the opportunity. Not so bad with the stock market, but when it comes to major things in life, there are no mulligans in the Cosmos.
Nasdaq to 14,500 by the end of March is my call. Buy the February dip if we get one and take profit over the old highs.
Red Communist China is the Blackest Swan
As always, you need to be careful in bullish market conditions, because an enormous black swan exists lingering in wait. That black swan is the Wuhan Pneumonia situation in mainland China as Xi Jinping and his Chinese Communist Party are on the verge of collapse.
The CCP claims that 85,000 people (~54/1 million on a population-adjusted basis) have died from COVID since the pandemic began. This is despite the virus being engineered there, patient zero being in Wuhan, and the country being the most populous in the world. For comparison's sake, the US has a quarter the population, but has lost 1.1 million people (3,000~/1 million) to COVID.
Even nearby Japan is posting 600 deaths per million people.
Is it really realistic to believe the Party has suffered a factor of 60 fewer losses than a country across the ocean?
And this is the same CCP that is a lying, murderous regime who has gone so far as to commit the unprecedented crime of organ harvesting during its persecution of Falun Gong.
The same CCP that covered up the 2003 SARS pandemic and made it seem to the outside world that barely anyone died.
The same CCP that every single human being who wants a future should be opposing with all of their might.
If you don't want a future, why are you trying to make money trading stocks? If you lose your future, can you spend your winnings and have a happy life?
It's up to you what you believe. An ordinary human has the flaw where they don't believe anything that isn't in front of their face, which is why they like to fall for the lies of establishment media and social media influencers.
The wise ones figure it out before the cards turn face up on the river and the dealer awards the pot, though. The fools get stacked and will lose more than just some casino chips.
