ANALYSIS NQmarket analysis NQ daily analysis to know the market trend of NQ
in the future analyzes will be uploaded "scalp trading" in the financial markets
Search in ideas for "nq"

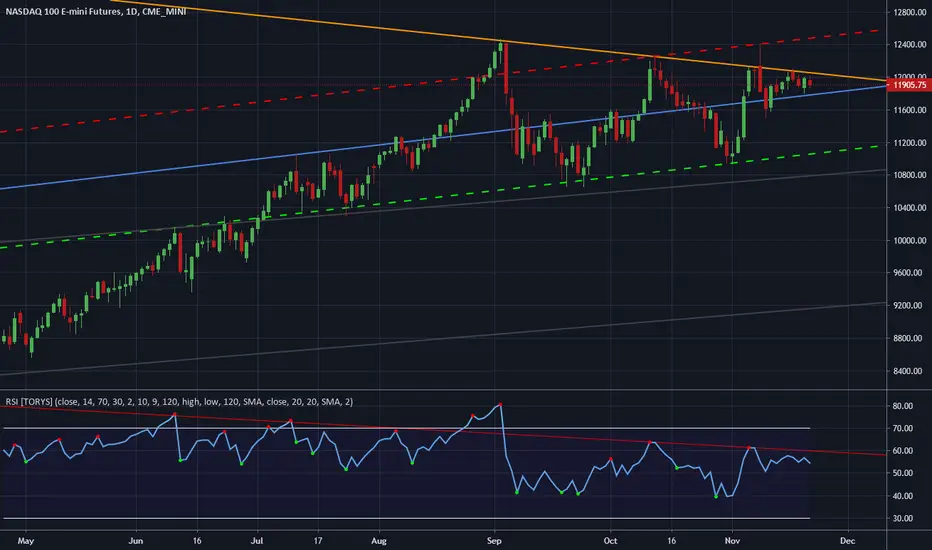
NQ - correction or turning bearish?NQ currently has an immediate resistance turned support at 12900.
Near term support zone is between 12750 - 12900.
12750 is where I marked D which is a confluence of:
1. the 100% fib projection of the previous correction from A to B (projected onto C)
2. the 50% fib retracement level of the BC mini swing up
As long as NQ does not go below 12750 (+/- 50), it is still within "normal" correction for now. No need to "panic" yet!
p/s all bullish bets off if NQ had a close below 12700
Disclaimer: Just my 2 cents and not a trade advice. Kindly do your own due diligence and trade according to your own risk tolerance and don't forget that money management is important! Take care and Good Luck!

We are ready to sell NQ, Let's do itWe are ready to sell NQ, Let's do it
We are in front of a beautiful situation for SELL NQ, a lot of money today

NQ MFI close to oversoldNQ MFI is very close to oversold on the daily chart.
Bond yields are rising, but NQ always bounces when daily MFI gets oversold. So something's gotta give, not sure which one.
I wouldn't bet against the daily NQ chart though. Plus a lot of tech stocks are also oversold on the daily, including NVDA

ES:NQ - Left BehindAlthough the ES made it to the implied Low ahead of the FOMC,
It has some catching up to do when this begins to turn.
The NQ is off 1.19%, the ES 0.36%.
________________________________________________________
The same applies to the YM, the RTY remains in synch with the NQ,
without Oil making a Pullback, BTC is struggling over 42K and
Memes are being clubbed again.
TNX is quietly sitting just below 1.716 with ZN appearing to hold
the Line again @ 129.040.
This is going to get wild soon, with VX quietly coming off the Lows.
The 711s are red, with JNJ and UNH the holdouts, TECH is seeing
increased Profit taking.
Appears it is unable to catch its breath, but the control over
the Selloff is extreme, a slow bleed takedown.

There may be a nice rise in the NQ in a few daysThere may be a nice rise in the NQ in a few days
NQ may witness a visit to one of the previous resistance areas and there may be a breach of the previous tops, but in both cases be careful because the previous resistance is very strong, which may make the price retreat a little and then break through the top

ES NQ YM etal...Well, that was exciting.
YM Busted down again.
ES failed to Confirm, but likely will next week.
NQ - Another Gap below to fill, not terribly bummed it
didn't fill, but Solid Profits on Large Positional SELL @ FR of PO.
It was interesting NQ had 3 - 609/611 - 621 - 640.
Closed 16/32 @ .500% (559s) - 16 Keepers for Monday.
We took 50 Handles x 48, more than good enough.
_______________________________________________
We are now back in the same position with respect to
Delta. They are attempting to generate a Chase in order
\to see if Retail will take the Bait.
Retail is so far in over their Heads they'll need to Sell Organs
to add further Leverage.
Therein lies the Problems for Wall Street, there is More to
gain Due South.
________________________________________________
Financials Closed roughly Flat on the Day.
DX/JPY is of deep concern...
Fat DUMP in front of us next few days - IMHO.
________________________________________________
Have a Spectacular Weekend Everyone.


VXN - NQ Volatility Weekly - Significant Falling WedgeWhen in doubt, Zoom Out has been suggested for as long as we have been trading.
Alexandra reminds me of this tried and true Axiom when Counter-Trends Develop.
Confirmation in the Weekly Time-Frame supports the BULLs, of this there can be
very little doubt, it is a large falling wedge of extreme range.
It looks terrible for the SELL.
And yet we saw 1343 Ticks come off the NQ within the downtrend, barely a blip
to the Upper Trend Line only to fail again.
A ~6% move down in NQ generated a 50% move in VXN.
Institutions/Funds profited from their Put buying Spree as Implied Volatility
had been crushed again. Step and repeat... same as it has been for a long time.
There are always anomalies in Weighted Indexes - TSLA by example was falling down
the mountain and kissing dirt... BUT... implied VX in TSLA was rising quickly as PUT
Buyers began to double down, triple down, and begin a degenerative campaign against
the Heavy Weights who hold Tesla. Tesla is a Protected entity and has a decidedly large
weighting within its Index.
For 12 straight days, Put Buyers were smoked, used as lighter fluid for a relenting grind
higher and higher.
Anomalies occur, the Heavy Weights always catch the Bid to prop, and when there's fuel
a match is merely a few feet away. Once again the Tesla Dumpster Fire was put out
with Gasoline.
With the VXN feeling the Crush, having broken 23.52, 22.12, 21.32, 20, and 19.73, then
18.60. It's a beat down that only the Chevchenko's can deliver.
So where is the Lower Boundary, we'll know as we head into EPS and VX Settle.
More importantly, where is the UPPER BIoundary as it serves to provide indications as
to whether 4/5's completion ends there or an Overthrow of this Weekly Trendline can
occur, signaling much larger issues ahead as 5/5 completes.
We shall see, it will take a monumental effort to keep this in check as Yields are quite
clearly a threat to the TECH Complex. There are a large number of Additional Threats
beyond Yields.
We are entering a cautionary period for TECH, as we maintain it will fail.
By all appearances, one would expect the exact opposite, and there is the challenge.
Trade safe~!
- HK

NQ - 4 Hr @ .618 of 15399 - 14367NQ's longer-term indicators remain Bearish, they were steadily weakening.
For now, they have some relief as they are pausing on the Daily TF, although
they remain extremely Negative. The Divergences are no longer active, they
have been resolved by Price.
This is not to suggest, Price is out of danger, it is not.
We have an important Macro Data Point on Friday - The Jobs Report. It will
either provide cover for the FED to announce the Taper or imbue the herd
to gamble.
Next week will be more important as the Tribulation of Inflation Data will be
on... CPI for September, FOMC Minutes - Wednesday.
PPI - Thursday
Retail Sales - Friday
And assorted FED Bullhorns this week and next speaking every day will
toss salads.
This brings us back to Price, which continues to widen. The ST Algos have
been using the oversold conditions to move Price higher.
Unfortunately, the Range Expands significantly under these conditions and
with it, Volatility expands as well.
Today's Range was a solid example - 348 Ticks of Range.
We see the NQ closed the 4Hr slightly above the -618.
There remains a large Daily Gap overhead, well over 15000.
We are looking for Rejection... where is now a question mark.
Piling on the Fundamental Macro Issues - Stop Gap, Budget, China DEBT Crisis,
Spending, and Evictions (Silence there in MSM) - while Inflation concerns have
disrupted the Equities Complex.
How this unfolds will come to pass over the next 5 trading days, we are closing this
week with prior Weekly close at...
One Guess where...
Where we closed today @ 14761.75 - it's high... the Primary Ledge @ 15399.50.
This implies the NQ range is now 1,032 Ticks.
Patience, in the extreme, is required as Price can move about this Range in the
Short Tern.
We can see the .500 @ 14881, the -.382 @ 15003 Week over Week. During the Roll
and Settlement for the VIX, we can see the Gap Fill ahead of this event @ 19.20.
The VIX closed the day @ 21.00, the 22.15 Level was crushed as it closed 250
Ticks off the Highs @ 23.50.
They are simply attempting to remove as much VX thru ARB/Retail as possible.
Yesterday's Retail Put Buyers we hosed again today, the majority did not close
as Price began to advance prior to the open.
They became fuel as we indicated.
With a great many events and data points unfolding over the coming 5 trading days...
Guessing isn't an option, gut feel... maybe.
Moving averages are all over the place, but remain aligned on the Longer Term TFs.
ST MA's can provide indications for a move higher.
Observing between the DOW and S&P is wild... they don't appear to be closely aligned.
Pitchforks show the Mid Point potential of being overthrown. Again, it's - wait and see.
To me, it appears we are heading higher to make a lower low.
At present there are different patterns that can now form, everything remains
fluid and being nimble, being open-minded and above all patient.. this will prevent
traders from being harmed.
Many of my signals indicate a far larger drop is ahead.
How we get there and where it begins... is developing.
We managed to enjoy a solid selloff from 15708 to 14367 or 1341 Ticks.
For now, we'll digest those gains and avoid losses. Giving back Capital after solid gains
is difficult for most to overcome, they tend to overtrade.
This is a time we will be observing, not trading until we see more Price Information presented.
- HK

VXN - NQ Volatility / 30 Day VX Expectations - ES YM RTYWe see how important the Ledge remains.
We traded Support first thing this morning, this
is where and when we Closed our NQ SELLs.
The balance of the Day was SOH.
The intent is clear, the Hourly was over-sold, the Weekly
remains deadly.
These are enormous ranges and again, IF there is not a
high probability setup with a clearly defined trade plan.
9/10 its a loser.
NQ did exactly as indicated within the Range.
The ES, although the Range expanded to 4140 (200SMA) to 4388,
it did dip in @ the Upper Trend Line by a few Ticks.
The VIX gave up the Ghost, as indicated there is a serious effort
to keep it under control AND we have 10 trading days to Roll/Settlement.
This is the sweet spot for Counter Trends to develop.
YM / RTY - exact same trades... RTY is always used to park $ as it is easy
to manipulate due to its weightings.
We suggested this CT would evolve and patience was required as it can
trade up to the Ledge, a Gap Fill, remains possible, but not probable.
Were the Indices to Fill their overhead Gaps, it would imply a longer
correction duration... this is why patience is so very important.
It is best to permit the Trade to come to you as opposed to chasing it.
This generally ends badly for most traders.
There is far more Downside to come as the 200SMAs are wide open now.
Observe where the 21/34/50EMAs are, know these levels, they are extreme
in importance and the Algo's always using them for Fills.
We have 2 competing BOTs, one - short term duration - and the other attempting
larger fills on Daily Time Frames, when they are not competing, as we have observed,
the ST ALGO runs the Range until the DT ALGO gets its Fill.

VXN - NQ VolatilityNasdaq continue to ride the 2010-2011 Peak's Upper Trend Line.
VXN's range is disturbing as it broke the 19 level. 13s are now open
for a potential blowoff.
Banging its head repeatedly, it has been difficult to ease into a
SELL position that can be held... new highs, larger negative divergences.
Straddling the Upper Boundary on the Weekly chart remains the trade
for NQ.
It has lost all momentum, making a lower low in trend - only to reverse
and make new ATHs.
Semiconductors were the leader for NQ - MU AMD INTC NVDA AMAT AVGO
TXN QCOM ASML TSM all had large CALL BUYING to wreck the NQ Sellers.
SOXS holders as well, a large destruction of Price to new lows.
The RANGE is extreme, the Upper Trend Line now 10 years in uptrend,
remains the Sell Off Level.
Position - 0

ES - Channel Surfing 2hr - NQ YM RTY SOXS TQQQ TLT ZN ZB ARKKFriday's WRR was symptomatic of how the Order Book and Market @ depth can be
rung like a Bell - Every stop was smoked.
We held 493s @ 12 after peeling off the same ahead of Thursday. A solid and comfortable
buffer of 8 Handles giving us a 501 B/E - Stop was 96, the reaction level and prior PO.
Wrecked in minutes, All positions took the poker, hot.
NQ was the leader into Thursday close, making a lower low on the Hourly, while finishing
Friday @ new ATHs. The only trade taken in NQ was the initial higher high @ 428 to 390 on
80 MNQ scaled in from 426. This Sell became the fuel for the next stop run higher. Retail
Traders entered and reentered the Sell all day only to be crushed under the Futures bid.
The Semis bid took SOXS to new lows, ending our position on Stop - our largest loser in
17 months.
TQQQ stopped .38 below entry. TLT ZN ZB closed @ 0.12%+ ARKK Stopped at ~ Entry and on
and on it goes... stop stop stop run. 1st losing day in 17 days and a large loss on SMH's.
______________________________________________________________________________
ES Chart illustrates the higher targets - and lower 4441/4444 Support - 80 Handle range.
What it does not show is the following - Market on Close orders were followed on in
Globex - the Sell imbalances... were immense.
Perhaps those in the know, knew the Drone Strike retaliation was on Deck.
It is clear we are in a Large topping process, with stop run after stop run the tool in trade.
Where this terminates now is a WAG.
The very moment everything lines up in a large SELL, the rescue operation doubles down
and makes New ATHs on expanding divergences.
Frustrating in the extreme as it requires very large drawdowns, unacceptable drawdowns
on Capital.
Hedging DEC SELLs with SEP Bids Intra-Day has worked, although the Risks in continuing this
balance is so extreme, we are going to remain in CASH with an extreme negative position
structure.

QQQs @ 386 and NQ Equivalent Highs aheadThe Chart illustrates both the potential Target for the QQQs high from a positive Draw
as well as the convergence from the Negative draw.
Where would this leave the NQ?
15,755 ~
Something to consider as the prior Squeeze ahead of the Algo's level for Sell Scale to
Open began a 500 point vertical move @ 4:02PM EST.
It created the largest Gap and Trap in Globex History.
And it promptly sold off off that evening and into the following session and continued
down significantly.
History will repeat, this is my sell level for NQ/MNQ - We will be scaling in from 15,500
to the target.

Still obssessed with NQI am a little late in posting this. I have been not posting as much the last week as work has been real busy. My idea was to retire in a year now from nursing. When my trading money equaled my yearly nursing salary I was going to retire. This would be next year. But now I have been asked to be promoted to head nurse of my whole hospital, which comes with big pay raise. So now I have a couple more years to work until my trading money is equal to my new pay. So I hope I don't get promoted again! LOL
This is a little late. But I had a supply zone marked in grey rectlangle. I was out of the market for most part last week, because I was waiting for NQ to hit this supply. when it was kept consolidating right below this I though it was headed for a big drop if it touch supply. today it finally did this. And now it is dropping pretty quick. I am not to get my hopes up yet, but so far so good. My target right now is sell 1/2 at 13414 if it makes it. If it looks like it is to stall I will take some profit earlier, and move my stop to breakeven. Then I will let it run. This trade is for me is probably going to be breakeven, or very big. don't know which yet. NQ will let let me know.
Good luck trading!
I hope you all the best :)
I will post more charts with triggers this week. Hopeful that work will be less crazy soon.
<3 Ms. Bunny

Now what after a nice big win on NQ?I hope you catch the big quick drop on NQ with my last idea. I also hope you exited fast before the rebound. I got out almost at the bottom. I got out after the Doji formed at the bottom. I didn’t stick around for confirmation and just took my money and run!
Now NQ back up and consolidating. You can see my short and long set up. We are looking at descending triangle which books say often leads to further downtrend. My experience tells me it is 50/50 chance either way. All I know for sure is price will break out through the hypotenuse (resistance) or it will break down below the leg of triangle (support). So be patient, wait for confirmation of breakout before you enter my position. Or if you are aggressive just enter at first sight of candle break through. Both ways have good points and bad points. Personally I like to do it both ways, but it depends on what I am looking at to.
Safe trading. Please thumbs up me if you like this.
♥️ Ms. Bunny

ES and NQ MFI OverboughtBoth ES and NQ MFI went overbought, that is a a sell signal, but I already told you guys not to hold long positions overnight yesterday...
NQ chart is almost identical, so not posting it.

NQ Transition 11/20/20NQ at the daily.
The NQ transitioned into a new price structure. However, the structure is still pretty vague compared to the last trend. For now, the NQ seems to be trapped in a wedge .
There is a definite rotation between tech and non-tech sectors. Investors remain overall bullish in tech and bearish in non-tech. As a result, non-tech sectors like financials and energy were overly shorted. Eventually, if there enough shorts piled up, the price tends to snap back in the other direction. Currently, short interest is still pretty high in non-tech sectors. With a lot of trapped shorts, selloffs in non-tech sectors will be hard to maintain.
Why is there a shift? Well, look at it simply. Why pay overly priced tech stocks when you can buy bank or industrial stocks at a discount? It's not like banks or industrial companies are just going to disappear all together. Investors know that the stocks will recover eventually. They are called cyclical stocks for a reason. The best time to buy is right after a big crash - historically speaking.
What does it mean? The tech sector's rapid growth will remain muted unless 1) the rotation ends completely which may last a while and in waves. Or 2) There is a nationwide lockdown again. Some states, yes. All states, not probable at all. Why? Different industries cannot afford a lockdown. Tech can adapt to a lockdown. Industrial/manufacturing cannot. Some states have manufacturing as their economy. To a blue collar worker or small business owner, what difference does it make between catching the virus (possible death) or be locked down and starve to death? I ask that because my family is primarily made of those two. Quite frankly, people are getting tired of hearing about the virus anyways. The top concern? Feeding their families in the middle of this recession.

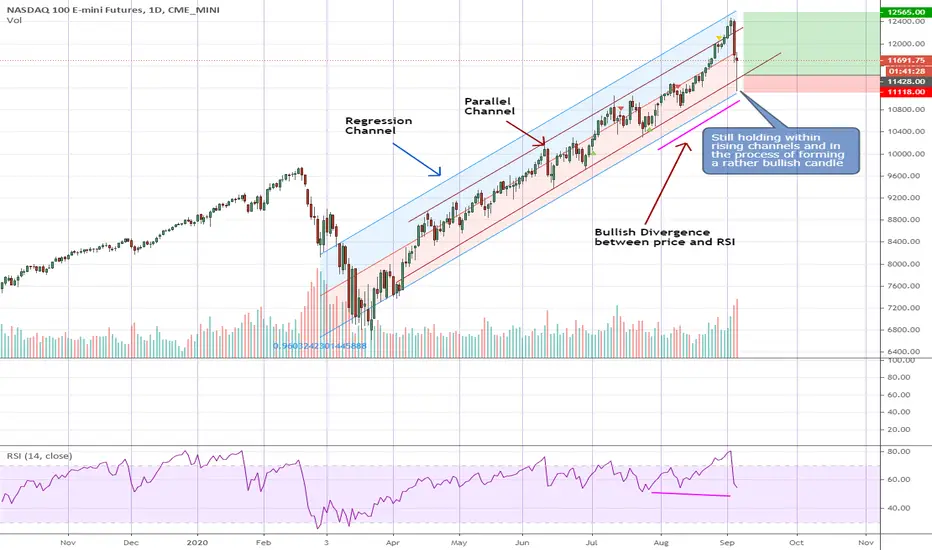
NQ - still looking like a correction (abeit a fierce one)NQ was going parabolic and pierced above a significant parallel channel for 2 days - helped no doubt by both TSLA's and AAPL's stock split which for some reason invoked plenty of bullishness. Perhaps the big boys were patiently waiting for the last bull to get on board before the shakeout began.
In just 2 days, NQ gave back a whopping 3 weeks of gain! The attack was swift, hitting into the lower part of the Regression Channel support this morning (it appears both the BB bears and bulls were watching this same Channel..?) before the bears started covering and the bulls started to dip their toes in..
The trend is still up as of now and the candlestick that is forming now is telling that the bulls are now back in control. We could have more volatility over the next few days but as long as NQ stays within the rising channel, then the bigger trend is still intact.
Disclaimer: This is just my own analysis and opinion for discussion and is not a trade advice. Kindly do your own due diligence and trade according to your own risk tolerance. Thank you.
NQ Update 9/3/2020NQ at the daily view.
The solid colored lines came from the Dotcom Bubble's trend lines or channel... whatever you call it. This was why I was amazed how well the lines from 2000 correlated to today. It's mind boggling.
NQ was obviously way over extended. However, it's foolish to short the NQ and time a top. The tech sector is infamous to completely ignore P/E ratio and most trading rules.
Why does it apply to today? Well, it's a combination of FOMO and TINA (There Is No Alternative). Bond rates are low. Saving rates are low and increased inflation eats up the purchasing power. Real estate is very expensive nowadays. To the average person, where do they park their money? Well, the only obvious place left is the stock market. Big tech is viewed by the average person as some sort of "safe haven" for their cash... which is ironic actually.
Still waiting this correction to be over so I can buy the future bounce. As you may see, we are no where near the bottom of the channel. Will it be a collapse? Highly unlikely. Internal data doesn't support a collapse. Since the upward channel is intact, the trend is still up.

NQ's Top is Here... For Now 7/24/2020NQ at the 4 hour view.
The NQ has reached a top since July 13th. July 13th is a key reversal day. It is THE top? I don't know. However, this will likely be the top for the rest of the summer.
Institutions are taking advantage of the tech hype and selling tech shares - while new traders and Robinhooders chase the tech hype. Robinhooders got the alert to go long on tech. Institutions get that same alert too.
Am I going to judge them? No, because I use the same strategy too. What is saving the NQ at this point is high liquidity in the markets and A LOT of trapped bears waiting to cover their shorts below.
We got 4 big tech companies from FATMANG (Facebook, Amazon, etc) reporting next week. I'm totally expecting a hype rally for pre-earnings. Now comes the question that I've been asking. What will happen to tech stocks if the expectation was very, very high? Sure, Microsoft and Tesla beat earnings, but the expectation was lowered. So, we have a Catch-22. The official expectations were lowered, but retail traders' expectations are much higher.
What do you think will happen? I'm going right back to cash before any one of them reports their earnings.
