$SPY Bullish Breakout: Cup & Handle Formation on Weekly Chart The AMEX:SPY is exhibiting a compelling technical formation on its weekly chart. A classic cup and handle pattern has emerged, signalling a potential bullish breakout.
The cup and handle pattern observed over the past several months on the AMEX:SPY not only signals a bullish continuation following a period of consolidation but also aligns with the current Stochastic Oscillator readings below 70, emphasizing the potential for upward movement without immediate overextension. This formation, marked by a stabilizing rounding bottom and a subsequent minor pullback, reflects a growing bullish momentum, further reinforced by the Stochastic Oscillator's position, which adds confidence in the face of the ongoing market volatility.
Based on this analysis, a tactical trade can be structured as follows:
Entry Point: Consider entering the trade at the current level, as the price breaks out of the handle.
Stop Loss: To manage risk effectively, set a stop loss at the low of the handle. This placement protects against unforeseen reversals in the pattern.
Take Profit: The take profit target is set at the high of the cup. This offers an attractive near 2:1 profit-to-loss ratio, aligning with sound risk-reward principles.
Risk Management: As always, traders should align this trade with their individual risk tolerance and portfolio strategy.
This analysis presents a bullish case for AMEX:SPY , supported by both pattern recognition and oscillator readings. While the setup is promising, traders are reminded to conduct their analysis and consider market dynamics.
Disclaimer:
This idea is for educational purposes only and should not be taken as financial advice. Trading involves risks, and it is crucial to do your due diligence before making any investment decisions.
Search in ideas for "stochastic"

$GOLD miner ETF a break of descending bear
channel downtrend
suggests move higher to
overhead resistance at 29.00
Stochastics divergence on
recent low suggests $gold
minders ETF should
move higher

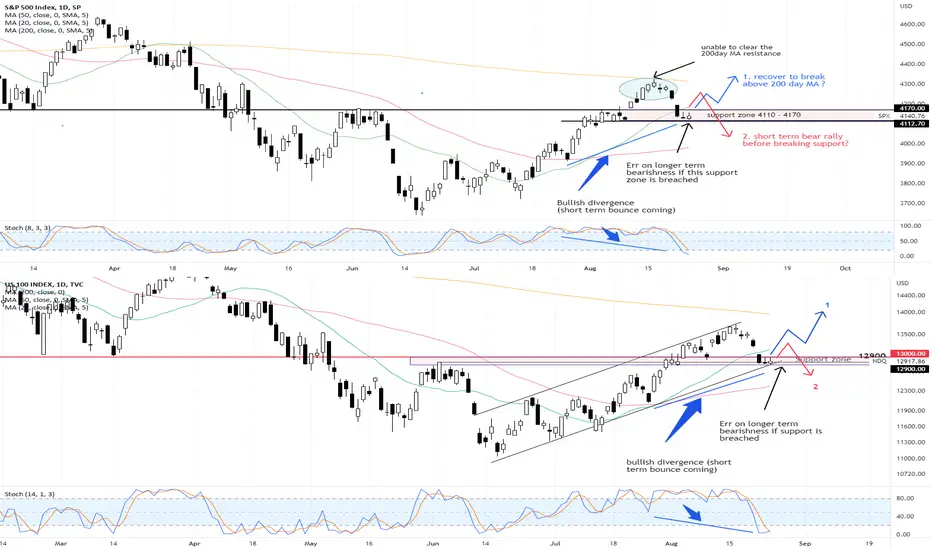
SPX and NQ - short term bounce nextBoth indices appear to be finding support at their respective near term support zones and with bullish divergence seen (between price and stochastics), a bounce is likely to happen soon.
Whether the worst is over or whether this next rebound is going to be a short-lived bear rally remains to be seen. Not time to turn longer term bearish yet despite the extremely volatility this period (not to mention all the calls out there screaming for market to crash). Just my opinion!
If we start to have a lower high (and especially followed by a lower low), then I would certainly stay very cautious.
Disclaimer: Just my 2 cents and not a trade advice. Kindly do your own due diligence and trade according to your own risk tolerance and don't forget that money management is important! Take care and Good Luck!
[Signal] EURJPY: Safe Haven PlayFX:EURJPY
Timeframe: H1
Direction: Short
Technical Confluences for Trade:
- Price action at Resistance of Ascending Channel
- Stochastic Overbought momentum
- Widening of the EMAs
Fundamental Confluences for Trade:
- There is some risk with EUR spiking higher due to the rising inflation situation in Europe but at the same time, global inflation pressure is starting to leave a drag on growth. Risk assets may continue to take a beating and may see some safe haven plays.
- Inflationary pressure is starting to pick up in Japan; may see a change in BOJ's monetary stance (reducing the yield differential between the US and Japan)
Suggested Trade:
Entry @ Area of Interest 139.70 - 140.50
SL: 140.92
TP1: 139.25 (move SL to Entry level once TP1 is achieved)
TP2: 137.85
RR: Approx. 3.30 (Depending on Entry Level)
May the pips move in our favor! Good luck! :D
*This trade suggestion is provided on an advisory basis. Any trade decisions made based on this suggestion is a personal decision and we are not responsible for any losses derived from it.

Descending Channel Break?There are higher lows on the stochastics and a possible break from its descending channel with earnings on tap.

GBPUSD - Signal by Keltner, Stochastic & ADX 24 Thu 2021k cross d breakout; stop/profit: 1.1/1.1, second: 0.6, Keltner confirm: Upper/Lower 1, Number cross: 1, reset keltner,
d value for long: 67, d value for short: 16; adx 30; 7, 7
* Take advantage of the 59% success rate of order 1 to enter position 2 with a higher Risk / reward ratio,
- Command 1: risk / reward 1/1. 59% success percentage.
- Order 2: risk / reward: 1 / 1.5 If you use Fibonacci retracement, it is 0.6 or 60%. Percent success 51.5%.
- Number of consecutive wins in the past: 9.
- Number of consecutive losses in the past: 6. So to avoid psychological influence, choose risk = 1% x6 = 6% for 1 trading signal.
Currently, the Bot assumes 2% (orders 1: 1%, orders 2: 1%)
-------
Max risk: 2%.
1. Trend identification:
... Keltner: Price through Upper1 / Lower 1 gives 1 point.
...... Uptrend: If price crosses above the close on Upper 1.
...... Downtrend: If the price goes down once, closes below the 1st line.
... Stochastic:
..... d> 67 for Buy, d <16 for Sell
... ADX: 30 indicates strong trend.
...... ADX smooth: 7.
...... DI length: 7.
2. Entry point:
... Buy (BUY): When k cut up D in an uptrend, when D> 67.
... Sell (SELL): When k cuts D in a downtrend, when D <16.

GBPUSD - Signal by Keltner - Stochastic & ADX 17/5/2021* Take advantage of the 59% success rate of order 1 to enter position 2 with a higher Risk / reward ratio,
- Command 1: risk / reward 1/1. 59% success percentage.
- Order 2: risk / reward: 1 / 1.5 If you use Fibonacci retracement, it is 0.6 or 60%. Percent success 51.5%.
- Number of consecutive wins in the past: 9.
- Number of consecutive losses in the past: 6. So to avoid psychological influence, choose risk = 1% x6 = 6% for 1 trading signal.
Currently, the Bot assumes 2% (orders 1: 1%, orders 2: 1%)
-------
Max risk: 2%.
1. Trend identification:
... Keltner: Price through Upper1 / Lower 1 gives 1 point.
...... Uptrend: If price crosses above the close on Upper 1.
...... Downtrend: If the price goes down once, closes below the 1st line.
... Stochastic:
..... d> 67 for Buy, d <16 for Sell
... ADX: 30 indicates strong trend.
...... ADX smooth: 7.
...... DI length: 7.
2. Entry point:
... Buy (BUY): When k cut up D in an uptrend, when D> 67.
... Sell (SELL): When k cuts D in a downtrend, when D <16.

GBPUSD - Daytrade by Keltner - Stochastic & ADX 12 Thu 2021- Higher High for Uptrend.
* Take advantage of the 59% success rate of order 1 to enter position 2 with a higher Risk / reward ratio,
- Command 1: risk / reward 1/1. 59% success percentage.
- Order 2: risk / reward: 1 / 1.5 If you use Fibonacci retracement, it is 0.6 or 60%. Percent success 51.5%.
- Number of consecutive wins in the past: 9.
- Number of consecutive losses in the past: 6. So to avoid psychological influence, choose risk = 1% x6 = 6% for 1 trading signal.
Currently, the Bot assumes 2% (orders 1: 1%, orders 2: 1%)
-------
Max risk: 2%.
1. Trend identification:
... Keltner: Price through Upper1 / Lower 1 gives 1 point.
...... Uptrend: If price crosses above the close on Upper 1.
...... Downtrend: If the price goes down once, closes below the 1st line.
... Stochastic:
..... d> 67 for Buy, d <16 for Sell
... ADX: 30 indicates strong trend.
...... ADX smooth: 7.
...... DI length: 7.
2. Entry point:
... Buy (BUY): When k cut up D in an uptrend, when D> 67.
... Sell (SELL): When k cuts D in a downtrend, when D <16.

GBPUSD - Daytrade by Keltner - Stochastic & ADX 28 Apr 2021* Take advantage of the 59% success rate of order 1 to enter position 2 with a higher Risk / reward ratio,
- Command 1: risk / reward 1/1. 59% success percentage.
- Order 2: risk / reward: 1 / 1.5 If you use Fibonacci retracement, it is 0.6 or 60%. Percent success 51.5%.
- Number of consecutive wins in the past: 9.
- Number of consecutive losses in the past: 6. So to avoid psychological influence, choose risk = 1% x6 = 6% for 1 trading signal.
Currently, the Bot assumes 2% (orders 1: 1%, orders 2: 1%)
-------
Max risk: 2%.
1. Trend identification:
... Keltner: Price through Upper1 / Lower 1 gives 1 point.
...... Uptrend: If price crosses above the close on Upper 1.
...... Downtrend: If the price goes down once, closes below the 1st line.
... Stochastic:
..... d> 67 for Buy, d <16 for Sell
... ADX: 30 indicates strong trend.
...... ADX smooth: 7.
...... DI length: 7.
2. Entry point:
... Buy (BUY): When k cut up D in an uptrend, when D> 67.
... Sell (SELL): When k cuts D in a downtrend, when D <16.

GBPUSD - Combine: Keltner - ADX - Stochastic 23 Apr 2021k cross d breakout; stop/profit: 1.1/1.1, second: 0.6, Keltner confirm: Upper/Lower 1, Number cross: 1, reset keltner,
d value for long: 67, d value for short: 16; adx 30; 7, 7
* Take advantage of the 59% success rate of order 1 to enter position 2 with a higher Risk / reward ratio,
- Command 1: risk / reward 1/1. 59% success percentage.
- Order 2: risk / reward: 1 / 1.5 If you use Fibonacci retracement, it is 0.6 or 60%. Percent success 51.5%.
- Number of consecutive wins in the past: 9.
- Number of consecutive losses in the past: 6. So to avoid psychological influence, choose risk = 1% x6 = 6% for 1 trading signal.
Currently, the Bot assumes 2% (orders 1: 1%, orders 2: 1%)
-------
Max risk: 2%.
1. Trend identification:
... Keltner: Price through Upper1 / Lower 1 gives 1 point.
...... Uptrend: If price crosses above the close on Upper 1.
...... Downtrend: If the price goes down once, closes below the 1st line.
... Stochastic:
..... d> 67 for Buy, d <16 for Sell
... ADX: 30 indicates strong trend.
...... ADX smooth: 7.
...... DI length: 7.
2. Entry point:
... Buy (BUY): When k cut up D in an uptrend, when D> 67.
... Sell (SELL): When k cuts D in a downtrend, when D <16.

GBPUSD - Combine: Keltner - ADX - Stochastic 21 Apr 2021* Take advantage of the 59% success rate of order 1 to enter position 2 with a higher Risk / reward ratio,
- Command 1: risk / reward 1/1. 59% success percentage.
- Order 2: risk / reward: 1 / 1.5 If you use Fibonacci retracement, it is 0.6 or 60%. Percent success 51.5%.
- Number of consecutive wins in the past: 9.
- Number of consecutive losses in the past: 6 . So to avoid psychological influence, choose risk = 1% x6 = 6% for 1 trading signal.
Currently, the Bot assumes 2% (orders 1: 1%, orders 2: 1%)
-------
Max risk: 2%.
1. Trend identification:
... Keltner: Price through Upper1 / Lower 1 gives 1 point.
...... Uptrend: If price crosses above the close on Upper 1.
...... Downtrend: If the price goes down once, closes below the 1st line.
... Stochastic:
..... d> 67 for Buy, d <16 for Sell
... ADX: 30 indicates strong trend.
...... ADX smooth: 7.
...... DI length: 7.
2. Entry point:
... Buy (BUY): When k cut up D in an uptrend, when D> 67.
... Sell (SELL): When k cuts D in a downtrend, when D <16.

GBPUSD - Combine: Keltner - ADX - Stochastic 19 Apr 2021k cross d breakout; stop/profit: 1.1/1.1, second: 0.6, Keltner confirm: Upper/Lower 1, Number cross: 1, reset keltner,
d value for long: 67, d value for short: 16; adx 30; 7, 7
* Take advantage of the 59% success rate of order 1 to enter position 2 with a higher Risk / reward ratio,
- Command 1: risk / reward 1/1. 59% success percentage.
- Order 2: risk / reward: 1 / 1.5 If you use Fibonacci retracement, it is 0.6 or 60%. Percent success 51.5%.
- Number of consecutive wins in the past: 9.
- Number of consecutive losses in the past: 6. So to avoid psychological influence, choose risk = 1% x6 = 6% for 1 trading signal.
Currently, the Bot assumes 2% (orders 1: 1%, orders 2: 1%)
-------
Max risk: 2%.
1. Trend identification:
... Keltner: Price through Upper1 / Lower 1 gives 1 point.
...... Uptrend: If price crosses above the close on Upper 1.
...... Downtrend: If the price goes down once, closes below the 1st line.
... Stochastic:
..... d> 67 for Buy, d <16 for Sell
... ADX: 30 indicates strong trend.
...... ADX smooth: 7.
...... DI length: 7.
2. Entry point:
... Buy (BUY): When k cut up D in an uptrend, when D> 67.
... Sell (SELL): When k cuts D in a downtrend, when D <16.

GBPUSD - Signal by Keltner - Stochastic & ADX 14 Apr 2021* Take advantage of the 59% success rate of order 1 to enter position 2 with a higher Risk / reward ratio,
- Command 1: risk / reward 1/1. 59% success percentage.
- Order 2: risk / reward: 1 / 1.5 If you use Fibonacci retracement, it is 0.6 or 60%. Percent success 51.5%.
- Number of consecutive wins in the past: 9.
- Number of consecutive losses in the past: 6. So to avoid psychological influence, choose risk = 1% x6 = 6% for 1 trading signal.
Currently, the Bot assumes 2% (orders 1: 1%, orders 2: 1%)
-------
Max risk: 2%.
1. Trend identification:
... Keltner: Price through Upper1 / Lower 1 gives 1 point.
...... Uptrend: If price crosses above the close on Upper 1.
...... Downtrend: If the price goes down once, closes below the 1st line.
... Stochastic:
..... d> 67 for Buy, d <16 for Sell
... ADX: 30 indicates strong trend.
...... ADX smooth: 7.
...... DI length: 7.
2. Entry point:
... Buy (BUY): When k cut up D in an uptrend, when D> 67.
... Sell (SELL): When k cuts D in a downtrend, when D <16.

GBPUSD - Long signal by Keltner, Stochastic & ADX 13 Apr 2021k cross d breakout; stop/profit: 1.1/1.1, second: 0.6, Keltner confirm: Upper/Lower 1, Number cross: 1, reset keltner,
d value for long: 67, d value for short: 16; adx 30; 7, 7
* Take advantage of the 59% success rate of order 1 to enter position 2 with a higher Risk / reward ratio,
- Command 1: risk / reward 1/1. 59% success percentage.
- Order 2: risk / reward: 1 / 1.5 If you use Fibonacci retracement, it is 0.6 or 60%. Percent success 51.5%.
- Number of consecutive wins in the past: 9.
- Number of consecutive losses in the past: 6. So to avoid psychological influence, choose risk = 1% x6 = 6% for 1 trading signal.
Currently, the Bot assumes 2% (orders 1: 1%, orders 2: 1%)
-------
Max risk: 2%.
1. Trend identification:
... Keltner: Price through Upper1 / Lower 1 gives 1 point.
...... Uptrend: If price crosses above the close on Upper 1.
...... Downtrend: If the price goes down once, closes below the 1st line.
... Stochastic:
..... d> 67 for Buy, d <16 for Sell
... ADX: 30 indicates strong trend.
...... ADX smooth: 7.
...... DI length: 7.
2. Entry point:
... Buy (BUY): When k cut up D in an uptrend, when D> 67.
... Sell (SELL): When k cuts D in a downtrend, when D <16.

GBPUSD - Signal by Keltner - Stochastic & ADX 5 Apr 2021k cross d breakout; stop/profit: 1.1/1.1, second: 0.6, Keltner confirm: Upper/Lower 1, Number cross: 1, reset keltner,
d value for long: 67, d value for short: 16; adx 30; 7, 7
* Take advantage of the 59% success rate of order 1 to enter position 2 with a higher Risk / reward ratio,
- Command 1: risk / reward 1/1. 59% success percentage.
- Order 2: risk / reward: 1 / 1.5 If you use Fibonacci retracement, it is 0.6 or 60%. Percent success 51.5%.
- Number of consecutive wins in the past: 9.
- Number of consecutive losses in the past: 6. So to avoid psychological influence, choose risk = 1% x6 = 6% for 1 trading signal.
Currently, the Bot assumes 2% (orders 1: 1%, orders 2: 1%)
-------
Max risk: 2%.
1. Trend identification:
... Keltner: Price through Upper1 / Lower 1 gives 1 point.
...... Uptrend: If price crosses above the close on Upper 1.
...... Downtrend: If the price goes down once, closes below the 1st line.
... Stochastic:
..... d> 67 for Buy, d <16 for Sell
... ADX: 30 indicates strong trend trend.
...... ADX smooth: 7.
...... DI length: 7.
2. Entry point:
... Buy (BUY): When k cut up D in an uptrend, when D> 67.
... Sell (SELL): When k cuts D in a downtrend, when D <16.

Good old fashioned CLASSIC ETHEREUM looking to exit confluenceAfter a mini nose dive, stochastics and a little spike in volume indicate a possible move upward into resistance at a previous tested price point. However, it might be best to wait until it crosses the line to make any bets on this one. If it crosses, go long, if it continues a little further down, go short.
You don't have to win all the time, just lose a little less every day. That's my dieting strategy... Make sense?

GBPUSD - Long signal by Keltner, Stochastic & ADX 31 Mar 2021k cross d breakout; stop/profit: 1.1/1.1, second: 0.6, Keltner confirm: Upper/Lower 1, Number cross: 1, reset keltner,
d value for long: 67, d value for short: 16; adx 30; 7, 7
* Take advantage of the 59% success rate of order 1 to enter position 2 with a higher Risk / reward ratio,
- Command 1: risk / reward 1/1. 59% success percentage.
- Order 2: risk / reward: 1 / 1.5 If you use Fibonacci retracement, it is 0.6 or 60%. Percent success 51.5%.
- Number of consecutive wins in the past: 9.
- Number of consecutive losses in the past: 6. So to avoid psychological influence, choose risk = 1% x6 = 6% for 1 trading signal.
Currently, the Bot assumes 2% (orders 1: 1%, orders 2: 1%)
-------
Max risk: 2%.
1. Trend identification:
... Keltner: Price through Upper1 / Lower 1 gives 1 point.
...... Uptrend: If price crosses above the close on Upper 1.
...... Downtrend: If the price goes down once, closes below the 1st line.
... Stochastic:
..... d> 67 for Buy, d <16 for Sell
... ADX: 30 indicates strong trend trend.
...... ADX smooth: 7.
...... DI length: 7.
2. Entry point:
... Buy (BUY): When k cut up D in an uptrend, when D> 67.
... Sell (SELL): When k cuts D in a downtrend, when D <16.

GBPUSD - Long signal by Keltner, Stochastic & ADX 26 Mar 2021k cross d breakout; stop/profit: 1.1/1.1, second: 0.6, Keltner confirm: Upper/Lower 1, Number cross: 1, reset keltner,
d value for long: 67, d value for short: 16; adx 30; 7, 7
* Take advantage of the 59% success rate of order 1 to enter position 2 with a higher Risk / reward ratio,
- Command 1: risk / reward 1/1. 59% success percentage.
- Order 2: risk / reward: 1 / 1.5 If you use Fibonacci retracement, it is 0.6 or 60%. Percent success 51.5%.
- Number of consecutive wins in the past: 9.
- Number of consecutive losses in the past: 6. So to avoid psychological influence, choose risk = 1% x6 = 6% for 1 trading signal.
Currently, the Bot assumes 2% (orders 1: 1%, orders 2: 1%)
-------
Max risk: 2%.
1. Trend identification:
... Keltner: Price through Upper1 / Lower 1 gives 1 point.
...... Increase: If price crosses above the close on Upper 1.
...... Decrease: If the price goes down once, closes below the 1st line.
... Stochastic:
..... d> 67 for Buy, d <16 for Sell
... ADX: 30 indicates strong trend.
...... ADX smooth: 7.
...... DI length: 7.
2. Entry point:
... Buy (BUY): When k cut up D in an uptrend, when D> 67.
... Sell (SELL): When k cuts D in a downtrend, when D <16.

GBPUSD - Signal by Keltner, Stochastic & ADX indicator 18 Mar 21k cross d breakout; stop/profit: 1.1/1.1, second: 0.6, Keltner confirm: Upper/Lower 1, Number cross: 1, reset keltner,
d value for long: 67, d value for short: 16; adx 30; 7, 7
* Take advantage of the 59% success rate of order 1 to enter position 2 with a higher Risk / reward ratio,
- Command 1: risk / reward 1/1. 59% success percentage.
- Order 2: risk / reward: 1 / 1.5 If you use Fibonacci retracement, it is 0.6 or 60%. Percent success 51.5%.
- Number of consecutive wins in the past: 19.
- Number of consecutive losses in the past: 6. So to avoid psychological influence, choose risk = 1% x6 = 6% for 1 trading signal.
Currently, the Bot assumes 2% (orders 1: 1%, orders 2: 1%)
-------
Max risk: 2%.
1. Trend identification:
... Keltner: Price through Upper1 / Lower 1 gives 1 point.
...... Increase: If price crosses above the close on Upper 1.
...... Decrease: If the price goes down once, closes below the 1st line.
... Stochastic:
..... d> 67 for Buy, d <16 for Sell
... ADX: 30 indicates strong trend.
...... ADX smooth: 7.
...... DI length: 7.
2. Entry point:
... Buy (BUY): When k cut up D in an uptrend, when D> 67.
... Sell (SELL): When k cuts D in a downtrend, when D <16.

LINKBTC Range Resistance|Stoch Equilibrium|Declining VolumeEvening Traders,
Today’s Analysis – LINKBTC – trading at key high time-frame levels, breaking above range resistance will lead to a blue sky breakout.
Points to consider,
- Trend bullish (consecutive higher lows)
- Key Dynamic support
- Range resistance (Pivot Point )
- RSI above 50
- Stochastics equilibrium
- Declining volume
Links weekly structure is bullish with consecutive higher lows respecting its dynamic support. Breaking this support will increase the probability of testing the range midpoint.
Range resistance is a pivot point on the chart, weekly candle closes above this level will be bullish, historical price action has never closed, only managed wicks.
The RSI is trading above 50 which has been maintained for over two years, breaking this level will be notable and bearish.
Stochastics is trading in a valid equilibrium; price action will be backed with momentum as the stochastics breaks from its apex.
Volume is clearly declining which is an indication of a breakout being imminent. Usually high time frame level breaks are backed with increasing volume.
Overall, in my opinion, LINKBTC is at a pivot point on its chart, breaking above range resistance will increase the probability of a blue sky breakout. Price action needs to be backed with increasing volume for confirmation.
What are your thoughts?
Thank you for following my work!
And remember,
“The desire for constant action irrespective of underlying conditions is responsible for many losses in Wall Street.” – Jesse Livermore

AUDUSD // Fibunacci levels // Support Resistance // Trend lines* Retracement to key support at .618
+ if it holds and bounces great opportunity for longs
- otherwise if it breaks a short opportunity arises
* Market Sentiment is overall short
Contrarian pov to long
* Stochastics are oversold on 4hr but not so much on higher timeframes
+ expecting it to make one final impulse before any major correction.

BTCUSD Golden Pocket| 200 MA| Regression Trend Hello Traders!
Today’s update will be on BTC’s daily chart where it has been rejected from the golden pocket, a correct may be imminent due to heavy resistance confluences.
Points to consider,
- Trend testing strong technical resistances – Golden Pocket & Regression Trend
- Local resistance - 200 MA
- Local support at .786 Fibonacci
- Stochastics topping out
- RSI coming into apex
- Volume below average
Trend is testing strong resistance, golden pocket, a key Fibonacci level where BTC has been rejected from that is also in confluence with local resistance. The 200 MA and upper resistance from the regression trend line proves heavy technical confluence.
Local support is found at the .786 Fibonacci level, BTC is probable to return to this area before an impulse move back up.
Stochastics is currently in the upper regions, can stay trading here for an extended period of time, however lots of stored momentum to the downside. The RSI coming into its apex, signalling that a break is imminent in either direction.
Volume is well below average, an influx in imminent with a decisive move; this will help dictate the direction of BTC.
Overall, in my opinion, BTC is likely to correct to support due very strong resistance. A correction will cool of indicators such as the RSI and the Stochastics before another leg up.
What are your thoughts?
Please leave a like and comment,
And remember,
“Fear, inherently, is not meant to limit you. Fear is the brain’s way of saying that there is something important for you to overcome.”
― Yvan Byeajee,

SLV Breakout? or Fakeout?Fast move to top of current range. Stochastics turning up and the parabolic indicator implies the start of a move higher. For Elliott Wave,, could be a wave 5 of 3 of 1. Any EW experts here? If follow through on heavy volume comes in, some gaps above 15 and 16 need to be filled
