Shorting Gold (XAU/USD) on the daily timeframeGold (XAU/USD) has shown repeated weakness and is once again offering a short entry. A break below and a retest of 1240 forming a high test yesterday bodes well for further price decline. The reward potential is a hefty 5:1 on the way down. Although a set up is still visible, there are, however, a few words of warning. Beware of Stochastic and RSI divergence, which if price adheres to, Gold (XAU/USD) could pull back into the moving averages and then give new short opportunities with an even lumpier reward:risk.
entry - below today's inside bar
stop - above yesterday's high test
target - 1179
Search in ideas for "stochastic"

QNTUSDT - Short - Broadening WedgeQNT is currently forming an ascending broadening wedge pattern on daily timeframe. An ascending broadening wedge is a bearish reversal chart pattern. Where the upper line is the resistance line and the lower line is the support line. As we can see in the chart that it´s moves increase with higher magnitudes. This pattern should be traded when the price breaks out of the support line.
Looking at the pattern combined with the three indicators we can conclude it´s currently in an overbought condition. So it´s likely for the price to retrace. The three indicators are Bollinger Bands, RSI 14 and Stochastic.
In our opinion it´s more likely for the price to retrace and pump once more before it breaks out of the support line. So for now Target 1 in prioritized. Before targeting the other two targets we have to wait what happens after Target 1!
All the details are shown on the chart.
Goodluck!

DOGE - Oversold - Small bounce possibleOn the DOGEUSD chart (1h timeframe), we can see the price is currently oversold. The price is reaching a support area. Once the price has entered the support area it's likely for the price to bounce back up.
All three indicators used are Bollinger Bands, RSI, and Stochastic. All three indicators confirm the oversold condition.
All further details are shown on the chart.
Good luck!


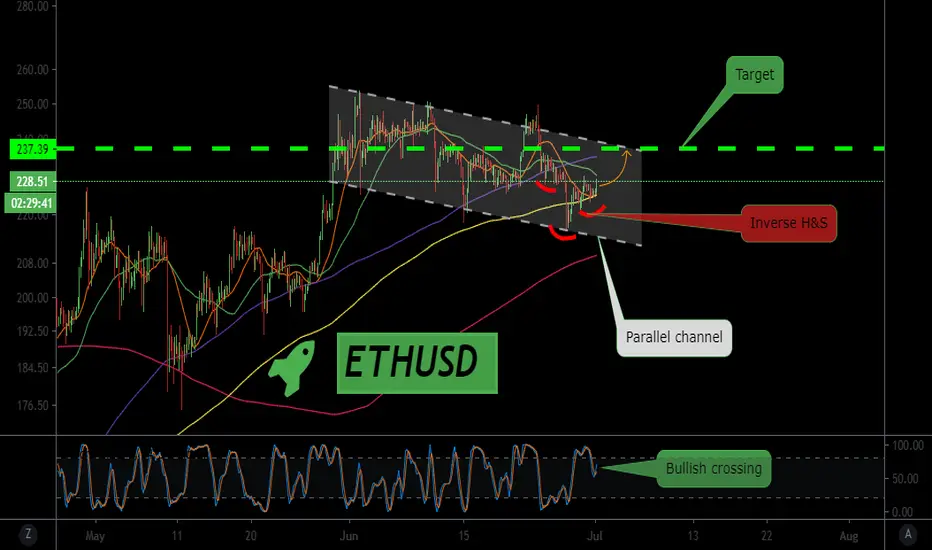
ETHUSD -> parallel channel and Stochastic bullish crossingPlease support my idea with likes, it is really important to me =).
Ethereum trades on a parallel channel against USD pair. It showed a bullish crossing on Stochastic. The chart also shows an inverse head and shoulders pattern, which would take the price to 237.39USD level. We may long here.
Combining Stochastic And Bollinger Bands To Trade BitcoinChart
2020 is the halving’s year and the crypto community is putting its expectations on Bitcoin as the cryptocurrency that will lead the rest of the market to new historical highs.
Bitcoin is currently undertaking a consolidation process after the bull run that it had from April to June 2019. Every trader is formulating the same question: When is this correction going to end?
Pinpointing when this turning point is going to take place can be crucial and very profitable for your crypto portfolio. Technical analysis is highly useful to find when this event can happen.
Designing your automated strategy
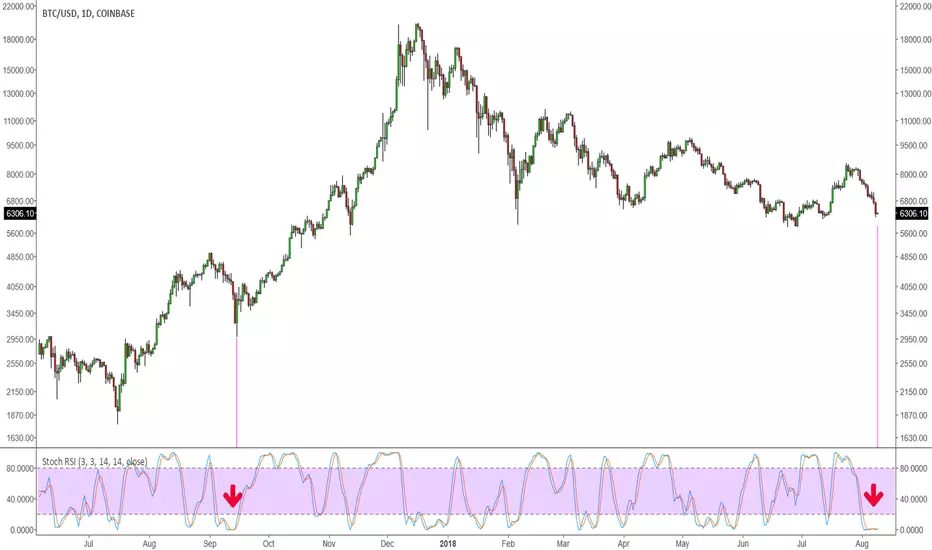
In this week’s automated strategy we have selected two strategies, the Bollinger Bands and Stochastic.
This combination of a volatility and momentum indicator is intended to spot the moment where the price has decreased sharply and is likely to go back up. By selecting two indicators, it’s more likely that potential negative trades will not be traded.
As can be seen in the Bitcoin chart, the strategy has only opened positions once both indicators were signaling buy . In this case, the strategy has been detecting successfully all the quick falls of the price to open a position at a price level where BTC is more likely to increase.
You can also select the same indicators to sell the previously opened positions. In this way, once both indicators signal sell, it will close the position (unless you take profit or trailing stop-loss would have been hit)

US30 is for sell (ichimuko and stochastic confirmation)It’s trapped into the cloud which is a resistance level.
It’s also reached 100% level on stochastic.
Sell it and collect profits when it achieves 50 pips.
Good luck.

SPX daily bearish stochastic divergenceSP:SPX Higher high in price, lower high in stochastic. Bearish signal great entry from 3/13 starting from 2795 on down. Short term bearish.
Now will we hold rising trend line forming a rising wedge and bounce off support or break below?

USDJPY MACD divergence shortAdditional MACD divergences have formed on the USDJPY, together with overbought conditions on the stochastic. I expect a pullback into the previous support level.

NZDUSD MACD divergance longA divergence has formed on the MACD together with oversold conditions on the stochastic. This makes me believe the price will rally up into previous resistance.

AUDCHF MACD divergance longTwo regular divergences have formed on the MACD, together with oversold conditions on the stochastic. This makes me believe the price will go up at least until it hits the first resistance level.

AUDNZD MACD divergence shortFX:AUDNZD A hidden divergence has formed on the MACD, coupled with overbought conditions on the stochastic. This makes me believe we will see a return back into the previous support level, to continue the trend.

USDCAD MACD divergence shortFX:USDCAD A long term divergence has formed on the MACD, coupled with overbought conditions on the stochastic. This makes me believe we will see a return back to the previous support level.

chfjpy short 1 hourcandle confirms downtrend along with stochastic. uptrend has been broken. fibonacci shown price is below 0.618 and price is touching 20ema.

AUDJPY: Fading the Weekend Bounce #forexThe price opened higher this week but found downside pressure again. Earlier last week we Hit resistance and rejected. Bearish divergence on Stochastic.
It is just my view. Trade Your own view.
I have no incentive to post if i don't get enough support from you. Likes and comment.
You can SKYPE me at : Technician - The Forex Channel
My Regards,
Technican

(SWING)Good 1-2-3 pattern to continue a bullish bias. Expecting to break the resistance level but maybe too extended to break now. Looking for a small pullback or flag to work off the overbought stochastic.

Doji, Stochastic Cross, and an Ominous CloudYesterday produced a decent Doji, and a cross on the stochastic. All of this right at the 0.382 Fib line. There also seems to be an interesting pivot at the 0.100 ATR. Which if it stays in effect should start the next leg of the trend. If 1.312 doesn't hold, the 0.5 Fib line and Ichimoku cloud provide an even higher probability short trade near 1.32.

First Destination of Bitcoin is $24.000Considering both the Bear Flag pattern and the Stochastic Relative Strength Index on the daily timeframe, as well as the weekly timeframe pattern, BTC's eyes are on the grave. The search for liquidity at a much lower level, in the $18-20K range, should not be overlooked. Of course, we may see an increase up to $35,000, but this possibility remains a difficult one when we consider the correlation to the US500 and US100 parities.

☆ BTC / USD — Bitcoin Trading ☆Hello on the regular Bitcoin Update.
Just before Monday btc price near resistance and in the wedge pattern inside Symmetrical Triangle.
I am looking for good long entry here at breakout from triangle $9850, or at support of the triangle near $9000—$9200
On the chart you may notice Stochastic RSI and it's divergences inside Triangle Pattern and Wedges.
So for taking profits I am looking at $10000 zone and above.
As always I am calculating my risk and know what I can lose in each trade.
Please follow your own money and risk management when considering using my trading ideas.
Stay tuned, this is
Artem Crypto

ETHUSD - Stoch RSI - Ride the TrendI have not tried this for many other pairs but this is working for me with ETHUSD on the 15 min chart. After looking at several indicators, entering in at the wrong times, being in long when I should be in a short or out, the frustration led me to really try to find where the best low to buy into would be, I discovered that if I set the Stoch RSI indicator with the following values and simply buy when the bottom K crosses D and ride the trend to the top and sell (short) when K crossed D at the top, it makes for a nice profit most of the time. Nothing is 100% foolproof when using one indicator so I recommend pairing it with a 1 or more you are familiar with.
Pair: ETHUSD on Kraken (Can short in the US on that exchange currently) Many others are disabling shorting if you reside in the US.
Chart: 15 Min Chart
Indicator: Stoch RSI in Trading View
K 85
D 14
RSI Length 19
Stochastic 125
If you buy in too far away from the crossing, you will be caught in the volatility from my experience. Paper Trade to feel comfortable and so far, when the whale hits, I am in the right direction. I am no financial adviser but simply showing and perhaps saving someone hours of analysis. Note: On a large dump or large move up, this will not buy in outside the Bollinger Bands, but enter in a less volatile and hopefully let you enter without instantly being in a negative. Good luck...

Bitcoin sitting at supportThese days have been a bloodbath in the cryptocurrency markets.
These are the key support levels you could use to predict when it will reverse.
RSI and Stochastic RSI for 1 Day and 4 Hours time frame have reached oversold.
Should we fall bellow these keys supports, expect it to free fall to the 4000 dollars range, however it probably would not last long as people would probably stop mining, reduces the supply of bitcoin, and increase its price again.
Good luck to you all!

BTC - StochasticRSI has flat-lined - The last time it did.....I made a peculiar observation while looking at the charts this evening. Everybody looks at the price for waves, support / resistance, fibs, etc. etc. etc. But while looking at the daily Stochastic RSI Indicator I noticed that it has basically flat-lined. That seemed odd so I went back as far as I could to find something similar. I could only find one similar occurrence. This is the chart. Make of it what you will.
Disclaimer. I've been long since about $6,185, so yeah, I'm looking for this bounce to continue. :)
BTC: Bear Flag, 200EMA and RSI says DOWN!Been a while since the last update, I've been quite busy although I kept reading stuff here and there.
BTC is developing a bear flag BELOW the 200 days EMA. This mainly means we are going down!
Stochastic RSI shows a fast invesrion from the overbought area down to zero.
Personally I would set a target price around 7200, close to the strong trailing support level highlighted in "pink".
As a side note we always need to take into consideration that this market is highly manipulated and almost anything can happen. I'm waiting for a breakout towards the bottom of the bear flag as a trend confirmation.
***As usual, this is not a trading advice.. It is merely my idea for educational and informational purposes only***
