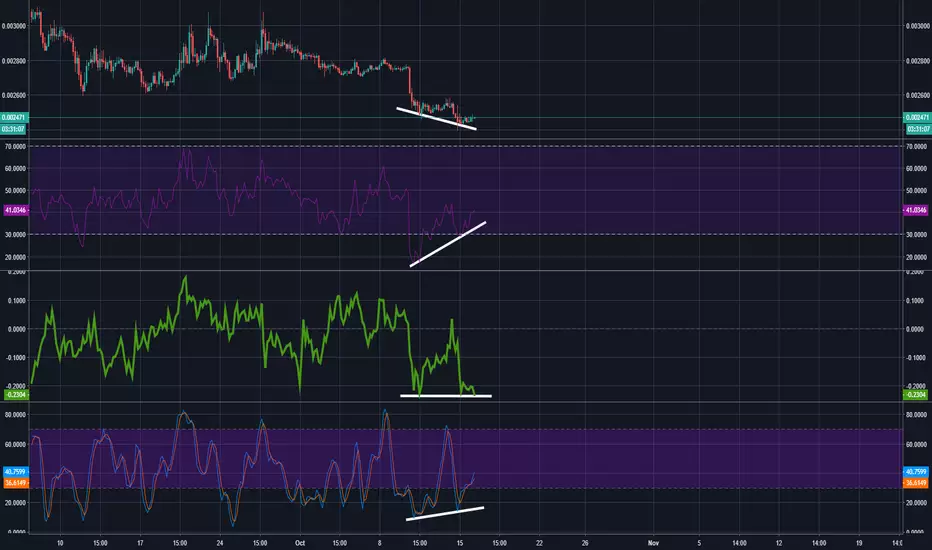
GBPUSD Short|Range Resistance| Overthrow| Bearish Retest| 200MA Evening Traders,
Today’s Analysis – GBPUSD – range trading putting in a bearish retest with the immediate target range midpoint.
Points to consider,
- Overthrow (no follow through)
- Range resistance confluence (200MA)
- Range midpoint (Local support)
- Oscillators neutral
- Volume below average
-
GBPUSD’s immediate trend is bearish with consecutive lower highs. Price broke range resistance with no follow through (over throw), further solidifying the bearish bias
Range resistance is in confluence with the 200 MA, price is putting a probable bearish retest here. The range mid-point will be the immediate target – local support.
The RSI is neutral whilst the stochastics is in the upper regions, indication that momentum is stored to the downside in the market.
Volume is trading below average, an influx is likely as price trades to the downside.
Overall, in my opinion, GBPUSD is likely to test range midpoint as price action looks weak. A bearish retest is likely forming where a short can be placed with defined risk.
What are your thoughts?
Please leave a like and comment,
And remember,
“Genuine acceptance that there will be losses on your way to market success will greatly decrease the hurt when they eventually come.” ― yvan Byeajee
Search in ideas for "stochastic"

CADJPY Price Apex|Daily Support|Low Volume|Local ResistanceEvening Traders,
Today’s Analysis – CADJPY- trading in its Apex (Moving Averages converging) at daily support.
Respecting the 200 MA will push price to a retest of local resistance.
Points to consider,
- Price equilibrium
- 200 MA confluence
- 21 MA Resistance (Apex)
- Oscillators neutral
- Volume below average
CADJPY is trading in a valid equilibrium; a break is imminent at any moment as price is in its apex.
The 200 MA is in confluence with daily support, this ways more significance then the 21 MA resistances only, thus the probability breaking north is slightly higher.
The RSI and Stochastics are flat given price is holding support in an equilibrium. Breaking out of the apex will directly coincide with the strength and momentum projected by the oscillators.
Volume is key as it is currently below average; this is to be expected when price trades in equilibrium, a sign that an impulse move is imminent
Overall, in my opinion, CADJPY has strong support confluence giving it a greater probability of breaking north. Respecting the 200 MA will push price into local resistance for a retest. Price must break out of its apex with increasing
volume to avoid fake outs.
What are your thoughts?
Please leave a like and comment,
And remember,
“Sheer will and determination is no substitute for something that actually works.” – Jason Klatt

RVN Structural S/R Flip| Pivot Point| .618 Fibonacci| RSI WedgeEvening Traders,
Today’s Analysis – RENBTC – trading above structural level with Fibonacci confluence, RENBTC is likely to rise up validation of this level.
Points to consider,
- Structural S/R Flip (Retest)
- Technical Confluence (Trade location)
- RSI Falling Wedge pattern
- Bull Impulses (PA validation)
RENBTC is re-testing its structural S/R flip; further candle closes will solidify the level. This is a key support with technical confluence; market structure, key Fibonacci level (.618) and a Fibonacci Extension.
This indicates a true trade location and a pivotal point on the chart
The RSI is in a falling wedge pattern, breaking in either direction will dictate the overall trend. Stochastics are over extended, can stay trading here for an extended time, momentum is stored to the upside upon a valid buy cross.
Overall, in my opinion, price action will dictate the overall trend, strong bull impulses will be a sign of a probable parabola. Validating support will be very bullish, RENBTC will likely rise to Fibonacci targets.
What are your thoughts?
Please leave a like and comment,
And remember,
“Dangers of watching every tick are twofold: overtrading and increased chances of prematurely liquidating good positions” – Jack Schwager

LINKUSDT Watch Price Action | Range Median| Local Support Evening Traders,
Today’s Analysis – LINKUSDT – clear break out failure, trading back into its range most likely to form an equilibrium, how price action forms will dictate the next probable move
Points to consider,
- Overthrow failure
- Demand zone respected
- PA Consolidation
- Range trading (local support and range median)
- Volume climax
Price recently had an impulse move down confirming a break out failure at a key level. Sell pressure pushed price into demand zone where the bulls showed up, subsequent oversold bounce.
The current trading range is between Local support and range median, key trade locations upon a break.
Price action will be important to monitor at these levels subsequently with the RSI and Stochastics, which are quite neutral at current given time, needs more development.
Volume climax evident, indication of seller exhaustion as price balances supply and demand
Overall in my opinion, LINKUST may forma equilibrium before its next impulse move, the way price action forms at key levels will determine a directional bias.
What are your thoughts?
Please leave a like and comment,
And remember,
“You create your own game in your mind based on your beliefs, intents, perception and rules.” ― Mark Douglas

CGC New Range| Structural Support/Resistance| S/R Flip Evening Traders,
Today’s Technical Analysis – CGC - impulse move into resistance where CGC is likely to range trade.
Points to consider,
- Macro trend bearish
- Resistance confluence
- S/R Flip retest
- RSI above 50
- Volume climax
CGC’s macro trend has been putting in consecutive lower highs with a recent sell of ending with an oversold bounce.
Currently testing structural resistance which is in confluence with the 200 MA, a rejection is probable.
This will likely lead to a retest of support, confirming the S/R Flip
RSI is above 50, cooling off from oversold conditions whilst the stochastics is trading in the upper regions with a sell cross coming to fruition.
Volume climax is evident, indicating temporary bottom may be in as CGC finds its equilibrium
Overall, in my opinion, CGC is likely to trade in this range before another impulse move. CGC’s general immediate trend can be determined by the break of either of the key support and or resistance level.
What are your thoughts?
Please leave a like and comment,
And remember,
“In order to succeed, you first have to be willing to experience failure.” ― Yvan Byeajee

INO Broadening Wedge | Coronavirus Vaccine?Evening traders!
Today’s update will be on INO, trading in a descending broadening wedge which serves as a bullish pattern.
Points to consider
- Trend trading in a lower high projection
- Broke 21 week MA (S/R Flip)
- Structural weekly resistance
- RSI resting on support
- Stochastics neutral
- Clean volume influx
INO is trading in a bear trend putting in consecutive lower highs in a macro broadening wedge. The 21 weekly EMA has broken and confirmed as recent support within the larger formation.
Macro weekly structural resistance is a key level to close above; INO will be extremely bullish if this comes to fruition.
The RSI is currently resting on its support; a break below will increase bearish bias and INO being rejected from current resistance.
Clean volume climaxes are evident; this is probably due to fundamentals as the company is trying to formulate a vaccine for the corona virus.
Overall, in my opinion, from a technical stand point, this is a classic descending broadening wedge. A close above weekly structural resistance will increase the likely hood of INO meeting the technical target.
What are your thoughts?
Please leave a like and comment,
And psychologically,
“Remember that stocks are never too high for you to begin buying or too low to begin selling.”

LINK Symmetrical Triangle|Hidden Bullish Divergence|Low VolumeHello Traders!
Exciting update today on LINKBTC which is looking quite bullish forming a symmetrical triangle in a blue sky breakout
Points to consider,
- Trend putting in consecutive higher lows
- .236 Fibonacci – Local Resistance
- 50 Moving Average, holding support
- RSI travelling into wedge
- Stochastics in lower regions
- Volume declining
LINKBTC broke structural resistance confirming the blue sky breakout with consecutive higher lows. It is now trading in a symmetrical triangle with a high probability of breaking bullish.
Local resistance is from the .236 Fibonacci, looks quite weak compared to patterns support. The 50 Moving Average on the other hand is holding true after the first retest of the initial break.
The RSI is travelling in a wedge and also diverging from price, confirming a valid hidden bullish divergence. Volume is clearly declining, signalling a break is imminent most likely to occur near the apex.
Overall in my opinion, a break in either direction is probable due to clear support and resistance. There is however a higher probability of breaking bullish due to the nature of the uptrend. Volume will coincide with a breakout, confirming the pattern being true.
What are your thoughts?
Please leave a like and comment,
And remember,
“Focus, patience, wise discernment, non-attachment —the skills you acquire in meditation and the skills you need to thrive in trading are one and the same.”
― Yvan Byeajee

BQXBTC Equilibrium| .618 Fibonacci| Break Imminent| Trade Setup Hello Traders!,
Today’s update will be on BQXBTC, a clear equilibrium playing out after an initial bull move topping out, leaving a probable trade setup.
Points to consider,
- Equilibrium at apex
- Price holding .618 Fibonacci (support)
- .50 Fibonacci as resistance
- EMA’s neutral
- RSI in equilibrium
- Stochastics projected downwards
- Low volume
BQXBTC is trading right into its apex, a breakout is upon fruition with a higher probability of breaking bullish as local support held true. This support level is in confluence with the Fibonacci retracement (.618 Level), signalling a strong potential base.
The EMA’s are currently neutral, not a clear metric to determine if support or resistance as of now. The RSI is also travelling into its apex, signalling a move is imminent at any current given time.
Volume has been clearly dry, important to note as an influx will be required when BQX leaves this current equilibrium.
An entry is valid on the .618 Fibonacci level with a stop loss just under previous higher low.
What are your thoughts?
Please leave a like and comment,
And remember,
“Genuine acceptance that there will be losses on your way to market success will greatly decrease the hurt when they eventually come.”

BTCUSD Trade Set Up | Key Levels to Watch !Hello Traders!
Today’s chart update will be on a trade setup currently forming on bitcoin, a decent bounce off from local lows after a bullish divergence has led Bitcoin to now resting on the EMA’s. We have clear levels of support and resistance to watch for a bullish on or bearish play.
Points to consider
- Oversold bounce came to fruition
- Price supported by EMA’s and .382 Fibonacci
- Local support at .236 Fibonacci
- Local resistance at .50 Fibonacci
- Stochastics in lower regions
- RSI in Nuetral territory
Price is currently being supported of the EMA’s which is in confluence with the .382 Fibonacci level, this needs to hold true for Bitcoin to break bullish from local support. Bulls do have a lot of room to work with in terms of putting in a higher low, which will increase the chance of putting in an equilibrium before a break. If Bitcoin decides to break current support, then the probability of a bear break of local support increases.
Regardless either break, it needs to be backed with decisive volume…
A safe entry bullish and or bearish will be on a close above and or below the key local support and resistant levels…
What are your thoughts on the probable trade set up?
Please leave a like and comment,
And remember,
Sheer will and determination is no substitute for something that actually works.” – Jason Klatt

NEOBTC Bull Flag Formation | Strong Trend | key Level Holding Hello Traders!
Update on NEOBTC, which has proven me wrong from previous analysis (see chart linked), NEO has successfully broken bullish from its apex and is consolidating above the .618 Fibonacci Level.
Points to consider,
- Strong Bull Trend
- Key resistance broken, S/R Flip
- Price consolidating on support
- Volume Declining
- RSI respecting support
- Bull Flag formation
NEO has established a very strong uptrend since 26th October 2019, breaking key resistant levels, price is now consolidating on the .618 Fibonacci level, which was a previous staunched resistance.
Volume is clearly declining upon consolidation, signalling that a move will be imminent; we have a bull flag formation which puts emphasis on the probability of a continued bullish bias from current level.
The RSI has been respecting support, which is healthy in this trend, showing that buyers are in control at current given time. The stochastics is currently projected downwards slightly, but as we can see, it can stay in upper regions for an extended period of time (Blue highlighted area).
The VPVR is quite interesting, the volume of transactions increases as it gets closer to the blue trend line, which is a good area to take profits due to technical confluences.
Overall, in my opinion, NEO has a high probability of break bullish from this flag as we are in a strong uptrend. Volume is declining, which is what we need to see in a flag formation, we are also holding and respecting a key support, that is the .618 Fibonacci level.
What are your thoughts?
Please leave a like and comment,
And remember,
“Stocks are bought not in fear but in hope. They are typically sold out of fear.” – Justin Mamis

Monitoring the StochasticTrading indicators. WIPThis idea will be used for backtesting and chart analysis.
The idea is to trade XBTUSD (BitMEX) based on 1h candles.

BTCUSD Important Resistance Area! Bears vs Bulls!Hello Traders!
Update on BTC recent price movements from yesterday!
Will bulls push though current resistance or will bears take over at this given point?
Points to consider
- Head and Shoulders pattern will be negated if bulls break resistance with volume
- 4hr bullish divergence has held true!
- Currently inside bars forming on 240 timeframe
- Volume has dropped of drastically
- RSI is in overbought territory
- Stoch’s overextended on upwards momentum
- Volume Climax
- EMA’s yet to reach price
BTC has had an impressive move upwards from strong local support; now currently testing an important resistant area. Bulls have the potential of pushing price over resistance thus totally negating the potential head and shoulders pattern.
(Not a pretty Head and Shoulders one must say)
The 4 hour bullish divergence gave bulls an edge to push price to resistance, however volume has drastically decreased since testing this area (currently forming inside bars, yet to break), bulls may be well be out of steam. The RSI is currently in overbought territory and needs to cool off on a technical point of view. The Stochastics’ is now turning, showing us possible downwards momentum being more likely. We are yet to see how price will react once the EMA’s come to fruition, it may hold support, but this would be weak as other indicators are looking quite bearish…
What are your thoughts? Will price turn bearish from this resistance, or will it consolidate before bulls takeover again?
Please leave a like and comment
And remember,
“You will never find fulfillment trading the markets if you don’t learn to appreciate and be satisfied with what you already have.” ― Yvan Byeajee

SHORT GOLDShort scalp on Gold with bearish cypher pattern and overbought stochastics on 15min TF, TP 1430

forexTrdr USDJPY - TRENDLINE, STOCHASTIC + RSI ALL POINTING 1WAYMorning traders
We have multiple indicators lining up to suggest US dollar versus Japanese Yen price action is about to head lower towards low 107 area.
Firsly we have a descending trendline that we have highlighted on our trading view chart coming from 109 area on 10th of July and being tapped twice overnight at low 108s before pulling back to 107.85 area. This is in line with stochastics rolling over from overbought status and RSI pulling back from resistance to the upside around 52. All of which we have highlighted on our trading view charts to make it clean and simple to understand.
Follow us on tradingview under forexTrdr to get our sample ideas free and immediately - its free to setup a profile and the charting tools and software is easier to use than Meta trader and most broker platforms. Or if you want a free one month signals trial with us please get in touch.
Good luck trading
from the Team at forexTrdr

GBPUSD 1H SellGBPUSD shows sell signal because it's near the top of the range in 1D chart and Stochastics shows dead-crossed, suggesting the market is over bought and price dropping.

AUDJPY sell at the break of 79.82 level - STOCHASTICS REAL DEAL AUDJPY sell at the break of 79.82 level using STOCHASTICS REAL DEAL custom indicator
mid-term entry, perfect for swingtrading
You can try Stochastics Real Deal indi, just ask in comments for a free trial
This is the official link:

forexTrdr EURNZD- TESTING RESISTANCE ON DYING VOLUMESMorning traders,
Looking at a great short setup on Euro versus New Zealand Dollar on the recent move higher coming up against resistance dating back to early January at the same time as volumes are dying out- suggesting this rally up to the resistance level is running out of power to break any further higher.
This coupled with multiple indicators showing overbought levels presents a great opportunity to place a high risk reward trade.
Our chart on trading view shows the resistance level dating back to January, the RSI at overbought levels and stochastics at extreme levels near to 90. We are looking for a pullback to 1.68 area before a period of trending sideways then further weakness down to 1.67.
Good luck trading
from the Team at forexTrdr
find us on instagram, twitter and Alexa flash briefings

forexTrdr AUDNZD - SHORT INTO AUSSIE INFLATION DATAGood afternoon traders,
Looking to position ahead of tonights Australian inflation data which we expect to come in below expectations of 1.5% (yoy) in a similar manner to the recent New Zealand data. Given the data driven nature of this trade we are trading with a tight stop loss just above the previous candle wick high on 17th April.
Backing the entry of this trade is the long standing resistance around 1.07 that the market had turned lower from in the past few trading sessions in line with a declining buying volume which can be noted in our trading view chart work. We have taken a daily chart to highlight the turn over in stochastics as we look for the pair to head lower to 106 and potentially down to low 105 area should Aussie inflation disappoint overnight.
Good luck trading
from the Team at forexTrdr
find us on instagram, twitter and Alexa flash briefings

EURUSD back to bullish run, floating with 20 pips in profitOn the daily chart we've spotted a hammer candlestick showing strong rejection, alongside the Stochastics which is supporting our buy idea. If we go to the 1h chart, we can see how price broke and retested a S/R, so I'm very confident about a bullish scenario.

EURUSD new bullish trendEURUSD is struggling to climb back up, but price couldn't go lower for the past 2 years.
I'm expecting the pair to climb back up and start a bullish trend as Stochastics are indicating so.
Will buy this pair once it crosses my resistance area.

Bearish Divergence; StochasticsVery clear divergence on the 15 minute chart, as well as hidden and normal bearish divergence on the 5m charts. Make sure to look for other indicators to confirm.

AUDNZD: AUD Weakness at Channel SupportAUDNZD
Timeframe: H4
Direction: Long
Confluences for Trade:
- Waning bearish momentum
- Price action at support of downward sloping Resistance Channel
- Horizontal Trednline support close by
- Stochastics at Oversold conditions (1D and W)
- Widening gap EMAs is large
Suggested Trade:
Entry @ Area of Interest 1.0450 - 1.0510
SL: 1.0381
TP: 1.0709
RR: Approx. 2.32 (Depending on Entry Level)
May the pips move in our favor! Good luck! :D
*This trade suggestion is provided on an advisory basis. Any trade decisions made based on this suggestion is a personal decision and we are not responsible for any losses derived from it.

NEO showing Bullish Divergence on the RSI and on the Stochastic.NEO/BTC is showing bullish divergence on the 4-hour RSI and the 4-hour Stochastic. CMF is also on a support it has tested 3 times prior, so it could start turning upwards as well. NEO/BTC came down to retest it's previous bottom around 2370-2390, and formed a tweaser bottom reversal pattern on the 1-hour chart, so we could be set to see higher moves. Good risk/reward on this play so long as Bitcoin can remain steady.
Entry: 2450-2475.
Target 1: 2550
Target 2: 2700
Target 3: 2800
(Tight) SL: 2380 (Right below the tweaser bottom reversal we formed on the 1-hour chart.)
(Loose) SL: 2330-2340 (Below the double bottom support.)
--This is not financial advice. Always do your own research and come to your own conclusions before buying/investing, as investing in cryptocurrencies comes with high risk and high amounts of volatility.