UPDATE: S&P500 5-3-5 ZIGZAG CORRECTION (4H)Just an update to my post from Sept 30th. Based on the movements since then, and the fact that we have reached the previous high of about $3430, I no longer believe we are in a 3-3-5 Flat type correction. Instead, based on my updated count, I believe we are in a 5-3-5 Zigzag correction. So, I am still expecting downside on the larger time frame as I still believe we are on the final leg (Wave 5) of an Expanding Triangle which may terminate just above $2000. For the short term, I believe this upside move (Wave A) will terminate around $3475 and head down towards $3450 (Wave B). We should see another move upwards again terminating above or at $3475 to complete Wave C. At this point, I would start bulking up on short sells to ride the longer term downside move. If at anytime we breach the ATH, I will have to reassess.
Search in ideas for "zigzag"

EURAUD: ZigZag Correction Short SetupLooking to get short on EURAUD. We have a potential ABC (zigzag) correction forming and my target will be new lows for the liquidity.

OSTK ZigZag Analysis LongExpected trend for OSTK should go to around $22.00 within 150 Days and to 13-14 in 70 Days
Following the ZigZag Pattern I've seen over the past few months.
Thanks For Reading

WTI price action in bare-bones line chart and zigzagScrew projective methods and candlesticks. They introduce too much noise. Stripped to bare minimum zigzag and line chart WTI action looks surprising clear.
Colonel Kink's observation: still long still wait for clear base to show up.
See all my previous WTI observations which have been bullish till now.

BCC Descending Triangle + Double ZigZag = $600Here are my continued thoughts on BCC.
We're currently in a descending triangle and probably going to enter into a double ZigZag Elliott correction wave. Who really knows for sure, but the pattern seems tone setting up. My target is still ~$600 for now.
Check out this resource and let me know if I've missed anything: www.elliottwave.net

It becomes a ZigZag!!!After a break the development goes on (!) (look at "A nice Flat!") and it seems to become a ZigZag with an internal subdivision of 5-3-5. The oscillators are at resistance levels

NZDUSD the end of the Zigzag??The NZDUSD has reached the top of the cloud. This is also the 127% extension of the Zigzag (5-3-5) corrective pattern. Further, this is the 61% retracement of the previous down move. If the cloud holds I am expecting an impulse move down in the weeks to come.

AUDJPY zigzagthis zigzag correction is about to end.
Note the divergence which indicates
that price movement is losing momentum.
Trade will be triggered at a break below the entry level


zigzag bounce & makes an strong supportzigzag bounce & makes an strong support now it will break the falling trendline,
The targets are below,
50% - 70% - 2X - 3X

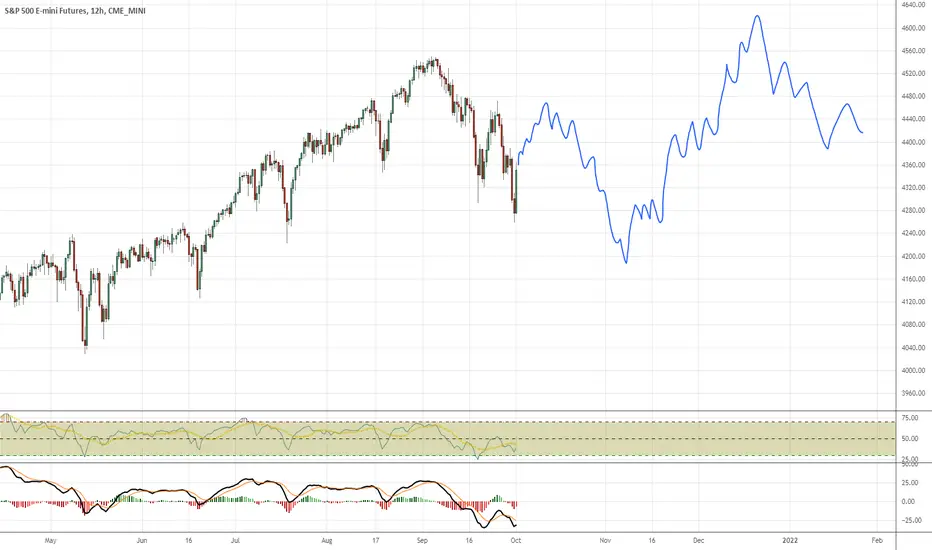
ZigZag for the Rest of 2021? (with 3 Options)ZigZag for the Rest of 2021? (with 3 Options)
Let's hope there is a Santa Rally......
ZigZag for the Rest of 2021? (with Alternatives)ZigZag for the Rest of 2021? (with Alternatives)
If the market is strong enough, the red path should do it already for a possible Santa Rally

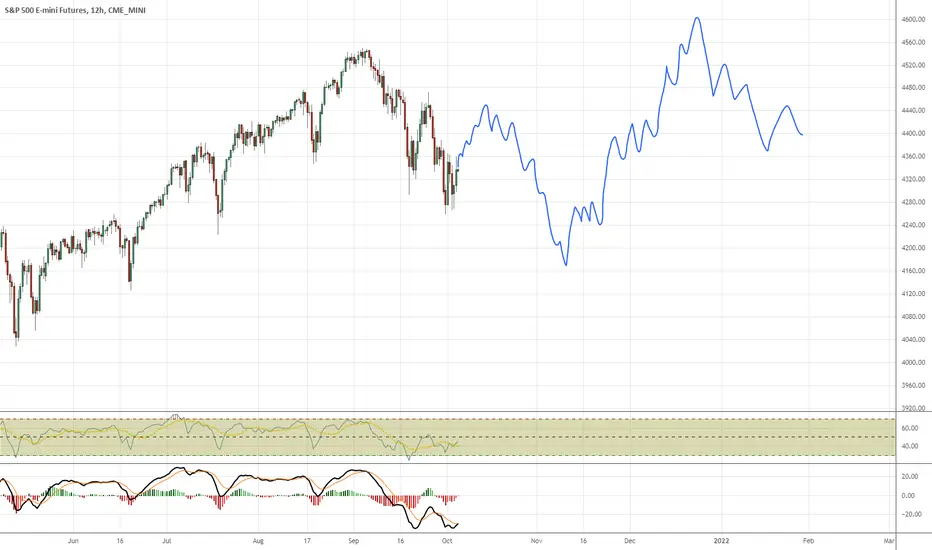
ZigZag for the Rest of 2021? (Adjusted)ZigZag for the Rest of 2021?
For a Santa Rally, the market has to drop a little deeper (below 4200 likely) to attract long term investors IMHO
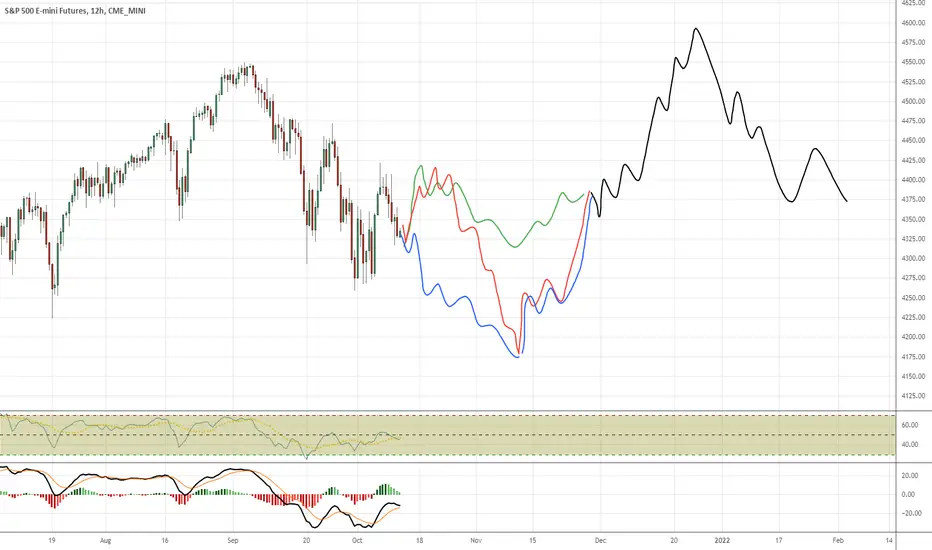
ZigZag for the Rest of 2021?ZigZag for the Rest of 2021?
For a Santa Rally, the market has to drop a little deeper to attract long term investors IMHO


zigzagit looks a simple and sharp correction for now a zigzag. we can strech longer if we come to the c target. than we can see that we going for new alt high or we go lower for a double correction.


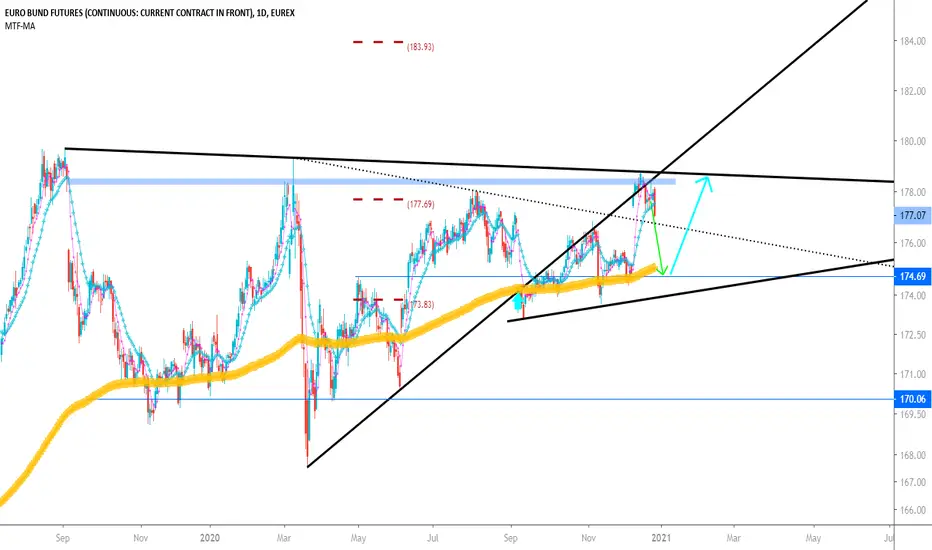
zigzagif you see dax index FDAX1! ,it want go up ,so eurobond must go down,or zigzag
i advice sell(sellstop in 1hour low) not buy