SOXL bearish double top*disclaimer*
I haven't published anything outside of the crypto markets publicly. However, I have had my eye on SOXL, Direxion Daily Semiconductor Bull 3X Shares ETF.
I originally thought that earnings for NVIDIA were going to boost the asset and asset class, however it seemed to me the night before earnings that the earnings call was already priced in.
Looking at an 8 hour hollow candle chart here going back to fall 2021 makes the picture a bit clearer for me (when in doubt zoom out).
SOXL did a bearish double top between late November 2021 and early January 2022. And now volume is kicking up heavily on the sell side. Especially when current volume is compared to moving average for volume.
If the NVIDIA earnings call wasn't enough to lift, and rumors about auto manufacturers continue to slip in through the cracks, I see plenty of downside correction left for SOXL.
That being said, this is part technical and part "buy the rumor, sell the news" analysis and I will keep my eye on this sector which has been outperforming.
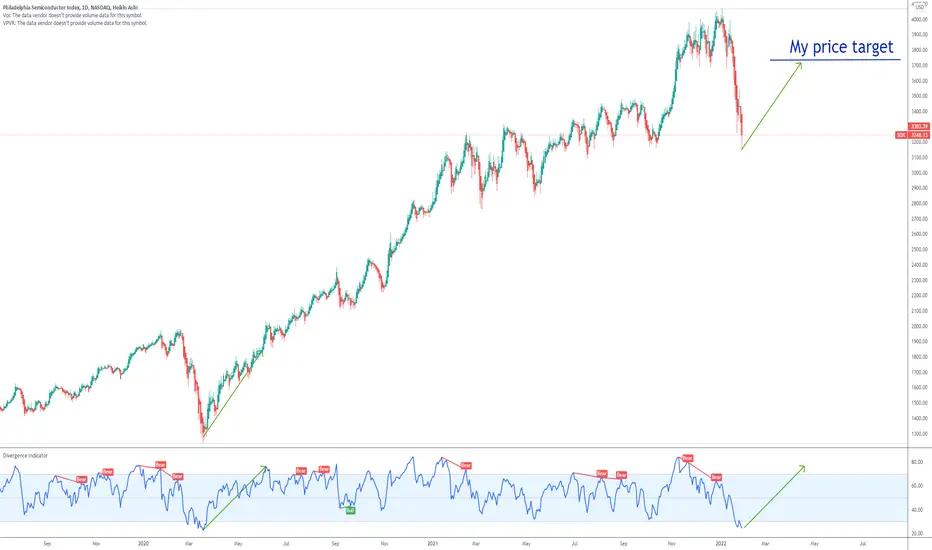
Semiconductor

SOX PHLX Semiconductor Shortage won`t be solved anytime soon !!Secretary of Commerce Gina Raimondo:
“The semiconductor situation is going to take a long time to fix”
“This is one I feel confident saying it's not going to be fixed in a month or two, or six, or 12 months.”
For now PHLX Semiconductor (^SOX) is oversold and we can see in the chart what was the price movement after the last oversold area.
I expect to be the same now, since the semiconductor shortage won`t be solved anytime soon.
My price target is 3730.
Looking forward to read your opinion about it.
🤩MU Micron Technology, Inc. Technology | Semiconductors |🤩😱Multi Year breakout worth a watch NASDAQ:MU
Micron Technology, Inc. is an American producer of computer memory and computer data storage including dynamic random-access memory, flash memory, and USB flash drives. It is headquartered in Boise, Idaho. Its consumer products are marketed under the brands Crucial and Ballistix.

SMH/SPYSemiconductors have significantly outperformed the S&P 500 since 2015
Semiconductors are today's transports

FRONTKN near term resistance at 4.00High demand and shortage of chips in the semiconductor industry will further drive technology sector higher. FRONTKN in our watchlist given its good quarter results and our BMS chart signals are still bullish. Near resistance would be the first Resistance pivot line at 4.00.

12/12/21 RMBSRambus, Inc. ( NASDAQ:RMBS )
Sector: Electronic Technology (Semiconductors)
Market Capitalization: 3.156B
Current Price: $28.86
Breakout price: $29.30
Buy Zone (Top/Bottom Range): $28.50-$27.00
Price Target: $29.70-$30.20 (1st), $30.70-$31.20 (2nd), $34.40-$35.60 (3rd)
Estimated Duration to Target: 18-19d (1st), 39-41 (2nd), 104-110d (3rd)
Contract of Interest: $RMBS 1/21/22 29c, $RMBS 2/18/22 30c, $RMBS 5/20/22 30c
Trade price as of publish date: $1.20/contract, $1.30/contract, $2.20/contract

LG Display is Looking UndervaluedFundementals:
P/E ratio at 3.5
OLED Sales gonna be higher since the holiday season
LCD Prices remain high
LG beat Q3 expectations
OLED growth going to be lucrative as LG position itself as the leader.
Technicals:
14day MA cross 50 Day MA
Bullish Reversal Pattern Formation

Trading Idea - #MTSI - Insider SellingSELL!
Entry: 69.32 USD
Target: 60.00 USD
Stop: 72.57 USD
MTSI designs and manufactures analogue semiconductor solutions for use in wireless and wireline applications in the radio frequency, microwave, millimeter wave and light spectrum for the international market. The company offers a portfolio of standard and custom components, including integrated circuits, multi-chip modules, diodes, amplifiers, switches and switch limiters, passive and active components, and subsystems.
- MTSI's share price has reached the all-time high (69.00 USD) of February 2021. A double top may be forming.
- However, the strong insider selling is remarkable. Apparently investors want to make their profits at this ATH level. This is usually a sign of falling prices.

INTRADAY! $AMD DAY TRADE PUTS? P'rice action near resistance in intraday trend.
P'T : 118 (Red Box)
Daily Chart
- Near ATH
- Overbought

$NVDA: Scoop There It Is ⤴️Recent political environments regarding Taiwan Semiconductors have highlighted the world's economy's need to wain from the dominance of TSM in the semiconductor manufacturing process, I think a great deal of money is going to come into NVDA both private and government as the US seeks to retain harmony with political rivals. This could greatly benefit Nivida's market cap, the stock has also shown how effectively it can move in massive cycle's so timing a perfect entry could be difficult through this range, but try scaling in and keeping your cost basis as low as you can.

EMAN 2023EMAN should "in theory" act as MVIS did during is run up. Looking for a test of the spring in the next few months or a continuation of the chart below

Trading Idea - #TSM - The Semiconductor LeaderBUY the BULL FLAG!
Entry: 121.80 USD
Target: 180.00 USD (47% profit)
Stop: 93.50 USD
- Taiwan Semiconductor Manufacturing Co., Ltd. is mainly engaged in the manufacture and sale of integrated circuits and semiconductor products. The company sells its products worldwide and is considered the market leader in the industry.
- TSM's financial situation is excellent, which gives it considerable investment capacity.
- TSMC negotiates with manufacturers of materials and manufacturers of machines for semiconductor manufacturing with the aim of lowering prices by 15 percent in order to increase their own profitability.
- The prices for electronic devices in which semiconductors are installed have risen by up to 20 percent in the last few months. One reason for this is delivery bottlenecks and the simultaneous increase in demand.
- From a technical chart point of view, a bullish flag could emerge. The resulting price target results from the length of the flagpole.

$KLIC $KLIC BOOM!?: Running w/ the semisSMH hitting a nice pivot today, most names look like they have blue sky territory like NVDA, MXL, ASML and now possibly KLIC? Sitting in the mid cap range, the market could see this semiconductor as the sweet spot given the Fed rate environment

$ON very tradable 9pretty chart, bullish trade for next week. Semis will likely follow $NVDA if it breaks ATH
TRT an Undervalued Semiconductor ProducerTRT's stock price has fallen in value from a yearly high of $7.50 to a $4.30 to $4.55
demand zone.
Trio-Tech has relatively strong finances when benchmarking this semi-conductor company at the 79th percentile within the semiconductor industry. This is a company that has been impacted by the economic slump created by COVID-19 and the China-United States trade war
imposed by the 45th U.S. president, Donald J. Trump, in 2019 due to TRT's operations within Southeast Asia to include China, Thailand, Malaysia, and Singapore. Despite these factors, TRT has maintained profitability as demand for semiconductors continues to surge during
the current shortage that had dampened the auto industry and continues to negatively
affect personal computers, smartphones, and other hardware.
TRT's stock price moves on an average of $0.36 cents in a day for 2021 with an average volume of
94,000. The fair value is calculated to be at $6.84/per share of TRT, much higher than the current price making TRT an attractive option for value investors.

AMD - Daily - Is Fibonacci really accountable???AMD chart, price advance beginning day to the sectional high, Fibonacci retracement calculation. Is this accountable?

TARGET HIT $ON @ 43.61 for 20..01% Profit in 47 daysTARGET HIT $ON @ 43.61 for 20..01% Profit in 47 days
Woooot!! I'll take it 💃🏻

BOE Released its Performance Forecast: Profits Might be IncreaseBOE expects to achieve a net profit of CNY 12.5 billion to CNY 12.7 billion in the first half of 2021, with a year-on-year growth of 1001% to 1018%.
On July 13, BOE Technology Group Co., Ltd. (BOE) released its 2021 semi-annual performance forecast. According to the announcement, the basic earnings per share are expected to be about CNY 0.355 to CNY 0.361, 13 times higher than that of CNY 0.026 apiece in the same period of 2020.
The announcement shows that BOE's good performance is attributed to the global semiconductor display industry's prosperity, with stronger demand and rising prices caused by the shortage of raw materials. Meanwhile, the company's mature production lines will maximize production and sales, maintaining a leading position in the LCD mainstream application market, improving profitability and the product mix.
According to BOE's 2020 financial report, the annual revenue was CNY 135.55 bn, with an increase of 16.80% year-on-year; the net profit was CNY 5.04 bn, reporting growth of 162.46%. Furthermore, the company achieved a net operating cash flow of about CNY 39.25 bn, with cash on hand of approximately CNY 73.69 bn. During the same period, BOE's overall display shipments ranked first globally, including five major application fields such as smartphones, tablets, laptops, monitors and TVs.
In addition, based on the forecast data of Sigmaintell, the firm will still rank first in the world in terms of display shipments in the five application areas of smartphones, tablets, laptops, monitors and TVs. And the market share of automotive display panels over 8 inches will also continue to remain the world's first.
Omdia, a technology research firm, predicted that BOE, TCL CSOT and HKC would become the top three global panel production capacities, accounting for 25.3%, 17.2% and 10.3% respectively.

Mi Ribbon Turn GreenFirst time trend reversal resist at EMA 200
Now 2nd time to challenge EMA 200 will have higher chance to breakout and tech sentiment very bullish
Ribbon Turn Green + Fast Turtle Buy
FiFT +ve
Retail Reducing


QCOM Qualcomm (long)Danger line, (red slashes)
the price should not drop from this line
it would not be good.
Any close above $135
means QCOM Still bullish
To me the goal is at $147
If you want to trade my recommendation is, in short term
buy at $133 sell at $ 140.5
invest at your risk trading is not probability, it is not certainty but possibilities
You can loose money. Times now are very risky for traders
Good luck
Charlie

Nordic Semiconductor $NOD gets BUY (200) from DeutcheIf the stock breaks through 50 day SMA it looks like it could start a nice bullish movement

A great buy and holdTexas Instruments is a semi conductor manufacturer that appears to have attractive growth prospects within the forecasted high growth semi conductor sector or investment theme.
Stats
The average free cash flow over the last 10 years is 29.9% with an annual dividend yield of 2.27%.
Growth in annual revenue over the last 10 years has been modest.
On average total operating expenses has seen a modest declined since 2006.
As the revenue has grown and operating expenses has declined, the margins at face value has increased. One can see this by the growth in annual gross profit.
What about the debt?
long-term debt to total assets ratio is at 0.34 or 34%. The standard debt to asset ratio is 0.37% which means that most of the debt is long term debt. The effective interest on the total debt is less than 3%. So no real problem or red flags there.
The company is however taking on more debt compared to its historical position. This isn't necessarily a bad thing provided that it is well managed and reinvested into the company. I don't like companies that take on more debt and pay high dividend yields. That's just a personal view.
With regards to the price per share. The company may be trading at a fair value based on traditional metrics and on some metrics such as price to book, it looks expensive. With a 5 year view, i think the company could be in a really good position to continue to grow its revenue particularly if you reinvest the dividends over time.
The trading signals on the weekly chart show mixed results. The Demarker and Stochastic Momentum Indicator suggest that the price may need to consolidate for a while or even retrace before it sees another upward leg. The Stochastic Relative Strength Index shows that the price may increase in the short term, however, this may be suggesting that the price may break through the 185 or 190 mark before retracing to the 160 area. This is all short term guesses.
The question is, should one buy and hold at the current price or wait for a retracement? My feeling is that it shouldn't matter to much if you are looking to hold the company for the next 5 years or more.
Please like and follow for daily posts on various asset classes. Please also share your views on the trading ideas and whether or not you find them to be of any value to you as a trader.
Please note, this idea is shared for educational and discussion purposes only and should not result in speculative investment decisions in any asset class.
