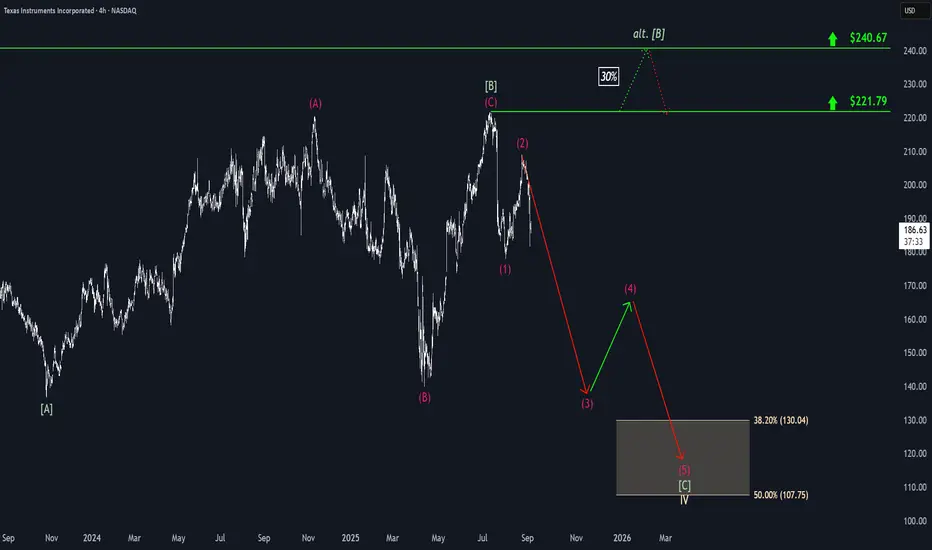
Texas Instruments: Rebound Underway, But Downside Still in PlayTexas Instruments initially continued its decline but has recently shown early signs of a rebound. Nonetheless, we still see greater downside potential in magenta wave (3), and expect the broader bearish magenta impulse to ultimately extend into the beige zone between $130.04 and $107.75. Should a new (corrective) high occur in green wave alt. above $221.79, it could temporarily postpone the anticipated sell-off. However, even in this 30% likely scenario, price would likely reverse no later than at the higher resistance level at $240.67.
Semiconductors

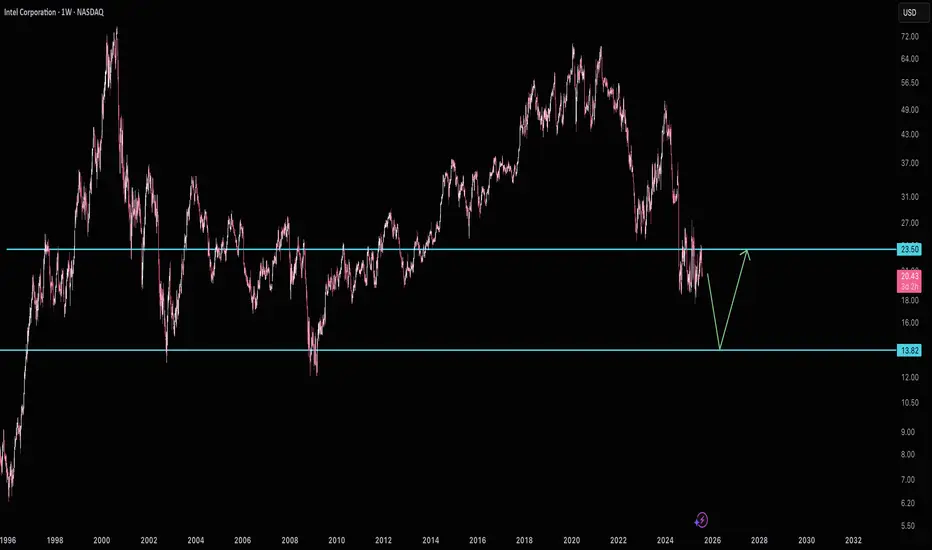
Intel | INTC | Long at $20This is going to be purely about technical analysis since Intel NASDAQ:INTC has a 90x P/E and has not proven themselves to be a viable challenger in the semiconductor market (yet...). Bad news could continue to destroy this ticker, but without that news, there could be some recovery in the near term.
The NASDAQ:INTC chart is in an overall downward trend. However, based on a few of my selected simply moving averages (SMAs), there is some predictability around support/resistance areas. Some of my favorite setups are a nice bounce on the lowest (green) selected SMA, occurring in October 2022 for a "rip then dip" to the second lowest (blue) - which it hit now. Often, but not always (I can't stress this enough), this green to blue SMA bounce represents a very strong support area during a downward trend. The other move is a further dip to retest the green SMA, but I suspect that would come with tremendously bad news for Intel... let's hope not, though.
Currently, NASDAQ:INTC is in a personal buy zone at $20.00 based on technical analysis only. A stop has been set if it drops below the blue SMA (which is may further test).
Target #1 = $28.00
Target #2 = $32.00
Target #3 = $60.00+ (very long-term, but high-risk unless fundamentals change)

Monolithic Power | MPWR | Long at $580.00Monolithic Power $NASDAQ:MPWR. If the semiconductor market continues to get attention in connection with AI, there may be a bounce here near $580.00 as NASDAQ:MPWR enters my historical simple moving average area. However, a further dip into the high $400s wouldn't surprise me (tax harvesting season is in session) and doesn't change the thesis as long as the overall trend continues to stay positive. While NASDAQ:MPWR is a strong company with growth predictions on the horizon, it has a 65x P/E, 46x price-to-cash flow, lots of insider selling, and some near-term concern if the economy shows weakness. From a technical analysis perspective, though, it's in an area of opportunity as long as semis stay a "hot" investment. Thus, at $580.00, NASDAQ:MPWR is in a personal buy zone.
Target #1 = $690.00
Target #2 = $745.00
Target #3 = $825.00
Target #4 = $908.00

SOXL 1D — With a base like this, the ride’s worth itOn the daily chart of SOXL, since early March, a textbook inverse head and shoulders pattern has formed and is now in its activation phase. The left shoulder sits at $16.67, the head at $7.21, and the right shoulder at $15.11. The symmetry is classic, with volume stabilization and a narrowing range — all the elements are in place.
The key moment was the breakout through the descending daily trendline around $19.00. Price didn’t just pierce the level — it held above it, signaling a phase shift. There was an attempt to break through the 0.5 Fibonacci level at $19.60, which led to a pullback — not on heavy selling, but on decreasing volume. This wasn’t a rejection, it was a pause.
This pullback serves as a retest of the breakout zone and the 20-day moving average. The overall structure remains bullish: price stays above all key EMAs and MAs, RSI climbs past 60, and the candlestick structure is stable. Volume rises during up moves and fades during pullbacks — classic signs of reaccumulation.
The measured target from the pattern is $32.00, calculated from the head-to-neckline height projected from the breakout point. As long as price holds above $18.40, the setup remains intact. A break above $19.60 with confirmation would open the door to acceleration.
This isn’t a momentum play — it’s a setup months in the making. The structure is there, the confirmation is there, and most importantly — the price behavior makes sense. With a base like this, the ride ahead looks worth taking.

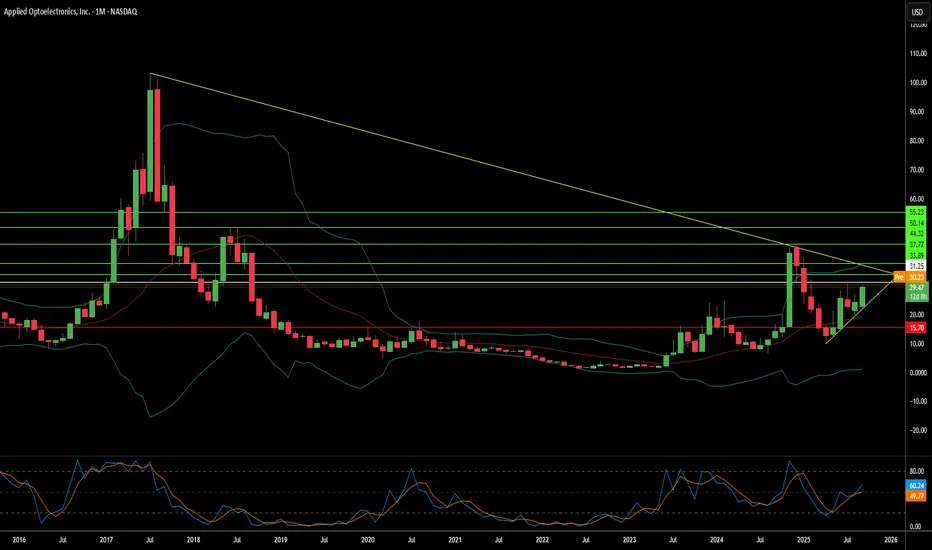
Can a Small-Cap Survive the AI Data Revolution?Applied Optoelectronics (AAOI) represents a high-stakes investment proposition at the intersection of artificial intelligence infrastructure and geopolitical supply chain realignment. The small-cap optical networking company has positioned itself as a vertically integrated manufacturer of advanced optical transceivers, leveraging proprietary laser technology to serve hyperscale data centers, driving the AI boom. With 77.94% year-over-year revenue growth reaching $368.23 million in FY 2024, AAOI has successfully re-engaged a major hyperscale customer and begun shipping 400G datacenter transceivers, marking a potential turnaround from its 2017 customer loss that previously crushed its stock performance.
The company's strategic pivot centers on transitioning from lower-margin products to high-performance 800G and 1.6T transceivers while simultaneously relocating manufacturing capacity from China to Taiwan and the United States. This supply chain realignment, formalized through a 15-year lease for a New Taipei City facility signed in September 2025, positions AAOI to benefit from domestic sourcing preferences and potential government incentives like the CHIPS Act. The optical transceiver market, valued at $13.6 billion in 2024 and projected to reach $25 billion by 2029, is driven by substantial tailwinds, including AI workloads, 5G deployment, and hyperscale data center expansion.
However, AAOI's financial foundation remains precarious despite impressive revenue growth. The company reported a net loss of $155.72 million in 2024 and carries over $211 million in debt while facing ongoing share dilution from equity offerings that increased outstanding shares from 25 million to 62 million. Customer concentration risk persists as a fundamental vulnerability, with data centers representing 79.39% of revenue. External scrutiny has questioned the viability of the Taiwan expansion, with some reports characterizing the 800G production story as an "optical illusion" and raising concerns about the readiness of manufacturing facilities.
The investment thesis ultimately hinges on execution risk and competitive positioning in a rapidly evolving technology landscape. While AAOI's vertical integration and proprietary laser technology provide differentiation against giants like Broadcom and Lumentum, emerging co-packaged optics (CPO) technology threatens to disrupt traditional pluggable transceivers. The company's success depends on successfully ramping 800G production, operationalizing the Taiwan facility, achieving consistent profitability, and maintaining its re-engaged hyperscale customer relationships. For investors, AAOI represents a classic high-risk, high-reward opportunity, where strategic execution could deliver significant returns; however, financial vulnerabilities and operational challenges present substantial downside risks.
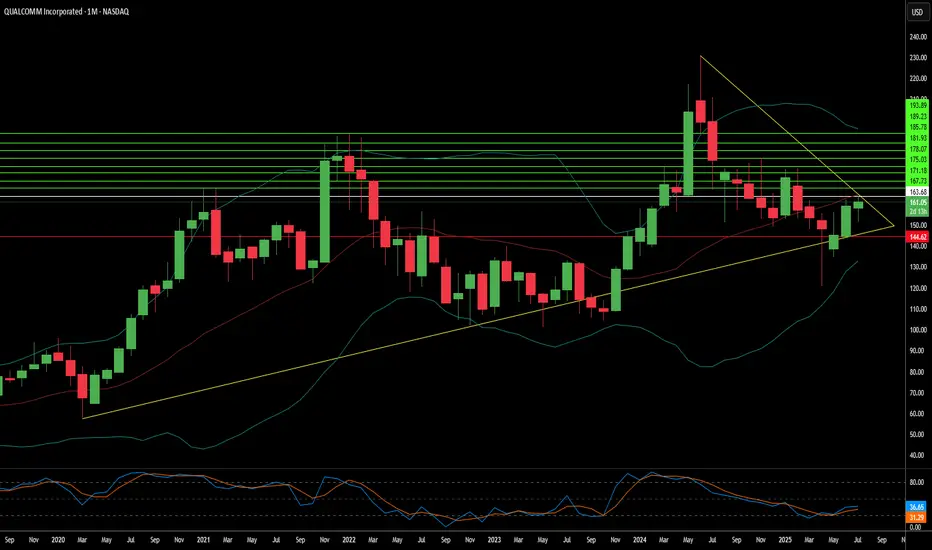
QCOM | Consolidation Almost Done | LONGQUALCOMM, Inc. engages in developing and commercializing foundational technologies and products used in mobile devices and other wireless products. It operates through the following segments: Qualcomm CDMA Technologies (QCT), Qualcomm Technology Licensing (QTL), and Qualcomm Strategic Initiatives (QSI). The QCT segment develops and supplies integrated circuits and system software based on technologies for use in voice and data communications, networking, application processing, multimedia, and global positioning system products. The QTL segment grants licenses and provides rights to use portions of the firm's intellectual property portfolio. The QSI segment focuses on opening new or expanding opportunities for its technologies and supporting the design and introduction of new products and services for voice and data communications. The company was founded by Franklin P. Antonio, Adelia A. Coffman, Andrew Cohen, Klein Gilhousen, Irwin Mark Jacobs, Andrew J. Viterbi, and Harvey P. White in July 1985 and is headquartered in San Diego, CA.

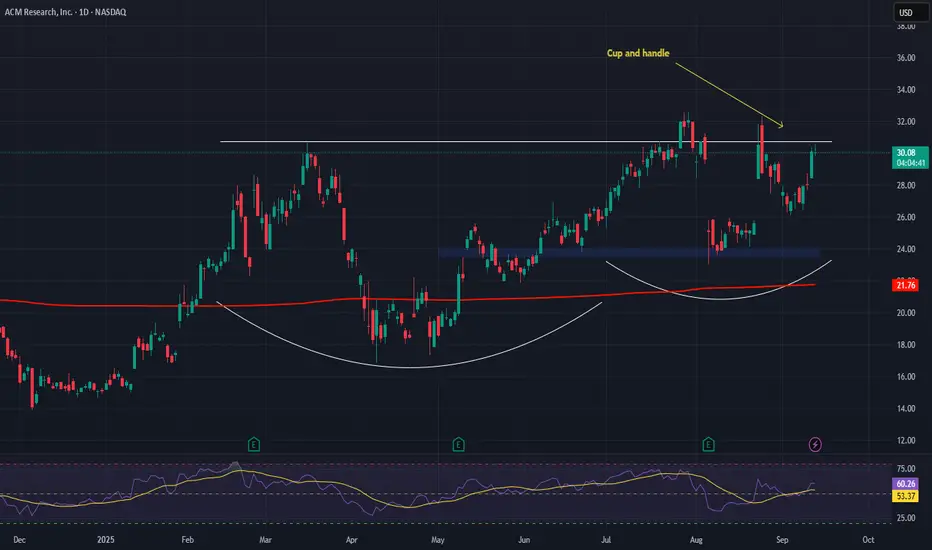
ACM Research (ACMR) —Expanding Share in China’s $35B Semi MarketCompany Overview:
ACM Research, Inc. NASDAQ:ACMR develops advanced wet cleaning and process tools that enhance chip fabrication yields, offering exposure to the fast-growing semiconductor equipment sector.
Key Catalysts:
China localization tailwinds: ACMR currently holds ~14% market share in China’s $35B wafer equipment market, with potential to reach 25% by 2030.
Technology leadership: The upgraded Ultra Cwb cleaning tool improves chip production efficiency, driving both revenue growth and margin expansion.
Scalability & supply chain control: Ongoing capacity growth at the Lingang facility strengthens operational scale and competitive positioning.
Investment Outlook:
Bullish above: $23.50–$24.00
Upside target: $50.00–$52.00, backed by China demand, tech upgrades, and facility expansion.
#ACMR #Semiconductors #ChinaTech #Chipmaking #Localization #TechGrowth #Investing
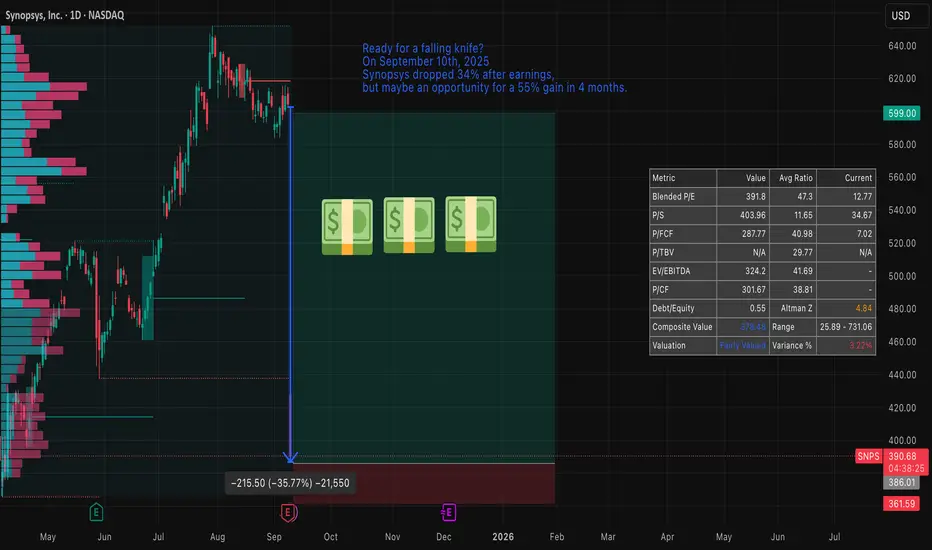
Synopsys — a sharp sell-off, risky entry and clear opportunitySynopsys plunged roughly 30–34% on 10 September 2025, wiping out a large chunk of market value after quarterly results missed expectations and guidance was cut. That kind of move often feels like a “falling knife”: attractive on paper, dangerous in practice.
Price action and technical context
The stock has gapped lower and left a sizeable down-gap to fill. From a technical viewpoint the setup resembles a fast, impulsive sell-off inside a broader downtrend established since the spring; price is now testing levels that were former support in April 2025. Short-term momentum indicators show oversold readings, but volatility is elevated and trend-following measures still favour the downside until a reliable base is formed.
Key technical reference points to watch:
Gap zone/topside resistance: around the pre-drop range near the mid-$600s.
Immediate support / stop placement: just below the April 2025 lows (your stated stop).
Possible gap-fill target: if the market rotates back, reclaiming the gap by January 2026 implies roughly a ~55% upside from current depressed levels (as you noted).
Fundamentals and why this remains an opportunity
Despite the headline shock, Synopsys’s underlying business remains high-quality:
Market-leading positions in EDA tools and IP libraries.
Strong, recurring revenue mix (software subscriptions and maintenance).
Long secular tailwinds from AI, advanced node design and chiplet modularity.
Valuation has re-rated materially after the drop — the company is no longer priced at the frothy multiples of earlier in the cycle. Analysts have revised estimates downward but many still target stock levels clustered around $600, reflecting belief in recovery by late 2025 / early 2026.
Options flow and timing
There is notable open interest concentration in both calls and puts around the $600 strike with expiries in December 2025 and January 2026. That concentration suggests the market expects meaningful activity/interest around that level into the winter and gives a window where a gap-fill or relief rally could materialize before January expiries.
Risk management and trade plan
Trade type: speculative rebound / gap-fill play, not a buy-and-forget investment.
Target: gap-fill / recovery toward pre-drop levels by January 2026 — roughly +55% potential from current depressed price (per your scenario).
Stop: just below April 2025 lows (limits downside if the downtrend resumes).
Position sizing: small relative to portfolio — treat as a high-volatility, event-driven trade.
Alternatives: consider defined-risk option structures (e.g., debit spreads) to cap downside while retaining upside exposure to a gap fill.
Catalysts to monitor
Any updates to guidance or profitability from Synopsys management.
China demand/FX developments and IP licensing commentary.
Options positioning into December 2025 / January 2026 expiries.
Broader semiconductor capital spending and AI-related design win announcements.
Technical indicators to watch
200DMA and April lows (support/resistance anchors).
RSI(14) and MACD for bullish divergence and momentum confirmation.
Volume on any recovery day — strong volume on up days increases odds of a sustained bounce.
Bottom line
This is a high-risk, high-reward setup: a classic “ falling knife ” that can be dangerous if you’re early, but presents a credible opportunity because Synopsys’s fundamentals remain solid, valuation is more attractive, and market positioning (options interest near $600) favors a potential recovery window through January 2026. Use tight risk controls (stop under April lows) and consider defined-risk option plays if you prefer limited downside.
TSMC: AI Chip Titan – Still the King or Facing New Challengers?Good morning, everyone! ☀️ TSMC: AI Chip Titan – Still the King or Facing New Challengers?
(1/9)
TSMC’s riding the AI wave with record Q4 2024 profits, but with U.S.-China curbs and fab delays, is this semiconductor king untouchable or at a crossroads? Let’s unpack it! 🔍
(2/9) – PRICE PERFORMANCE 📊
• Q4 2024: Net income up 57% to $11.4B, revenue climbed 39% 💰
• Full Year 2024: Revenue hit $87.1B, up 34% from 2023 📏
• Sector Trend: AI chip demand soaring, per Reuters 🌟
It’s a powerhouse, driven by tech’s hunger! ⚙️
(3/9) – MARKET POSITION 📈
• Market Share: Over 60% of global foundry market 🏆
• Clients: Apple, Nvidia, AMD—big names rely on ‘em ⏰
• Trend: Expanding fabs in U.S., Japan, Germany 🎯
Firm, holding the throne but not without battles! 🚀
(4/9) – KEY DEVELOPMENTS 🔑
• Q4 Earnings: Record $11.4B profit, per Jan 16 Reuters 🔄
• Expansion: Arizona fab faces delays, full ops by 2027? 🌍
• Market Reaction: Shares up 81% in 2024, still strong 📋
Adapting, with global eyes on its moves! 💡
(5/9) – RISKS IN FOCUS ⚡
• Geopolitics: U.S.-China export curbs hit demand 🔍
• Costs: U.S. fab chips 50% pricier than Taiwan 📉
• Talent: Lack of skilled U.S. workers slows growth ❄️
Tough, but risks loom large! 🛑
(6/9) – SWOT: STRENGTHS 💪
• Profit Surge: 57% net income jump in Q4 2024 🥇
• Tech Lead: 5nm mass production, 3nm in R&D 📊
• Client Base: Powers Apple, Nvidia, more 🔧
Got silicon in the tank! 🏦
(7/9) – SWOT: WEAKNESSES & OPPORTUNITIES ⚖️
• Weaknesses: High U.S. fab costs, talent gaps 📉
• Opportunities: AI chip demand, new fabs in Japan, EU 📈
Can it keep the lead amid global shifts? 🤔
(8/9) – 📢TSMC’s Q4 profit up 57%, AI booming, your take? 🗳️
• Bullish: Still the king, long-term winner 🐂
• Neutral: Steady, but risks weigh ⚖️
• Bearish: Curbs and costs slow growth 🐻
Chime in below! 👇
(9/9) – FINAL TAKEAWAY 🎯
TSMC’s record profits signal AI dominance 📈, but U.S.-China curbs and fab delays add caution 🌿. Volatility’s our friend—dips are DCA gold 💰. Grab ‘em low, climb like pros! Gem or bust?

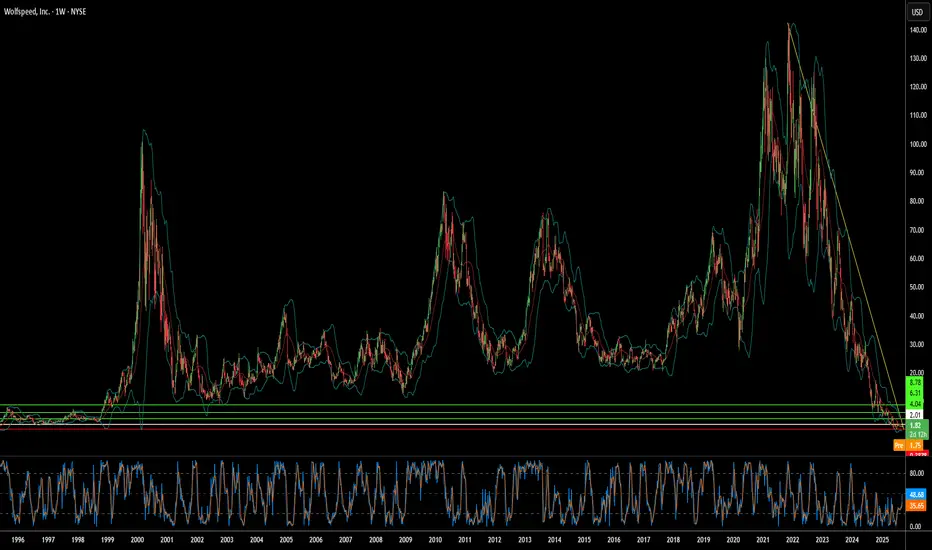
Can Silicon Carbide Save a Bankrupt Chip Giant?Wolfspeed's dramatic 60% stock surge following court approval of its Chapter 11 restructuring plan signals a potential turning point for the struggling semiconductor company. The bankruptcy resolution eliminates 70% of Wolfspeed's $6.5 billion debt burden and reduces interest obligations by 60%, freeing up billions in cash flow for operations and new fabrication facilities. With 97% creditor support backing the plan, investors appear confident that the financial overhang has been cleared, positioning the company for a cleaner emergence from bankruptcy.
The company's recovery prospects are bolstered by its leadership position in silicon carbide (SiC) technology, a critical component for electric vehicles and renewable energy systems. Wolfspeed's unique capability to produce 200mm SiC wafers at scale, combined with its vertically integrated supply chain and substantial patent portfolio, provides competitive advantages in a rapidly growing market. Global EV sales exceeded 17 million units in 2024, with projections of 20-30% annual growth, while each new electric vehicle requires more SiC chips for improved efficiency and faster charging capabilities.
Geopolitical factors further strengthen Wolfspeed's strategic position, with the U.S. CHIPS Act providing up to $750 million in funding for domestic SiC manufacturing capacity. As the U.S. government classifies silicon carbide as critical for national security and clean energy, Wolfspeed's fully domestic supply chain becomes increasingly valuable amid rising export controls and cybersecurity concerns. However, the company faces intensifying competition from well-funded Chinese rivals, including a new Wuhan facility capable of producing 360,000 SiC wafers annually.
Despite these favorable tailwinds, significant risks remain that could derail the recovery. Current shareholders face severe dilution, retaining only 3-5% of the restructured equity, while execution challenges persist regarding ramping the novel 200mm fabrication technology. The company continues operating at a loss with high enterprise value relative to current financial performance, and expanding global SiC capacity from competitors threatens to pressure pricing and market share. Wolfspeed's turnaround represents a high-stakes bet on whether technological leadership and strategic government support can overcome financial restructuring challenges in a competitive marketplace.
MPWR | Another Long Term Runner | LONGMonolithic Power Systems, Inc. designs, develops, and markets integrated power semiconductor solutions and power delivery architectures for computing and storage, automotive, industrial, communications, and consumer applications markets. It offers direct current (DC) to DC integrated circuits (ICs) that are used to convert and control voltages of various electronic systems, such as portable electronic devices, wireless LAN access points, computers and notebooks, monitors, infotainment applications, and medical equipment. The Firm also provides lighting control ICs for backlighting that are used in systems, which provide the light source for LCD panels in notebook computers, monitors, car navigation systems, and televisions, as well as for general illumination products. The company was founded by Michael R. Hsing, and James C. Moyer on August 22, 1997, and is headquartered in Kirkland, WA.

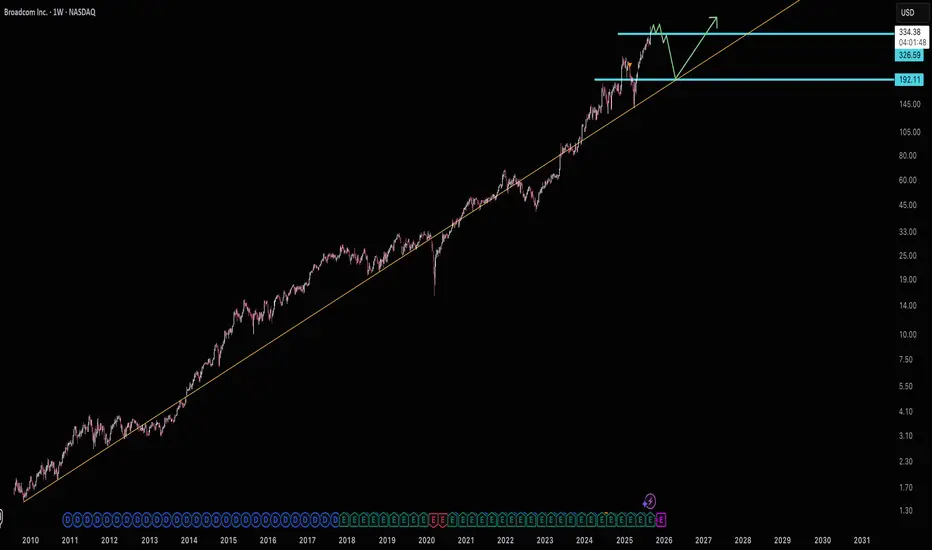
Broadcom at ResistanceBroadcom is at $326 resistance. It's accelerated well past it's historical trend line. This brings up concerns of over excitement.
While IXCO and SOX are still showing room for semiconductors to run as a broad group I would speculate AVGO is likely going to be left out as NVDA catches up. (NVDA hit it's current trend line this morning)
I'm expecting IXCO and SOX to hit resistance the end of this year. So until then I'm speculating AVGO is going to consolidate around current 326 resistance and eventually break down towards it's long term trend line.
I'm marking this Idea as "short" because I have a sideways/downward bias, but I personally am not actually shorting AVGO. When IXCO tops out there will be much better tech stocks to short.
Good luck!
Texas Instruments: Second Leg Down CompleteTexas Instruments has experienced sharp sell-offs, leading us to confirm the top of magenta wave (2). This suggests that the stock has completed the second stage of the ongoing magenta downward impulse. The current wave (3) still presents significant downside potential in the near term. After a brief recovery in wave (4), wave (5) is expected to reach our beige Target Zone between $130.04 and $107.75. A new corrective high in green wave alt. above $221.79 could delay this process. However, in this 30% likely scenario, TXN should reverse course at the latest by the $240.67 level.
Trading AMAT to $165Applied Materials has been playing the earnings beat game fine for the past two quarters, but the forecast for Q4 is a full stop on optimism. The demand slump in China and export license chaos has them guiding way below expectations. Pretty sure investors didn’t appreciate the plot twist—stock fell between 11% to 14% depending on the source.

Can the World's Most Critical Company Survive Its Own Success?Taiwan Semiconductor Manufacturing Company (TSMC) stands at an unprecedented crossroads, commanding 67.6% of the global foundry market while facing existential threats that could reshape the entire technology ecosystem. The company's financial performance remains robust, with Q2 2025 revenue reaching $30.07 billion and over 60% year-over-year net income growth. Yet, this dominance has paradoxically made it the world's most vulnerable single point of failure. TSMC produces 92% of the world's most advanced chips, creating a concentration risk where any disruption could trigger global economic catastrophe exceeding $1 trillion in losses.
The primary threat comes not from a direct Chinese invasion of Taiwan, but from Beijing's "anaconda strategy" of gradual economic and military coercion. This includes record-breaking military flights into Taiwan's airspace, practice blockades, and approximately 2.4 million daily cyberattacks on Taiwanese systems. Simultaneously, U.S. policies create contradictory pressures—while providing billions in CHIPS Act subsidies to encourage American expansion, the Trump administration has revoked export privileges for TSMC's Chinese operations, forcing costly reorganization and individual licensing requirements that could cripple the company's mainland facilities.
Beyond geopolitical risks, TSMC faces an invisible war in cyberspace, with over 19,000 employee credentials circulating on the dark web and sophisticated state-sponsored attacks targeting its intellectual property. The recent alleged leak of 2nm process technology highlights how China's export control restrictions have shifted the battleground from equipment access to talent and trade secret theft. TSMC's response includes an AI-driven dual-track IP protection system, which manages over 610,000 cataloged technologies and extends security frameworks to global suppliers.
TSMC is actively building resilience through a $165 billion global expansion strategy, establishing advanced fabs in Arizona, Japan, and Germany while maintaining its technological edge with superior yields on cutting-edge nodes. However, this de-risking strategy comes at a significant cost - Arizona operations will increase wafer costs by 10-20% due to higher labor expenses, and the company must navigate the strategic paradox of diversifying production while keeping its most advanced R&D concentrated in Taiwan. The analysis concludes that TSMC's future hinges not on current financial performance, but on successfully executing this complex balancing act between maintaining technological leadership and mitigating unprecedented geopolitical risks in an increasingly fragmented global order.

$AVGO: Broadcom – AI Chip Powerhouse or Tariff Tightrope?(1/9)
Good morning, crew! ☀️ NASDAQ:AVGO : Broadcom – AI Chip Powerhouse or Tariff Tightrope?
With NASDAQ:AVGO at $194.94 after a Q1 earnings slam dunk, is this semiconductor star riding the AI wave to glory or teetering on trade war woes? Let’s unpack the circuits! 🔍
(2/9) – PRICE PERFORMANCE 📊
• Current Price: $ 194.94 as of Mar 10, 2025 💰
• Q1 2025: Revenue $14.92B (up 23% YoY), EPS $1.60 📏
• Movement: Up 10% post-earnings Mar 6, +8.6% Mar 7 🌟
It’s buzzing like a chip factory on overdrive! ⚡
(3/9) – MARKET POSITION 📈
• Market Cap: ~$93.5B (151.62M shares) 🏆
• Operations: AI chips, software solutions ⏰
• Trend: 42% of 2024 revenue from software, per web data 🎯
A heavyweight in the AI silicon ring! 🌐
(4/9) – KEY DEVELOPMENTS 🔑
• Earnings: Q1 beat with $14.92B, Q2 forecast tops estimates 🔄
• AI Boom: Custom chips fuel hyperscaler demand 🌍
• Sentiment: Shares rallied, per Mar 6-7 posts 📋
Thriving, wired for the future! 💡
(5/9) – RISKS IN FOCUS ⚠️
• Tariffs: Trade uncertainties loom, per web reports 🔍
• Competition: Nvidia, Marvell in the race 📉
• Valuation: Premium pricing raises eyebrows ❄️
High stakes, but risks are on the radar! 🕵️
(6/9) – SWOT: STRENGTHS 💪
• Q1 Win: $14.92B revenue, EPS $1.60 beat 🥇
• AI Edge: 77% AI revenue growth in Q1 📊
• Forecast: Q2 sales outlook shines 🔧
Powered up for the AI era! 🔋
(7/9) – SWOT: WEAKNESSES & OPPORTUNITIES ⚖️
• Weaknesses: Tariff risks, high valuation 📉
• Opportunities: 18% earnings growth projected 📈
Can it outrun trade clouds and soar? 🤔
(8/9) – 📢Broadcom at $194.94, AI chips sizzling—your vibe? 🗳️
• Bullish: $220+ by June, AI rules 🐂
• Neutral: Stable, tariffs balance ⚖️
• Bearish: $170 slide, risks bite 🐻
Drop your pick below! 👇
(9/9) – FINAL TAKEAWAY 🎯
Broadcom’s $14.92B Q1 haul screams AI strength 📈, but tariff shadows hover 🌫️. Volatility’s our sidekick—dips are DCA dynamite 💰. Snap ‘em up, ride the surge! Goldmine or gamble?

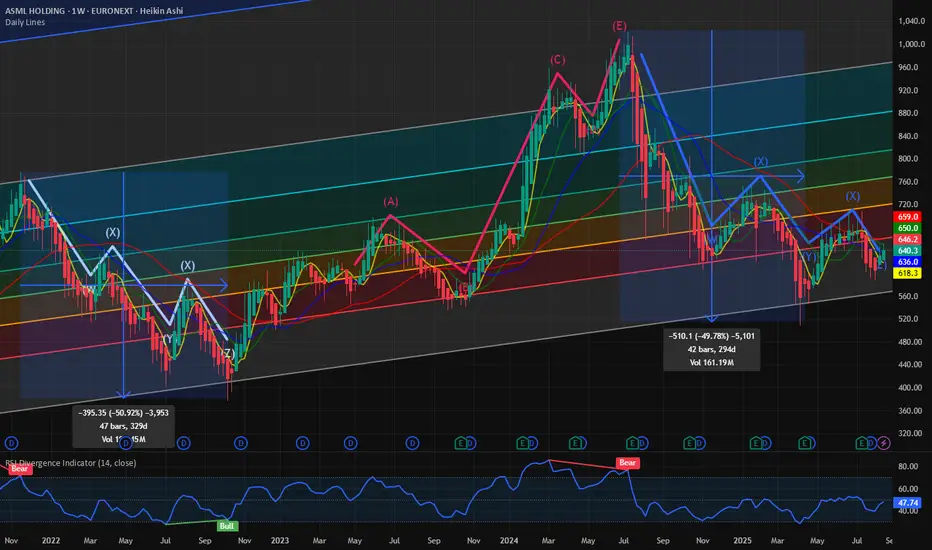
$ASML: Is the stock primed for upside? Indicators are aligned.NASDAQ:ASML is one of the very few semis cap equipment cos. which have not broken out of their previous ATH. The stock is still at lower bound of the upward slopping channel which we have been following for a few months in this blog.
IN this chart below we are following a combination of various technical indicators to see the path of least resistance for the stock. The stock every time bounces back from the lower bound of the upward slopping fib retracement channel. During the 2022 bear market the stock made lower lows and after 5th leg of the bearish pattern on the Elliot’s wave the stock finally made its lows after 329 days of trading and down almost 50%. From its lows it also perfectly followed a textbook rally in 5 legs perfectly matching a bullish Eliots wave pattern before reaching ATH of 1030 $. The recent drawdown on the stock also happened when the stock went above the channel and was slammed back into penalty box by the sellers.
Surprisingly the stock also followed the same Eliots wave bearish pattern downwards and the price bottomed at the lows of the channel now almost 2 times in the weekly chart shown below. Each time the stock had a drawdown of almost 50% in 2 instances. As the stock is going sideways for quite a few weeks we can expect some bullish price action with 980 $ in the upper limit.
Verdict: NASDAQ:ASML in an accumulation pattern. Major upside expected with 980 as our price target.
NVDA NVIDIA Price Target by Year-EndNVIDIA Corporation (NVDA) remains a dominant force in the AI and semiconductor markets, with its forward price-to-earnings (P/E) ratio currently at 19.37—a reasonable valuation considering its growth trajectory and market position.
NVIDIA’s leadership in the AI sector, particularly through its cutting-edge GPUs, has driven strong demand from data centers, cloud providers, and AI developers. The company’s recent product launches, including the Hopper and Blackwell architectures, have further solidified its competitive edge.
Despite recent market volatility, NVIDIA's consistent revenue growth and expanding profit margins support the bullish case. The current P/E of 19.37 reflects a balanced risk-reward profile, suggesting that the stock is not overvalued despite its impressive performance.
A price target of $145 by year-end reflects approximately 15% upside from current levels, driven by sustained AI demand and growing market penetration. Investors should watch for quarterly earnings reports and updates on AI chip demand, as these will likely act as key catalysts for upward momentum.

Broadcom Middle of Range RisksI like Broadcom if it gets down to $178. Right now it's still floating from the AAPL news. I wouldn't be inclined to sell here, but if looking to buy (like myself) I'd wait in hopes for $178.
Target (Potential Next Support) $302.
Good luck!

AMD: Potential Mid-Term Reversal from Macro SupportPrice has reached ideal macro support zone: 90-70 within proper proportion and structure for at least a first wave correction to be finished.
Weekly
As long as price is holding above this week lows, odds to me are moving towards continuation of the uptrend in coming weeks (and even years).
1h timeframe:
Thank you for attention and best of luck to your trading!

Intel looks to want $13Intel looks to be waiting below $24 resistance for $13 support. I wouldn't short it at it's current price, but I would be patient and wait for $13 if you're looking to buy. Good luck!
Qualcomm: Beyond the Smartphone Storm?Qualcomm (NASDAQ:QCOM) navigates a dynamic landscape, demonstrating resilience despite smartphone market headwinds and geopolitical complexities. Bernstein SocGen Group recently reaffirmed its "Outperform" rating, setting a \$185.00 price target. This confidence stems from Qualcomm's robust financials, including a 16% revenue growth over the last year and strong liquidity. While concerns persist regarding potential Section 232 tariffs and Apple's diminishing contribution, the company's strategic diversification into high-growth "adjacency" markets like automotive and IoT promises significant value. Qualcomm currently trades at a substantial discount compared to the S&P 500 and the Philadelphia Semiconductor Index (SOX), signaling an attractive entry point for discerning investors.
Qualcomm's technological prowess underpins its long-term growth narrative, extending far beyond its core wireless chipmaking. The company aggressively pushes **on-device AI**, leveraging its Qualcomm AI Engine to enable power-efficient, private, and low-latency AI applications across various devices. Its Snapdragon platforms power advanced features in smartphones, PCs, and the burgeoning **automotive sector** with the Snapdragon Digital Chassis. Further expanding its reach, Qualcomm's recent acquisition of Alphawave IP Group PLC targets the data center market, enhancing its AI capabilities and high-speed connectivity solutions. These strategic moves position Qualcomm at the forefront of the **high-tech revolution**, capitalizing on the pervasive demand for intelligent and connected experiences.
The company's extensive **patent portfolio**, encompassing over 160,000 patents, forms a critical competitive moat. Qualcomm's lucrative Standard Essential Patent (SEP) licensing program generates substantial revenue and solidifies its influence across global wireless standards, from 3G to 5G and beyond. This intellectual property leadership, combined with a calculated pivot away from its historical reliance on a single major customer like Apple, empowers Qualcomm to pursue new revenue streams. By aiming for a 50/50 split between mobile and non-mobile revenues by 2029, Qualcomm strategically mitigates market risks and secures its position as a diversified technology powerhouse. This assertive expansion, alongside its commitment to dividends, underscores a confident long-term outlook for the semiconductor giant.
Semiconductors & SOXL: A Bull ThesisWhy Semiconductors?
Virtually every single electronic device contains some form of a semiconductor unit within its components. The entire Bull theory on semiconductors as an industry could be reduced to this one sentence. The following, however, will introduce concepts contingent to the understanding of what is shaping the market for semiconductors. The weight of intra-industry, political, macroeconomic, and physical factors discerning an inconceivable upside potential for certain investments carrying maximum exposure to the sector, such as AMEX:SOXL . The last section contains my technical approach to trading SOXL.
We begin with the fundamental, and by fundamental, I refer to the simplest reasons for what is happening in the market up until now; [ Early morning Monday, 7/28 ].
Macroeconomic Context
Like essentially the rest of the market, SOXL hit its 1 year low of 7.23 USD on Monday, 4/7, following the announcement (and soon postponement) of global tariffs at levels not observed since the early 30's. This of course sparked a panic spiral in the entire market, leading to outflows from the S&P 500 of approximately 70 billion USD during the month of April. During this time we also saw a new, but familiar narrative emerge. Asset Managers, Such as J.P. Morgan set historically low price targets on the S&P 500, going as low as 5,200 USD. They reinforced their PTs with publications warning investors across the world that the risk of recession in the United States was raised to 80%, and this message was relayed across all media in parabolic fashion. While it does not seem too outward to assume an increased risk of recession due to tariffs by looking back on what we learned of the consequences from the Smoot-Hawley Tariff Act of 1930. There exists a widely overlooked, fundamental , reason as to why I can claim that the REAL risk of recession at the time that J.P. Morgan assigned an 80% risk of recession, was in actuality, 0% (I assume J.P. Morgan knew this but pushed the narrative anyways in order to acquire massive equity at a discount). If anyone has taken introductory macroeconomics in their lifetime, they may be familiar with the function for calculating GDP via the expenditure approach: GDP = C + I + G - NX. Now, why am I referencing high school/college economics basics, the answer to that lies in how we determine our rate of economic growth in the context of tariffs. The part of this formula that we must focus on is NX or Net Exports, the negative factor to GDP. Tariffs, if implemented would effectively decrease import volume, resulting in a smaller Net Exports, and ultimately a higher GDP calculation. Now, what makes this scenario unique, the tariffs having been postponed shortly after their inception, allowed US retailers to engage in front running, or the accelerated purchasing of foreign goods in advance of tariffs. During the month of April, we saw a 5.4% increase in import volume in US west coast ports. This increase in imports effectively caused the inverse impact on GDP growth that import tariffs themselves would have caused: front-running lead to import uptick, leading to a greater Net Exports, which results in lower (negative) GDP growth. Essentially, tariffs in the short-term increases GDP growth (in the long term deadweight loss, and cost structure distortion comes in to play, but that doesn't matter yet), however , tariffs that are announced but not immediately implemented will result in a lower GDP growth, coupled with uncertainty surrounding the whole situation that translated into a cut in CapEx as companies scrambled to determine if tariffs would f*ck them over or not. This argument is further supported by the trends observed in the foreign exchange market. You may have heard in the news that we are experiencing a period of "Dollar Weakness", and while, yes, you can clearly see that the USD has fared rather poorly against other currencies in most major dollar pairs over the past few months. The agent behind this isn't just that the dollar happens to be weak, it is a combination of factors that generate noise and volatility in the forex market. The two main factors highlighted by the media are 1. The obvious political policy instability, pushing bond yields higher, plus a significant debt ceiling raise as per the BBB and 2. the expectations of interest rate cuts over the next year. The other, less recognized major factor to dollar weakness is exactly what we described above: Increased imports means more dollars flowing out of the economy. When these dollars land abroad, they are converted into the native currency, driving down the demand for the dollar. Notice how none of the reasons described above, actually have anything to do with what truly drives foreign exchange markets. Over time, the strength/weakness of a currency is directly correlated to the strength/weakness of the underlying economy. To say that we can expect dollar weakness due to the aforementioned reasons outright ignores the economic growth potential that exists in our economy at this current time, subsiding the out-of-proportion tariff fears as a proponent to an economic crisis. In an all-encompassing view, what I would describe to be occurring on the macro level is a sort of "slingshot" effect: Trade imbalances and private sector response to policy unclarity results in a pullback in economic growth, one that we are now experiencing as a short-term effect. From a medium-long term perspective, assuming that tariffs aren't persistent in the long term, we would see full fledge economic boom, driven by non other than the growth of our technology sector, which at it's core, lies the almighty semiconductor.
Growth of AI as a driver of Semiconductor demand: Stable trajectory or Bubble Territory?
Having laid the economic framework for picking the general direction our market is heading in, we can now begin to talk about the internal combustion occurring within the world of technology, and the two letter term associated with just about every cool thing in the business world, that is of course AI. Now just to clarify, AI is not new, its been around for at least 20 years and has a well established role in the world prior to the existence of ChatGPT. What changed so drastically in recent years is the breakthrough into a new form of artificial intelligence, known as "Artificial General Intelligence" or AGI. Long story short: AGI's primary difference in the business context is the colossal amount of electrical infrastructure and computing power that is demanded by the development of these mega language models. As a result of the high barrier for entry to this new industry, only 5 AGI companies have arisen to the global stage: OpenAI, Google DeepMind, Anthropic, Microsoft, and DeepSeek. Increasing competition in this space through more players entering the market is unlikely at this time as the cost to create a standalone AGI model is so astronomical. This is a particularly good thing because it tells us that AGI as an industry can result in natural monopolies. The ultra-intensive RnD costs and Data Center infrastructure demands make it more sensical to have a greater number of resources dedicated to producing 1 AGI model, instead of dividing resources to develop multiple less optimized models (similar to how a water company holds a natural monopoly as competition in that industry would result in no foreseeable benefit to it's customers). A further effect from this dynamic lies in how businesses in this industry scale to expand, and its pretty straightforward: the more megawatt computing power a model can access, the more parameters a model can account for, and the more vast the dataset that model can train on, with enhancing speed and efficiency (GPT 4o takes into account >500B parameters in a given query). We see the concept of natural monopoly playing out as the concentration of market capitalization is becoming more extreme where firms like Google, Microsoft, and NVIDIA are absorbing larger share of the market, while trading at ever increasing Price/Earnings multiples. To many, this reflects a trend we saw during the dot com bubble, however what makes the AGI industry different is the nature of the good or service provided. During the dot com boom, companies saw speculative value based on only the fact that their business existed on the .com domain. We know that each of these businesses are unique, providing a good or service across whatever industry they were part of, the only thing having in common was that dot com. The major oversight that took place during the turn of the dot com era was that the success of these businesses wasn't in truth due to them ending in .com, but whether the idea, and execution behind the underlying business is strong or not. Like how Amazon and Facebook saw unparalleled success not just because they were .coms, but because they were pioneering business models that would attract global demand to the services they were providing. The business of AGI has a sort of homogenous property. All AGI companies produce a service that is extremely similar in nature, the only ways they can compete with one another is through Capital Expenditure towards harnessing more computing power. This is the main reason capital is concentrating in a handful of companies trading at high multiples. To me, this is not an indication of a tech bubble but rather a product of how the AGI industry is poised to grow within our economy.
AGI as a Factor of Production
To get even more philosophical, we can think about how AGI itself enhances economic growth. We already see AGI tools applied in various ways, but the most widespread application pertains to the enhancement of human capital. While it is possible to make AGI models complete ongoing tasks completely on their own with zero human input, its far more common to see AGI tools be used, well, as tools. What I mean is that firms are not looking to replace human workers with AI ones (certain exceptions may include the manufacturing industry), instead they want to integrate AGI tools into their workforce as a means of optimizing regular processes, allowing them to access and process information with tremendous efficiency. The most observable economic outcome of this is firms being able to cut costs in human capital requirements, allowing them to achieve the same level of workflow with a smaller number of employees, or outsourcing solutions to business processes by way of automation utilizing AGI. The possibilities are endless and the economic impact of AGI appears to write itself new economic theory to explain how business growth is accelerating in unprecedented ways.
Semiconductor Physical Limitations: Blessing or Burden?
In 1965, Gordon Moore articulated his observation which would come to be known as Moore's Law. He observed that the number of transistors in an integrated circuit doubles approximately every 2 years. Based not so much on law of physics, Moore's law describes an empirical relationship between time and the number of transistors per chip, suggesting that the rate of production advancements would allow for such doubling to occur on a biannual basis. And to Gordon's own surprise, he was right. Transistor count for a given chip roughly doubled every 2 years for the following 50 years. However, Gordon also predicted that Moore's Law would come to an end in 2025, where transistor sizes would reach the physical limit of 2 nanometers (10-15 silicon atoms in width). While it may appear as a bottleneck to the semiconductor and AI industry, not being able to fit anymore transistors on one chip, but in reality, this limitation pressures companies to pursue innovations such as semiconductor packaging, which is NVIDIA's bread and butter. This technique allows for the stacking and integrating of many different chips to perform together as one. This technology has already proven wildly successful and is the backbone to virtually all of NVIDIA's GPU products. Google has invented their own method to getting around the physical limitation of silicon chips, producing AI-specialized integrated circuits known as Tensor Processing Units (TPUs). Catering these innovative solutions to expanding the frontier of AGI is almost a given.
How to play this market: A Technical Approach
If you have made it this far, I commend you. The following describes my approach to analyzing price activity in SOXL:
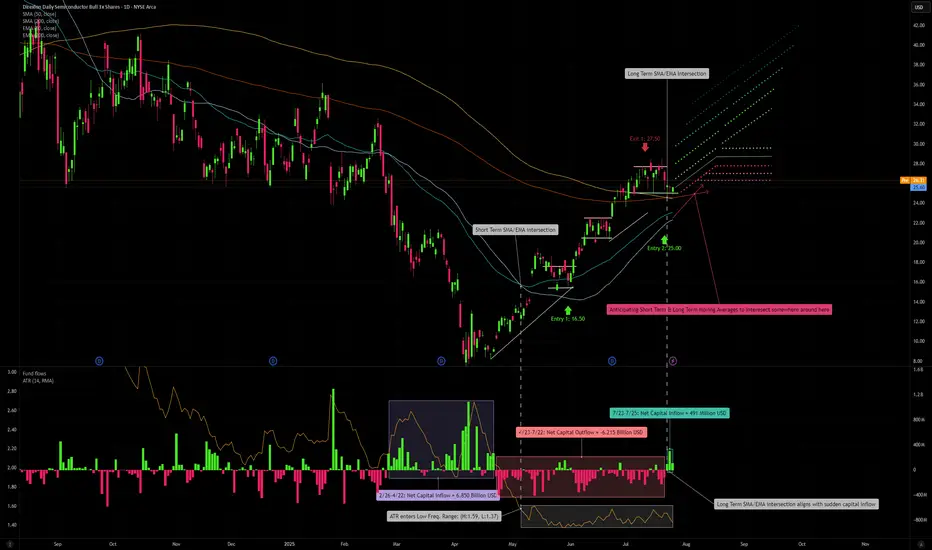
My First entry into SOXL took place on 5/30 with a unit cost of 16.50 USD. Two things can be noted prior to this entry. 1: Fund flows during late February, into March, and through April were extremely high, net inflow of 6.85 Billion USD, however price movement did not reflect the huge inflow until late April/early May where we began to see upward price direction. The beginning of June marked the start of the market bull rally which consolidated into our current price range of 25-28 USD, following contingent earnings releases of NASDAQ:ASML , NYSE:TSM , NASDAQ:NXPI and NASDAQ:INTC . The most recent pullback was a combination of a slightly concerning outlook from ASML, stating that tariffs on the EU would negatively affect projected sales growth for the 2026 fiscal year. As for TSM, there is not one concerning thing that could be said regarding the state of its business growth other than the New Taiwan Dollar gaining considerable strength over the USD amid trade relations between the US and Taiwan, affecting TSM's gross margin by an estimated 6%. NXPI released a sub par earnings and revenue growth outlook, but in my opinion this is not to be too heavily objectified as NXPI produces chips primarily for the Automotive sector, thus making it's sales heavily contingent on supply chain issues being faced by automotive manufacturers in leu of tariffs. NXPI carries a 3.5% market share in semiconductors whereas TSM carries a 68% market share. Lastly, INTC, earnings release I am almost embarrassed to talk about. If it were up to me I'd say they sell their plants in Ohio to TSM and look into opening a fruit stand instead. The most important earnings releases have yet to come though. NASDAQ:MSFT is just around the corner on 7/30, and NASDAQ:NVDA announces on 8/27. These two earnings reports will carry major weight in hinting the overall direction, momentum the market sees in AI demand growth, and the technology sector as a whole. Speculating, I have high expectations that both MSFT and NVDA will top all estimates, pushing the bar higher for 2025 into 2026.
If we look at our short-term 50-day SMA/EMA, you will notice a crossover occur on 5/6, a minor indication of a short term positive trend. Alone this is insignificant, but if we look at our 14-day Average True Range, we can see that this crossover aligns with a fall in ATR that would persist between the values of 1.37 and 1.59. This low ATR value signals that trailing volatility is actually quite low for semiconductors, considering the currently mixed market sentiment. Further along we see that price has crossed above both our long-term, 200-day SMA/EMA and a crossover occurred between the two on 7/23, serving as a small indication of a positive long term trend. Once again, not super significant on its own, but you will notice that the convergence aligns perfectly with a sharp increase in fund inflows, netting 491 Million USD in a matter of 3 trading days. If we see a continuation of net inflows over the several days, we can expect a near future extension of our bull rally, a semi-cyclical wave of inflows that concentrate during consolidation periods (which we have seen take place in the current price range between 25-28 USD following my first exit at 27.50 USD). If we extrapolate both our short-term and long-term SMA/EMA, we can anticipate a crossover to occur in the coming days to weeks. If this occurred, that would further reinforce our expectation for a positive long term trend. I have already locked in my entry 2 with a limit order executed at 25 USD. If all of the above conditions are met, I would confidently predict that we may see SOXL trade at around 42 USD in the coming months.
One more thing I would like to note, if we zoom out to our 5 year historical price progression, we can identify the previous high of 70.08 USD occurring on 7/11/2024. We know that the bull rally which took place in July of last year can be attributed to the first realization of AI as a driver for semiconductor demand, combined with renewed interest in GPU technology for applications in crypto. If we compare AI-related Capital Expenditure in fiscal year 2024 to AI-related Capital Expenditure of the first half of 2025 fiscal year: 246 Billion USD made up AI-related CapEx for all of 2024, vs first 6 months of 2025, adding up to 320 Billion USD. That is a 30% increase in capex, and we still have another 5-6 months to go. Just some food for thought.
Do you believe all of the above has been priced into SOXL, leave your thoughts in the comments!
Disclaimer
You must obviously keep in mind, SOXL is a 3x leveraged ETF, you can expect volatility with such type of investment. However, in capturing a bullish market, a 3x leveraged investment may produce greater than 3x the returns as the underlying (non leveraged) assets, due to the effect of compounding growth of returns over time. However, the same is true for sideways, or bearish markets, losses may be amplified to greater than 3x. If this is an uncertainty you do not wish to be exposed to, I would opt for the non-leveraged Semiconductor ETF ( NASDAQ:SOXX ), or divide your allocation across the top 5-10 equity holdings of SOXL. Please remember to employ your OWN due diligence before making any investment decision, as none of what I am saying shall serve as financial advise to you, the reader.