NOW: S&R Breakdown Clears the Path to Target CServiceNow ( NYSE:NOW ) has shifted into a clear corrective structure on the 4-hour timeframe after failing to sustain momentum near the $150.00 highs. The impulsive breakdown beneath the key $136.50 – $138.00 support and resistance zone decisively flipped previous structure into firm overhead supply, establishing strong bearish momentum.
This structural break validated a clean sequence, establishing an initial reaction low at Point A ($135.50) followed by a lower-high correction into Point B (
Servicenow
ServiceNow: the zone opened at 145 and the low came in at 80Four marks in six months, and the first one was forty percent above the low.
This is ServiceNow on the daily with our accumulation layer on it. The layer printed four times this year: in January just under one-fifty, in February in the high nineties, in April near eighty, and in June in the low nineties. Since that June mark it has printed nothing - sixty bars of silence - and the stock is at 142.
Start with the January mark, because it is the one that teaches the most.
What the mark means.
NOW — Earnings in 72 hours after a major de-rating. High...NOW — Earnings in 72 hours after a major de-rating. High volatility setup.
NOW — ServiceNow — July 19, 2026
ServiceNow reports Q2 earnings after the close on Wednesday. The stock has fallen sharply from its highs and is now trading near the lower end of its recent range into a high-expectation print.
**Technical Structure:**
Price has been in a broad downtrend since early 2025 but has found some support in the low $100 area recently. Volume has been elevated during the recent decline. RSI
Service Now - Starting a major bullrun now!🎉Service Now ( NYSE:NOW ) just retested major support:
🔎Analysis summary:
Just a couple of days ago, Service Now retested a major confluence of support. And with all this bullish structure, Service Now already rallied about +30% so far. But looking at the higher timeframe, this just seems to be the beginning of another bullrun of about +80%.
📝Levels to watch:
$140 and $200
Keep your #LONGTERMVISION🙏
— Phil (@TheTraderPhil)
ServiceNow Bullish Reversal: Watching a Move Toward $140ServiceNow NYSE:NOW has rebounded from the $91–$103 demand zone and reclaimed the $112–$115 area. Higher lows on the daily chart support further upside while key support holds.
Trading Levels
Entry: $100–$103
Targets: $123 and $140
Stop Loss: $91
Bullish above $91.
NOW ServiceNow Options Ahead of EarningsAnalyzing the options chain and the chart patterns of NOW ServiceNow prior to the earnings report this week,
I would consider purchasing the 97usd strike price Puts with
an expiration date of 2026-8-21
for a premium of approximately $8.70.
If these options prove to be profitable prior to the earnings release, I would sell at least half of them.
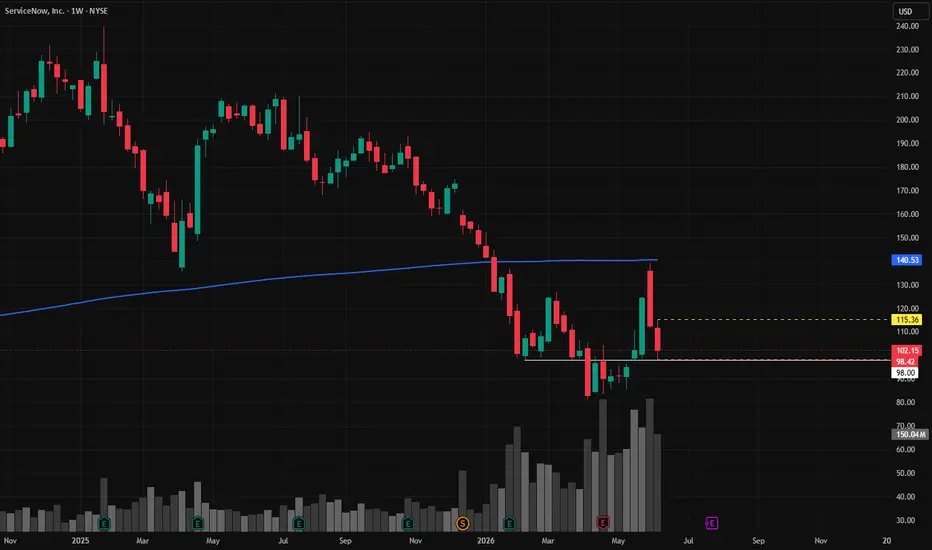
NOW | June, 2026 | The time to go long has come- Timeframe: Weekly
- Trade type: Buy stop order
- Price: 115.36
- Take Profit: Open
- Stop Loss: 98.42 (-14.70 %)
Idea: Long on a breakout above last week's high — bullish momentum continuation.
Entry: Buy stop above last week’s high.
Stop-loss: Below the low of the same candle.
If the weekly candle closes below this level, the trade is invalidated.
Take Profit: Trailing stop following the lows of new weekly candles.
Feel free to like and share your thoughts in the comments! ❤️
NOW: Macro Trend StructureWe are interpreting the macro uptrend since the 2013 lows to have topped in December 2024, having already finished its first wave of decline and potentially started a new one that should bring price toward the macro support levels around the 50s.
Chart (Monthly):
Local resistance levels are at 105–117.
As long as price stays below them, there is risk of an immediate downside reversal.
Mid-term resistance zone: 122–158.
But even if price attempts one more retest of the June highs, as l
May 12, 2026 NOW. The time to go long has come.- Exchange: Bitget Wallet
- Instrument: NOWon
- Timeframe: Weekly
- Trade type: Buy stop order
- Price: 95.62
- Take Profit: Open
- Stop Loss: 88.21 (-7.80 %)
Idea: Long on a breakout above last week's high — bullish momentum continuation.
Entry: Buy stop above last week’s high.
Stop-loss: Below the low of the same candle.
If the weekly candle closes below this level, the trade is invalidated.
Take Profit: Trailing stop following the lows of new weekly candles.
This is not an individual inves
NOW | The $300 Magnet ZoneNYSE:NOW is sitting in one of the only areas on this chart that actually matters to me: the daily BC/reload zone of the larger bullish sequence.
The bigger picture still has an active upside draw, and that draw points toward what I’m calling the $300 Magnet Zone .
Not because price “must” go there. Markets owe us nothing.
But because as long as this structure stays protected, that upper grey box remains the logical area price may continue to gravitate toward.
What makes this setup interesti
ServiceNow(NOW) could be entering a MASSIVE reaccumulation phaseLooking at the 2W chart of ServiceNow NYSE:NOW , I currently see what appears to be the late stage of a complex W-X-Y corrective structure.
From an Elliott Wave perspective, the correction looks mature, although I still believe price could briefly move deeper toward the ~$50 zone before a larger reversal fully confirms.
What really caught my attention, however, is the strong impulsive move from the $80 → $100 region.
To me, that is important.
Because impulsive reactions like this, especially
$now going back to new lows 50% drop incomingFor some reason, people are really bullish on NYSE:NOW , but the chart doesn't support the view that the stock is ready for a bull move.
Similar to CBOE:IGV , yes the stock has fallen a lot, but that doesn't meant the bottom is in.
The move higher today was just a retest of resistance and now it looks like we're set for the next move down. It's possible that it can move to the next resistance, but RSI already looks overbought on lower timeframes so I lean towards the move to $110 this mornin
$NOW From Parabolic Run to Deep Pullback – Bearish First, Then aServiceNow is still trading inside a deep corrective structure, but this one also has a clear headline catalyst behind it, with Trump-related buying interest keeping the stock in focus and adding extra speculation to the move. 🔥
That matters because it can speed up both the downside leg into support and the rebound once the correction starts to exhaust.
The chart is still a two-step setup: first the sell zone into resistance, then the buy zone once the sell leg has finished. ⚠️ This is not a
$NOW – Bottoming Pattern Triggering Over 110ServiceNow ( NYSE:NOW ) is starting to carve out a clean bottoming pattern, and the 110 break is the inflection point that flips this from repair mode into breakout mode.
🔹 The Setup:
Multiple days where every dip has been bought aggressively.
Tight consolidation forming a small base.
Break over 110 signals a potential base breakout from this bottoming structure.
This is the kind of action you want to see when a stock transitions from distribution to accumulation.
🔹 Sector Confirmation:
S
NOW: When automation meets structural volatilityOn the monthly chart ServiceNow is trading inside a broadening formation characterized by expanding volatility over time. After peaking near 239, price retraced nearly 50 percent from the high and returned to the lower boundary of the long-term structure. This is not a shallow correction but a structural test of the channel base.
The 97–110 area is technically significant. This zone aligns with the lower boundary of the expanding formation, the long-term rising trendline originating in 2016, an
NOW ServiceNow Options Ahead of EarningsIf you haven`t bought NOW before the rally:
Now analyzing the options chain and the chart patterns of NOW ServiceNow prior to the earnings report this week,
I would consider purchasing the 155usd strike price Calls with
an expiration date of 2026-3-20,
for a premium of approximately $3.20.
If these options prove to be profitable prior to the earnings release, I would sell at least half of them.
ServiceTitan Deep Dive - The Hidden SaaS GemHey everyone,
ServiceTitan is a founder-led SaaS platform revolutionizing how trades businesses operate - think plumbers, electricians, HVAC contractors, and roofers. This is a classic "picks and shovels" play on a massive $1.5 trillion market that's been historically underserved by technology.
I don't want to bother you with too much text, so here are the bullet points:
Market Opportunity & Position
Total addressable market: $650B actively targeted (out of $1.5T total trades market)
Cu
NOW ServiceNow Options Ahead of EarningsIf you haven`t bought NOW before the recent rally:
Analyzing the options chain and the chart patterns of NOW ServiceNow prior to the earnings report this week,
I would consider purchasing the 960usd strike price Calls with
an expiration date of 2025-12-19,
for a premium of approximately $97.60.
If these options prove to be profitable prior to the earnings release, I would sell at least half of them.
Disclosure: I am part of Trade Nation's Influencer program and receive a monthly fee for using
ServiceNow Surges 15%+ on Strong Earnings and Analyst UpgradesServiceNow (NYSE: NOW) soared 15.2% to $934.16 by late morning Thursday after releasing strong Q1 2025 results. At the same time, the S&P 500 gained 1.2% and the Nasdaq Composite rose 1.7%. The company posted adjusted earnings per share of $4.04, outperforming analysts’ forecast of $3.83. Revenue came in at $3.09 billion, meeting consensus expectations and surpassing ServiceNow’s internal guidance.
The software firm recorded a 19% year-over-year increase in revenue, mainly driven by growth in s
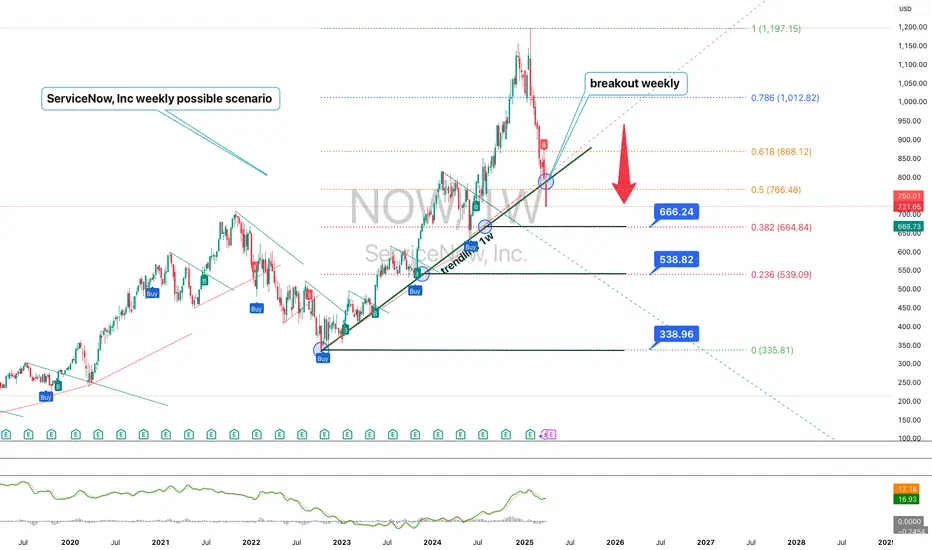
ServiceNow (NOW) – Technical and Fundamental Analysis 1WServiceNow shares have broken below a key ascending trendline on the weekly chart, strengthening the bearish outlook. The price is approaching the 666, 538, and 338 support zones, which may act as potential reversal areas. The RSI continues to decline, indicating weakening bullish momentum, while the MACD confirms a bearish crossover. EMA 50/200 suggest a rising risk of further downside.
Fundamentally, ServiceNow remains a leader in cloud-based solutions and business process automation. Howe
NOW: Bearish Signs – Harmonic Pattern Hints DeclineServiceNow (NOW): Bearish Setup Ahead of Earnings
ServiceNow (NOW) is showing signs of potential bearish movement as it nears its earnings announcement on January 29.
Bearish Divergence: Notable on both the daily and weekly charts, suggesting weakening momentum.
Double Tops Formation: A reversal pattern indicating potential selling pressure.
AB=CD Harmonic Pattern: The bearish harmonic pattern has completed, signaling a possible correction.
Key Levels to Watch:
A closing below $9