Convergence of PatternsTraders, I've spotted a compelling shorting opportunity on AUDCAD, presenting itself differently across various timeframes.
Specifically, the daily chart indicates a trend trading setup, showcasing the convergence of both the Bearish Shark and Bearish Crab Patterns in the same region.
My strategy involves waiting for the market to reach the 0.9000 region before considering engagement. At this level, I anticipate price action traders joining in, amplifying the trade potential.
What are your thoughts or trade plans for AUDCAD? Share your insights or potential strategies below!
Shark

Leveraging Multi-Timeframe Bearish Shark PatternsI've identified an intriguing counter-trend setup on NZDJPY, which showcases alignment across the Weekly, 4-hourly, and 1-hourly charts, all converging around the same entry point featuring Bearish Shark Patterns.
A notable aspect is the different starting points of the Shark Patterns across these timeframes, culminating in an intriguing entry zone. This convergence offers an opportunity with potentially lower risk and higher return probabilities.
For a comprehensive view, check out the weekly chart within TradingView and explore related ideas.
What are your thoughts or trade plans on NZDJPY?
Feel free to share your insights or potential strategies below!

Diverse Trading Scenarios ExplainedGBPUSD is on a Weaker Bull Trading setup, if you are looking for buying opportunity there are 2 trading opportunities for you.
The Bullish Shark Pattern may form on the daily chart at 1.2343, alternative you could wait for a retest of support at 1.2559 on the 1-hourly chart.
If you are looking for counter-trend trading opportunity, the 1-hourly chart do have a bearish abcd pattern that is completing at 1.2651.
What is your trading strategy, comment down below.

Target No recommendation for buy and sell
Target and stop loss mentioned in chart
Volume building in stock
Bullish chart

Potential Bearish Moves Amidst Bullish SignalsNZDJPY presents an intriguing trading setup despite being a counter-trend trade.
The observation of a Bearish Shark Pattern checkback on the Weekly Chart , along with RSI Divergence , adds weight to this potential trade opportunity.
I'm waiting for a shorting opportunity on lower timeframes and, specifically, looking for a 1-1 trading setup , intending to initiate a short position at 91.99 on the Daily Chart.
Trade plans can vary among traders based on their analysis and risk management approach.
What's your trade plan or strategy for NZDJPY?
Feel free to share your insights or plans below!

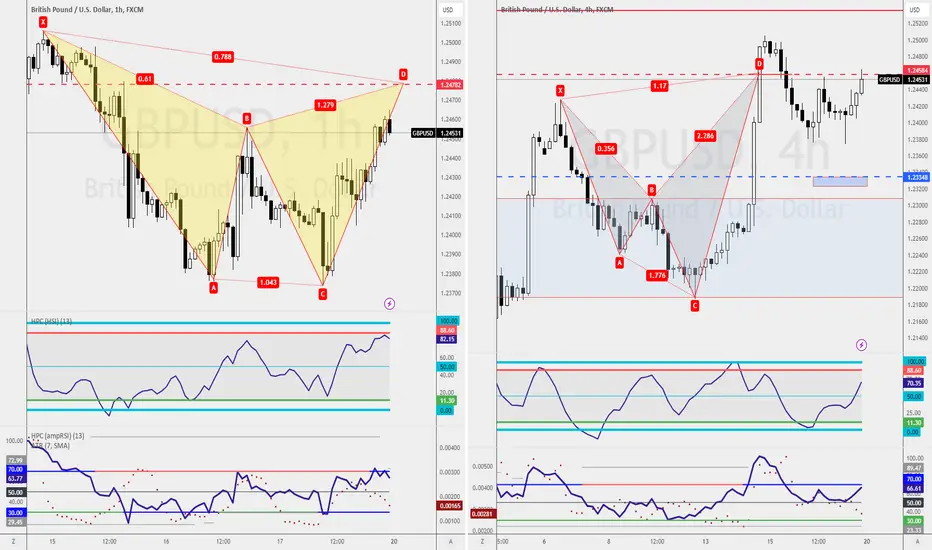
Navigating Contrasting Trading OpportunitiesGBPUSD is currently indicating a Weaker Bull Trend . Here are potential strategies for different trading approaches:
Trend Traders :
Waiting for a Bullish 5-0 Pattern on the 4-hourly chart at 1.2334 might align with your strategy as it complements the ongoing bullish trend.
Counter-Trend Traders :
For those seeking a counter-trend opportunity, a shorting opportunity off the Bearish Shark Pattern retest at 1.2453 or the completion of a Bearish Gartley Pattern on the 1-hourly chart at 1.2478 could be of interest.
Each approach carries its risks and rewards. Ensure to align these strategies with your risk tolerance and trading plan. Best of luck with your trading decisions!

Navigating the Bearish Shark PatternGBPJPY currently positions itself at the Bearish Shark Pattern. While the pattern is not yet confirmed, aggressive traders might be tempted to seize the opportunity early, either to ride the potential high or out of fear of missing the move.
It's important to note that a shark pattern could offer as many as three entry points.
I'm intrigued to know your trade plan for GBPJPY. How do you intend to approach this setup? Share your insights below!

Seize Trading Opportunities This Week!For those seeking a counter-trend trading opportunity, CADJPY may present an intriguing prospect. On the weekly chart, a Bearish Shark Pattern checkback is in play. For those desiring a more precise entry, waiting for the Gartley Pattern confirmation on the daily chart could provide a strategic shorting opportunity.
I'm eager to know your trade plans for CADJPY. How do you intend to navigate this setup? Share your insights below!

Optimize Your Trades with In-Depth Analysis!AUDCAD has unfolded a compelling Bullish Shark Pattern trading setup on its weekly chart, offering amazing opportunities for those who engaged in the trade three weeks ago.
For those who missed the initial move, a strategic move would be to await the market's respect of the Support Level on the 4-hourly chart. To identify this respect, one approach is to watch for a double bottom formation with RSI Divergence, ideally aligning with the support line.
Now, I'm curious about your trade plan for AUDCAD. What strategy are you employing? Feel free to share your insights below!

Exclusive Insights Inside!Last week, I issued a warning: "it's not a good idea to short the USDJPY!" Despite months of anticipation, the bull run on USD is not yet complete. If you're still waiting for a shorting opportunity, keep an eye on the 4-hourly chart for the development of the bearish shark pattern—a potential entry point for this counter-trend trade.
Now, let's discuss trade plans and your thoughts on the USD trend. What's your approach to USDJPY, and where do you see the US Dollar heading? Share your insights below!

Dive into GBPUSD Trading InsightsGBPUSD currently exhibits a Weaker Bullish Trend on the weekly chart, introducing interesting dynamics.
On the 1-hourly chart, a bearish shark pattern emerges, presenting a counter-trend trading setup. Simultaneously, the 4-hourly chart showcases a bullish bat pattern within the buy zone.
My preference in this scenario is clear—I favor the bullish bat pattern on the 4-hourly chart.
Now, I'm curious about your preference. What's your take on these setups? Feel free to share your insights below!

Aggressive Counter-Trend PlayI've identified a Bat Pattern retest on the NZDJPY, representing a counter-trend trading setup. This trade is categorized as a combo trade due to the presence of a bearish shark pattern retest on the weekly chart.
In this instance, I've opted for an aggressive approach , meaning I'm engaging in the trade before waiting for candlestick confirmation.
The profit potential for my final target is quite remarkable.
A gentle reminder: Never follow any trade blindly and refrain from overtrading, regardless of your confidence in this trade or in me.
Wishing you successful trading!

DXY SEEMS TO BUY CORRECTION THEN LONG SELL...
AronnoFX will not accept any liability for loss or damage as a result of
reliance on the information contained within this channel including
data, quotes, charts and buy/sell signals.
If you like this idea, do not forget to support with a like and follow.
Traders, if you like this idea or have your own opinion about it,
write in the comments. I will be glad.

Potential Bearish Setup on Weekly ChartAs anticipated, the Bullish Shark Pattern has initiated its move on the Weekly Chart—a prediction I shared as early as October 8, 2023. For visual confirmation, refer to the chart within this Trading View post.
Now, attention shifts towards the potential emergence of the bearish 5-0 pattern on the Weekly Chart.
On the Daily Chart, there's a convergence of Bearish Shark and Bearish Crab Patterns, both culminating at the same completion level, 0.9015. This sets the stage for a potential shorting opportunity upon market retest at these levels.
Alternatively, consider a shorting opportunity on the 1-hourly chart, targeting the retest of the resistance level at 0.8908.
The pivotal question arises: What's your trade plan? Your insights carry weight. Please share your perspective below!

Potential Short-Term Bullish MomentumThe GBPUSD is currently exhibiting a Weaker Bullish Trend on the Weekly Chart.
Upon closer examination of the Daily Chart, it appears that the completion of the Bullish Shark setup may have eluded us. The current resistance level holds pivotal importance. A close above it would prompt traders to await a buying opportunity. Conversely, if the market respects this resistance, the formation of a double top might signal a shorting opportunity.
For those inclined towards a shorting stance, my focus lies on the formation of a double top pattern at the Bearish Crab Pattern, projected at 1.2441 on the 1-hourly chart.
I'm curious about your perspective. What's your take on the GBPUSD? Please share your insights below!

NQ BEAR NOV? DEC?We've been in a long term bearish trend i am speculating this bullish trend currently to be a act of retrace for bears to continue through end of year.


Navigating Bullish Momentum Amidst Potential Caution SignsIf you caught my last week's analysis, along with the accompanying article on Trading View, you can dive deeper into the details by clicking the link.
In my previous analysis, I emphasized the significance of waiting for the Bearish Crab Pattern confirmation on the Daily Chart before considering a shorting opportunity.
Now, let's delve into why this is crucial:
It enables you to distinguish between astute analysis and a sales-driven approach often seen in the financial world.
If you happened to miss the initial shorting opportunity, there are three viable options to consider:
Option 1 : A retest on the Bearish Crab Pattern on the daily chart at 150.43, presenting another potential shorting opportunity.
Option 2 : A retest on the Bearish Shark Pattern on the 4-hourly chart at 150.45. These levels may appear close, but they entail different timeframes for trading confirmation.
Option 3 : You might opt to await a retest of the trendline on the 4-hourly chart before engaging in this counter-trend trade.
The critical question now arises: Which of these three options aligns best with your trading strategy, and why? I'm eager to hear your thoughts. Share your insights below!

BTC - Potential harmonics to support HTF PlanSharing this idea as a reference to my primary HTF view - the chart was going to be too messy otherwise.
I don't have much experience in trading harmonics at all, but often I keep an eye on them as they respect fibs levels I trade a lot.
Also, maybe just a personal observation, but when i find it more difficult to trade, and it takes ages for the price to move in certain directions, there is probably a harmonic in play.
FVGs, OBs, algo levels and speed fan confluence as well. Trade safe :)

NZDCAD SELL SETUP [BEARISH CONDITIONS]Putting together supply and demand, harmonic patterns and ict concept to give a high probability SETUP. Most likely to play out soon

Bearish This stock have fundamental good stock
Technically this stock breakdown from major support now stock can go low level
Take own analysis
No recommendation for buy and sell

Sell oil at 90?See the similar harmonics at the last top. Just want to wait for price to hit the POC. Could overshoot a bit though.
