AUD/USD... Pacifics looking up..
there is a quality harmonic shark. I am waiting for the ote area in the shark region, it will be a swing transaction. my posts are not investment advice.
Shark

Buy time for nzdusd
There is a quality long harmonic shark formation. Please do your own research, my posts are not investment advice.

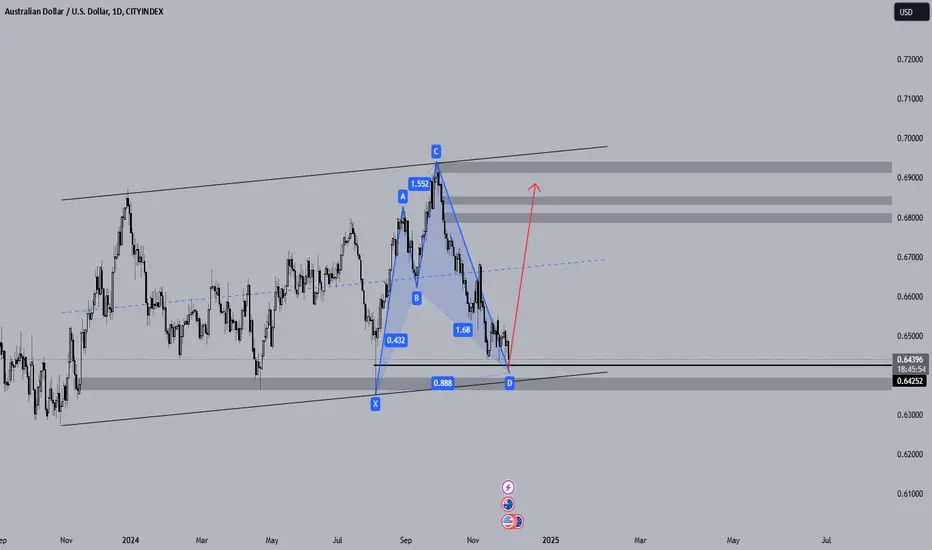
AUDUSD - Long AreaHi dera freinds
- Canalized structure
- Shark harmonic pattern
- Near Important Base
This is just my personal analysis. I hope the problems will be solved with your comments
thanks
UsdjpyName: usdjpy
Reason for entering the buy deal:
Completing your hormone pattern called (shark) and completing it at the target and also forming a table top sequence
•4-hour time frame
Please use capital management and commit to the stop

AVAX/USDT - Bearish harmonic shark formation is loadingAVAX/USDT- update- the time to be careful is approaching for a bearish harmonic shark formation
The price continues to rise towards the channel middle band in the high time frame and this region intersects with the reversal region of the shark harmonic formation. In this case, the price is now gradually moving away from the 5-0 long direction region between 30-34. We can now talk about a correction for Avax between $59.94-$71.61. Of course, it would be appropriate to look for confirmation in low time frames for a short direction transaction and not to make aggressive decisions, without forgetting that we are in the bull season.

AUD/USD long opportunity with shark formation
A strong rise can be expected if the price is observed between 0.64155 and 0.6207, especially in the lower timeframes, negative divergence and the RSI reaches the oversold region.

Bitcoin Dominance: Elliott Wave and Harmonics ComboBitcoin Dominance ( BTC.D) is giving a fantastic trading setup.
It's preparing a BIG Bullish Swing.
From an Elliott Wave point of view, a bullish Impulse Wave is about to start.
In this case I'm talking about Super-Cycle (C) (turquoise).
Moving on to Harmonic Patterns, there are two:
The smaller one is the Bullish Shark, which is preparing its completion.
The second one, and the bigger view, is the Cypher Pattern, which will commence one the Shark is done.
So, bottom line: BTC.D is gonna start flying, and will push the Crypto market into a fantastic Bull Cycle.
Bitcoin Dominance ( BTC.D ) Technical Analysis:
* Elliott Wave Impulse: Super-Cycle (C) (turquoise)
* Harmonic Pattern: Bullish Shark
* Harmonic Pattern: Bullish Cypher
* Double Bottom
* Bullish Divergence
* 88.6% Fibonacci Retracement
* 61.8% Fibonacci Extension
* Demand Zone
Conclusion: Bitcoin (BTCUSD) is and always will be the one and only driver of the Crypto Markets.

IRCTC - Forming Cypher / Shark IRCTC - Forming Cypher / Shark it has potential to to go to below levels.
765 / 740 / 693 / 660

HARROW 16% INTRADAY DROP CAUGHT!Technical Analysis: HARROW (15-Minute Timeframe)
This chart demonstrates a highly profitable short trade executed with precision using the Risological Indicator. A stellar 16% profit was captured in this intraday trade, showcasing the power of momentum trading.
Trade Details
Stock: HARROW
Timeframe : 15-Minute
Entry Price : $52
Exit Price : $43
Profit : $9 per share (16% intraday return)
Key Technical Observations
Perfect Entry Point:
The entry at $52 aligns with the beginning of a sharp bearish breakout, as identified by the Risological Indicator. The indicator’s red resistance bands provided clear confirmation of a strong downward trend.
Momentum Confirmation:
A steep decline immediately followed the entry, with heavy bearish candles confirming the strength of sellers in the market.
The gap and acceleration downwards signify a likely reaction to negative news or market-wide pressure.
Dynamic Resistance:
The price consistently respected the downward-sloping resistance bands, highlighting the dominance of sellers and a clear absence of bullish recovery attempts.
Exit at $43:
The exit near the $43 level demonstrates disciplined profit-taking, as the stock begins to consolidate and show signs of slowing bearish momentum.
Analysis of Results
This short trade captured the entirety of a massive 16% intraday move, leveraging the indicator’s precise trend-following signals. The sharp entry and timely exit reflect the strength of the Risological Indicator in identifying and capitalizing on market momentum.
Key Takeaways
Trend Confirmation is Critical: The trade capitalized on the established bearish trend, ensuring high probability of success.
Indicator Precision: The Risological Indicator’s dynamic resistance bands provided clear visual cues for both entry and exit, removing guesswork.
Risk Management: By exiting as momentum slowed, the trader avoided potential losses from a reversal or consolidation phase.
This trade underscores the importance of using robust tools like the Risological Indicator to stay ahead in volatile markets, transforming short-term opportunities into substantial profits.

BLUEDART SHORT CAUGHT!Today was a one side, short market!
I always believe in following the money - the smart money!
Coupled with the options Weekly contracts termination like BANKNIFTY, MIDCPNIFTY, FINNIFTY, etc, we are going to see more sell off in this week, as per my observation.
Dont go LONG in the market blindly tomorrow ( 14, Nov, 2024).
Good luck and Namaste!

Nifty is it towards 22800/22300 ? - Read description in detailFollowing my post on August 5 after a dead cat bounce,
Nifty has started to form Cypher or Shark pattern on weekly time frame.
For a Cypher pattern: it will touch 23870/23216/22800
To form a shark pattern fall may extend up to 22300.
It is expected to complete this by December end.

TataMotors towards 666Tatamotors has crossed lakshman rekha to form Shark pattern. It will touch 666 and then it will move towards next direction.
Target: 812 / 780 / 730 / 666

Nifty Forming Bearish Shark, will touch 23,000Nifty has formed bearish shark.
Based on current scenario it will have following levels.
23700 - 23500 - 23300 - 23000.
It will touch 23,000.


Reliance next levels to followReliance in the direction to form Cypher or shark pattern.
Next levels to watch 1217 / 1210 / 1160

BTC Shark to 5-0 PatternBitcoin is currently in a weekly Shark pattern, suggesting a potential pullback to complete the 5-0 pattern. We could see a move towards the T1 zone at $45,703 - $43,000.
5-0 Pattern: This pattern often follows the Shark pattern and indicates the completion of a corrective move after the initial reversal. The 5-0 pattern has a distinct structure, starting from the end of the Shark pattern and typically leading to a trend continuation after a brief consolidation or retracement.
The last wick to $49,000 was swiftly bought up, indicating the low might already be in. However, with the SPX nearing equal highs and possible volatility around Jackson Hole, a retest of lower levels remains possible.
RSI is trending just below the 50 zone on Daily and Weekly, suggesting a decision point is approaching. A move above 50 on the weekly would indicate the low is in, setting us up for upper targets at $70,315 / $76,197. If RSI rejects at 50, expect new lows.
Key Levels:
$49,000: A retest of this zone and a break above $63,139 will confirm the low is in.
A break below $49,000 will aim for the T1 Target at $45,793.
Buy Zone/Support Range: $45,703 - $43,000
$42,233 TD Support
The next few days will be critical. If we hold above $49,000, we may avoid a deeper correction.

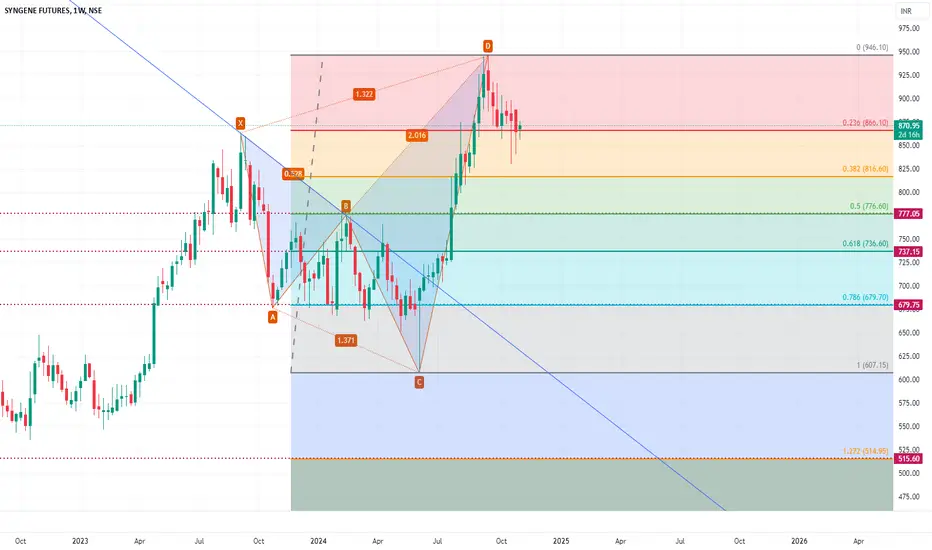
Syengene Forming Shark pattern (Bearish Mode)Syengene has formed bearish Shark pattern on weekly time frame
776 is an important support at 0.5 Fib. Immediate target at 776.
If it closes below 776 on week candle, then rest target to follow and could go down more till 400.
Target1 - 776
Target2 & 3 - 736 / 680
Target4 & 5 - 515 / 400

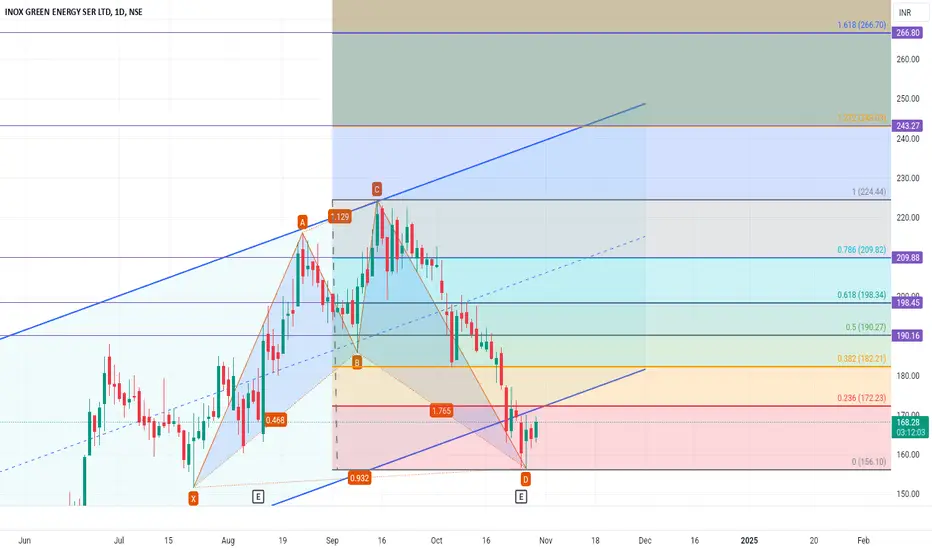
Inox Green - Forming Shark Turning to bullishInox Green has formed Bullish shark pattern.
At 0.5 fib level - 190 level it has crucial zone.
Candle close above 190 - 195 will confirm for next levels.
Target1: 198 to 210
Target2: 243 to 267
DXY (US Dollar Index) Analysis Daily TimeframeDXY is currently sitting at a daily resistance level after a bullish run since last week.
we anticipate a potential move to the downside as the index shows signs of weakening, by creating a Doji candlestick, which indicates market indecision.
Remember: If the US Dollar Index turns bearish, EUR/USD and GBP/USD are likely to show bullish momentum.
Let's take a closer look at these pairs for potential buy setups.

ALGORAND ROCKET SHIP!!I believe Algorand has bottomed in the way of a bullish shark or cypher pattern. I've outlined entry and exit points. I have accumulated a crap ton of Algo. I just wanted to let you all know. Now you do what you want with this info. Good luck

Cattle Shark leaps to 192 before diving deep.Hi everyone!
Here's a more concise version of the cattle price history:
1. 1960s and Earlier:
Before the introduction of live cattle futures in 1964 by the Chicago Mercantile Exchange (CME), prices were influenced by local supply-demand conditions and seasonal factors.
2. 1970s:
Prices rose due to inflation and higher feed costs, reaching around $50 per cwt (hundredweight).
3. 1980s:
During the farm crisis, prices fluctuated between $60-$70 per cwt, impacted by high-interest rates and falling demand.
4. 1990s:
Prices ranged between $65-$80 per cwt, with cyclical booms and busts, including concerns over Mad Cow Disease.
5. 2000s:
After a 2003 Mad Cow Disease outbreak, prices dropped temporarily but recovered, reaching over $90 per cwt by the mid-2000s.
6. 2010s:
Due to droughts reducing cattle herds, prices hit record highs, exceeding $170 per cwt in 2014, before dropping as herds were rebuilt.
7. 2020s:
The COVID-19 pandemic initially caused disruptions, but prices recovered to $120-$140 per cwt in 2021. By 2023, prices were consistently above $160-$170 per cwt, driven by strong demand and rising input costs.
In 2024 ,Cattle prices have been cyclical, responding to changes in supply, weather conditions, global trade, and consumer demand . cattle prices are expected to rise further, potentially reaching $192 per cwt, driven by continuing strong demand and supply constraints and his chart shows technical analysis for Live Cattle Futures and focus on a bearish shark pattern, which is a type of harmonic pattern used to predict potential market reversals.
Fibonacci retracement levels are visible, showing common retracement ratios such as 0.382, 0.5, 0.886, and 1.13 (which is the upper boundary of this pattern).
The points X, A, B, C, and D are the important pivot points for the shark pattern.
Point D, at around 1.92, represents the potential completion of the pattern where a reversal could occur. It lies near the Fibonacci extension levels of 0.886 and 1.13, which are important levels for the bearish shark pattern.
The candlestick patterns forming in the coming weeks will influence the price trend anticipated for 2025.
I'm eager to read your insights in the comments, friends.
SEYED.

It could be an Head & Shoulders insteadIt could be an Head & Shoulders instead of a Bullish Shark Pattern.
Let's see.
