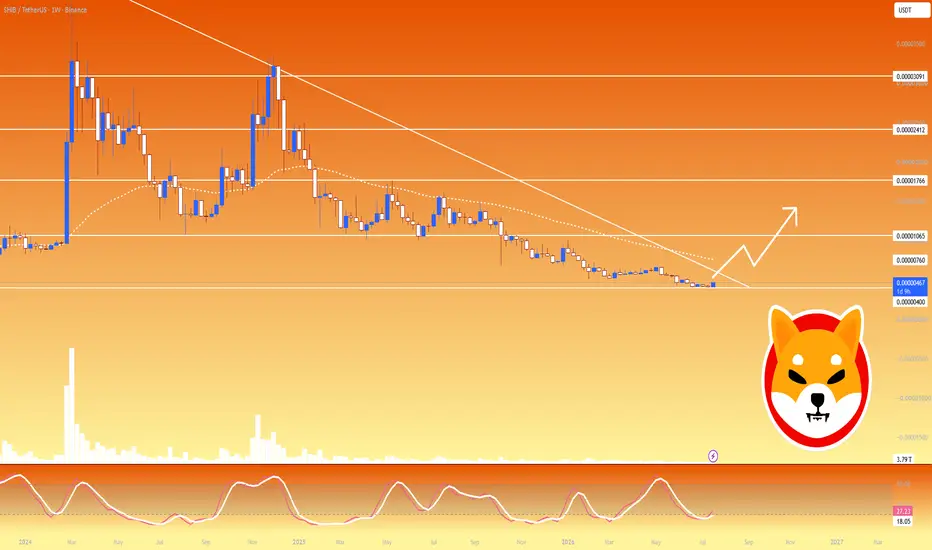
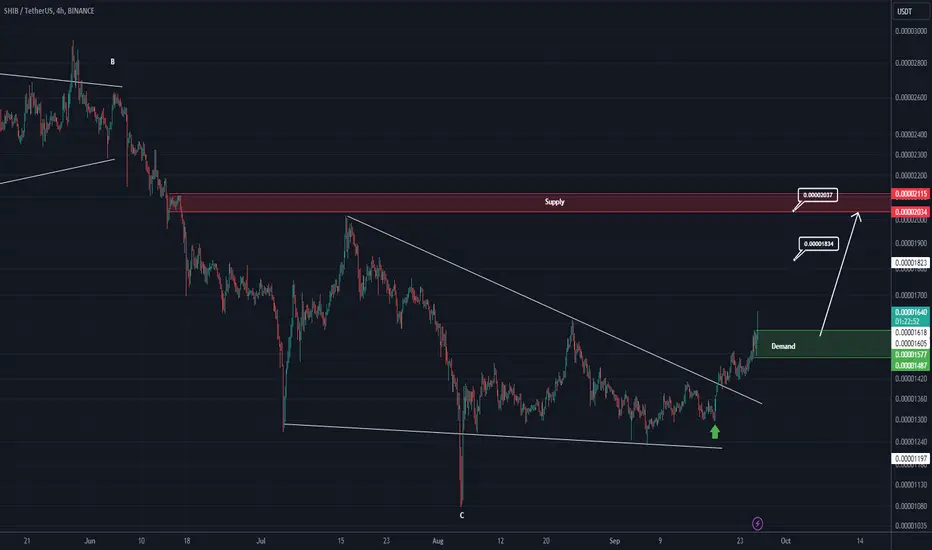
SHIBUSDT Forming Falling WedgeSHIBUSDT is forming a clear falling wedge pattern, a classic bullish reversal signal that often indicates an upcoming breakout. The price has been consolidating within a narrowing range, suggesting that selling pressure is weakening while buyers are beginning to regain control. With consistent volume confirming accumulation at lower levels, the setup hints at a potential bullish breakout soon. The projected move could lead to an impressive gain of around 20% to 30% once the price breaks above th
Shibbtc
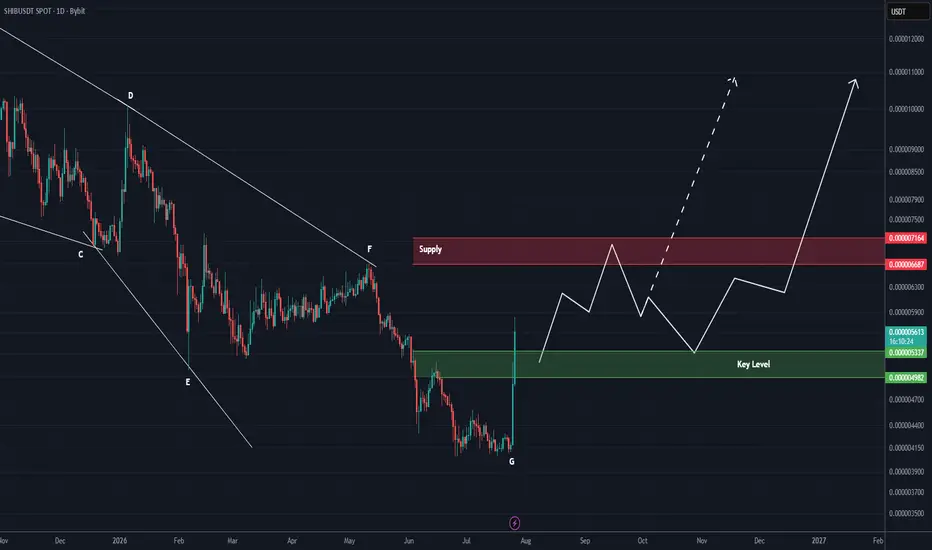
Shiba Inu has begun a long-term bullish trend (1D)It appears that Shiba Inu's multi-year correction has come to an end, and it is now at the beginning of a medium term uptrend. Compared to most other altcoins, SHIB is in a unique position and could sustain this bullish trend for several months.
A correction is expected from the supply zone before the uptrend resumes.
The green zone offers a low-risk area to join this bullish trend.
Let's see what happens.
If you have a coin or altcoin you want analyzed, first hit the like button and then co
SHIB | Meme SZN is Knocking & The Dog is Barking AgainCrypto meme coin traders be like: 90% down: "Just a healthy correction"
9% up: "WE ARE SO BACK !" come on guys! but I got some goood news..
Every crypto cycle has that one coin that ignores logic, laughs at fundamentals, and sends CT into full "WAGMI" mode. Today, that dog is barking again! SHIB is catching fresh bids as traders rotate back into high beta meme coins, helped by a jump in token burns, improving ecosystem sentiment, and a broader risk on mood across crypto. The market suddenly
SHIBUSDT Forming Falling WedgeSHIBUSDT is forming a clear falling wedge pattern, a classic bullish reversal signal that often indicates an upcoming breakout. The price has been consolidating within a narrowing range, suggesting that selling pressure is weakening while buyers are beginning to regain control. With consistent volume confirming accumulation at lower levels, the setup hints at a potential bullish breakout soon. The projected move could lead to an impressive gain of around 60% to 70% once the price breaks above th
SHIB New Update/Roadmap (3D)The correction for this coin started from the point where we placed the red arrow on the chart.
The price appears to be inside a Triangle or Diametric, nearing the end of wave D.
The green zone is a low-risk rebuy area.
There is a liquidity pool on the chart, which we expect to be swept soon.
Targets are marked on the chart.
A weekly candle close below the invalidation level will invalidate this analysis
For risk management, please don't forget stop loss and capital management
When we reach
SHIB To start exiting the downtrend, Shiba must first break its downtrend line and reach and cross the 0.00001856 area, which is also an important resistance.
Unfortunately, in the daily time frame and in the range of 0.00001916, the probability of a death cross is very high, and if it happens, a worse downtrend will be expected.
But if it can close a strong candle above 0.00002123 in the 8-hour time frame, the death cross will be invalidated.
My targets for the next 2 months for Shiba can be 0.0000
SHIB is about to explode soon!On the chart we have a big triangle which is a continuing triangle and the wave before this triangle was also bullish.
From where we placed the red arrow on the chart, this triangle has started to form.
Wave D now appears to be ending. Wave D is diametric.
On the green range, wave E can end and then a bullish wave begins.
The target of the move after the triangle can be the break of the ATH
Closing a daily candle below the invalidation level will violate this analysis
For risk management,
SHIB buy/long setupAn important trigger line has been broken on the chart. I have a bullish iCH chart. The larger structure is bullish.
We should look for buy/long in the support ranges.
We are looking for buy/long in the specified range of demand.
Closing a daily candle below the invalidation level will violate this analysis
Do not enter the position without capital management and stop setting
Comment if you have any questions
thank you
SHIB looks bullish (1D)SHIB seems to be bullish. From where we put the red arrow on the chart, it looks like a triangle is formed, and we are now in wave E of this triangle.
By hitting the green range, we expect another pump from SHIB.
The targets are marked on the picture.
Closing a daily candle below the invalidation level will violate this analysis.
For risk management, please don't forget stop loss and capital management
When we reach the first target, save some profit and then change the stop to entry
Comment
#SHIB/USDT#SHIB
The price is moving in a bearish channel on a 4-hour frame and is adhering to it to a large extent
The price rebounded well from the green support area at the support level 0.000022000, which is a strong level.
We have a trend to hold above the Moving Average 100, which is strong support for the rise
We have very strong oversold resistance on the RSI indicator to support the rise, with a downtrend about to break higher
Entry price is 0.00002350
The first goal is 00.00002570
The second go
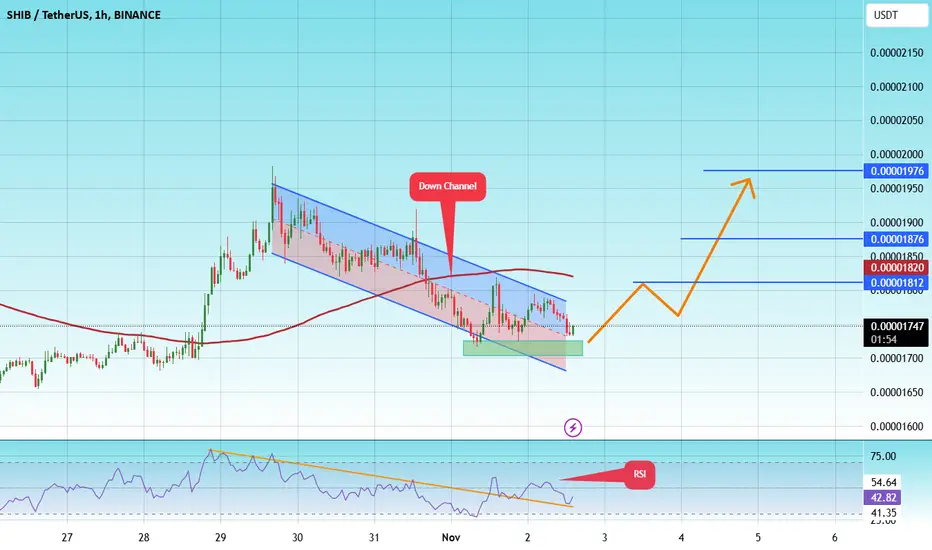
#SHIB/USDT#SHIB
The price is moving in a descending channel on the 1-hour frame upwards and is expected to continue.
We have a trend to stabilize above the moving average 100 again.
We have a downtrend on the RSI indicator that supports the rise by breaking it upwards.
We have a support area at the lower limit of the channel at a price of
0.00001721
Entry price 0.00001742
First target 0.00001812
Second target 0.00001876
Third target 0.00001976
SHIB Looks BullishShiba appears to be entering a bullish wave C.
By maintaining the green range that overlaps with the KEY level, it can go to the ATH.
You should not have an emotional entry, you must have a set position to enter.
Shiba's market cap is 13B, which is a bit heavy, and you shouldn't expect big profits from this coin.
The target is above ATH
Closing a daily candle below the invalidation level will violate this analysis
For risk management, please don't forget stop loss and capital management
Wh
SHIB Is BullishFrom where we put the green arrow on the chart, it looks like a big bullish triangle is over.
By maintaining the green range, it can move towards the targets.
The targets are marked on the chart.
Closing a daily candle below the invalidation level will violate the analysis
For risk management, please don't forget stop loss and capital management
When we reach the first target, save some profit and then change the stop to entry
Comment if you have any questions
Thank You
Shiba Inu | SHIB analysisThe price of Shiba Inu is $0 .0000 116 today with a 24hour trading volume of 355 million dollar. This represents a 3% price increase in the last 24 hours and a 7% price increase in the past 7 days.
Data from the Ethereum blockchain has revealed that the recently launched Koyo token project has moved forward with a major burn of the meme inspired cryptocurrency Shiba Inu , helping its burn rate skyrocket.
According to the data, first spotted by users on Twitter, Koyo burned an astounding 1.49
SHIB looks bearishFrom where we placed the red arrow on the chart, SHIB has entered correction.
Considering the time of the waves and the price range, the correction seems to be a diametric.
The price is expected to reject downwards from the red range.
The targets are clear on the chart.
Closing a daily candle above the invalidation level will violate the analysis
For risk management, please don't forget stop loss and capital management
When we reach the first target, save some profit and then change the sto
SHIBA - Buy here, do not miss next pump! (HUGE)Shiba Inu will definitely go higher later this year. Right now, we need to catch the bounce and ride the next wave to the upside. The 0.618 FIB retracement seems to be a great level to buy Shiba Inu, which is at 0.00002249. It's always important to do an Elliott Wave technical analysis for such pumps to stay in full picture. We need to see the full market structure and map of the uptrend. I suggest waiting for a bullish flag or any bullish pattern, or just simply setting your limit order to buy
SHIBUSDT#SHIB CRYPTOCAP:SHIB has formed a very promising chart pattern for us. It has broken the resistance of the wedge formation, confirming the bullish momentum. One of the best indicators, TD Sequential, has given a bullish signal after a long time. Successively, it is expected to reach Fibonacci targets at 0.61, 0.78, and 1 levels. Since #dogecoin has already started its uptrend, #shibcoin is likely to follow suit.
SHIBA's correction will continueAccording to the structure of the waves, it seems that the SHIBA correction will continue.
The correction has started from where we entered "START" on the chart.
It seems that we are in an ABC or a more complicated pattern.
Wave B looks like a triangle with only one wave left.
We expect another downward wave from the red range.
Closing a daily candle below the invalidation level will violate the analysis
For risk management, please don't forget stop loss and capital management
Comment if y
#SHIB/USDT#SHIB
The price is moving in a downtrend on a 12-hour frame, within which the price is moving
We have a major support area at Saad 0.00002450
We have a higher stability moving average of 100
We have a downtrend on the RSI that is about to bounce back
Entry price is 0.00002600
The first goal is 0.00003000
The second goal is 0.00003400
The third goal is 0.00003760
SHIB look bearishConsidering the lower L's, it seems that SHIB intends to move towards the specified demand
By maintaining the supply range, it can drop the demand side.
Closing a daily candle above the invalidation level will violate this analysis
Note that the financial market is risky, so:
Do not enter any position without confirmation and trigger.
Do not enter a position without setting a stop.
Do not enter a position without capital management.
When we reach the first TP, save some profit and try to move
"Let's be realistic with SHIB" - Is 2400% realistic enough ?#SHIB/USDT #Analysis
Description
---------------------------------------------------------------
+ SHIB is currently looking to breakout from its resistance zone
+ I see a clear bullish divergence with the RSI and price. Overall SHIB is showing a bullish signs
+ For the long term trade, i'm planning to enter a position at the current price.
---------------------------------------------------------------
VectorAlgo Trade Details
------------------------------
Entry Price: 0.00001133
Stop Lo