EURUSD Buyers In Panic! SELL!
My dear subscribers,
This is my opinion on the EURUSD next move:
The instrument tests an important psychological level 1.1552
Bias - Bearish
Technical Indicators: Supper Trend gives a precise Bearish signal, while Pivot Point HL predicts price changes and potential reversals in the market.
Target - 1.1510
About Used Indicators:
On the subsequent day, trading above the pivot point is thought to indicate ongoing bullish sentiment, while trading below the pivot point indicates bearish sentiment.
Disclosure: I am part of Trade Nation's Influencer program and receive a monthly fee for using their TradingView charts in my analysis.
———————————
WISH YOU ALL LUCK
Short!!!!

EURUSD Trading Opportunity! SELL!
My dear subscribers,
EURUSD looks like it will make a good move, and here are the details:
The market is trading on 1.1567 pivot level.
Bias - Bearish
Technical Indicators: Both Super Trend & Pivot HL indicate a highly probable Bearish continuation.
Target - 1.1523
About Used Indicators:
The average true range (ATR) plays an important role in 'Supertrend' as the indicator uses ATR to calculate its value. The ATR indicator signals the degree of price volatility.
Disclosure: I am part of Trade Nation's Influencer program and receive a monthly fee for using their TradingView charts in my analysis.
———————————
WISH YOU ALL LUCK

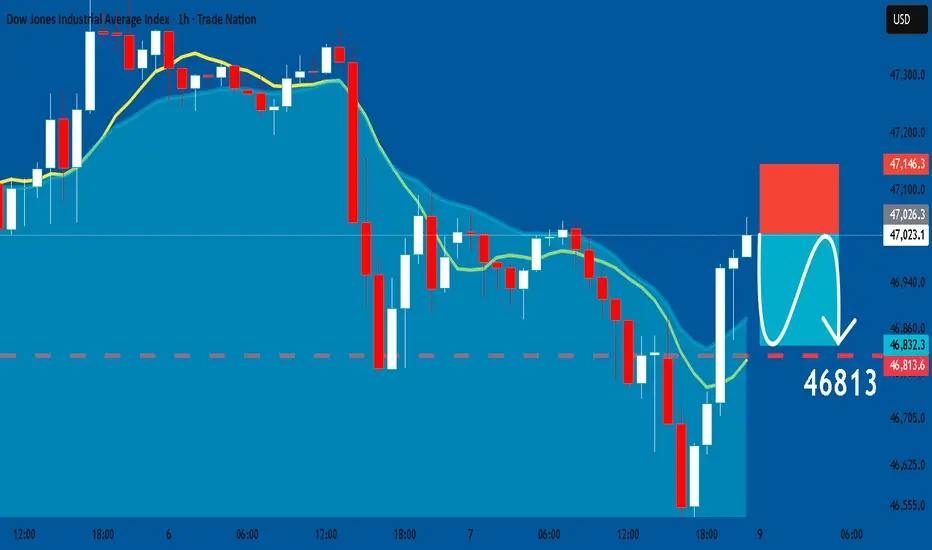
US30: Short Signal Explained
US30
- Classic bearish pattern
- Our team expects retracement
SUGGESTED TRADE:
Swing Trade
Sell US30
Entry - 47023
Stop - 47146
Take - 46813
Our Risk - 1%
Start protection of your profits from lower levels
Disclosure: I am part of Trade Nation's Influencer program and receive a monthly fee for using their TradingView charts in my analysis.
❤️ Please, support our work with like & comment! ❤️
SILVER: Bearish Continuation is Highly Probable! Here is Why:
Looking at the chart of SILVER right now we are seeing some interesting price action on the lower timeframes. Thus a local move down seems to be quite likely.
Disclosure: I am part of Trade Nation's Influencer program and receive a monthly fee for using their TradingView charts in my analysis.
❤️ Please, support our work with like & comment! ❤️

BTCUSD: Bearish Continuation & Short Signal
BTCUSD
- Classic bearish setup
- Our team expects bearish continuation
SUGGESTED TRADE:
Swing Trade
Short BTCUSD
Entry Point - 10376
Stop Loss - 10482
Take Profit - 10200
Our Risk - 1%
Start protection of your profits from lower levels
Disclosure: I am part of Trade Nation's Influencer program and receive a monthly fee for using their TradingView charts in my analysis.
❤️ Please, support our work with like & comment! ❤️

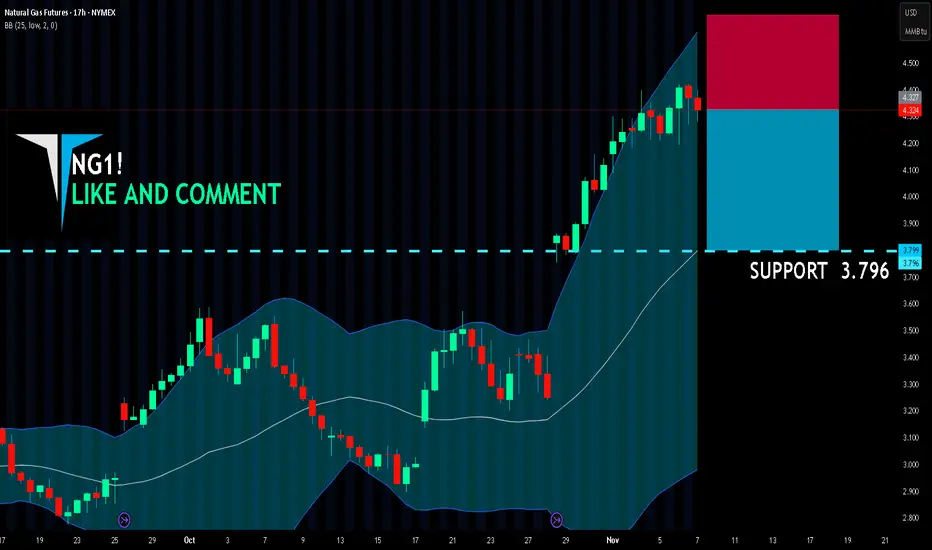
NG1! BEST PLACE TO SELL FROM|SHORT
NG1! SIGNAL
Trade Direction: short
Entry Level: 4.327
Target Level: 3.796
Stop Loss: 4.678
RISK PROFILE
Risk level: medium
Suggested risk: 1%
Timeframe: 17h
Disclosure: I am part of Trade Nation's Influencer program and receive a monthly fee for using their TradingView charts in my analysis.
✅LIKE AND COMMENT MY IDEAS✅
BTCUSD Tests Buyer Zone — Eyes Break Below $100KHello traders, here’s my current outlook on Bitcoin (BTCUSD). The market continues to trade within a broader bearish structure after breaking down from the previous rising channel. The price failed to hold above the $110,000–$111,000 Seller Zone, where multiple fake breakouts occurred, indicating strong bearish pressure and aggressive selling activity in that region. After the rejection from the Seller Zone, BTC shifted into a descending trend structure, forming lower highs along a clearly defined Resistance Trendline. Each corrective move to the upside has been capped by this trendline, confirming that sellers are maintaining control. Meanwhile, the Support Level around $100,200–$101,000 has acted as a key Buyer Zone, where price has repeatedly paused and reacted, suggesting that buyers are attempting to absorb selling pressure here. Currently, BTC is consolidating just above this Support Zone, but the overall momentum remains bearish. If the price fails to break above the descending Resistance Line, we could see a continuation of the downtrend, likely pushing toward a retest of the $100,200 Support Level. A confirmed breakdown below this level would expose the next downside support levels and reinforce the sellers’ dominance. However, if buyers manage to hold the price above $100,200 and force a breakout above the descending Resistance Line, a short-term corrective recovery could unfold toward the $103,000–$105,000 region. This area remains critical and is likely where sellers may look to re-enter the market based on previous reaction structure. For now, the market structure favors a bearish bias, with the trend down and sellers maintaining stronger control. I am watching for a reaction at the current support — if the level breaks, continuation lower becomes the primary expectation. Please share this idea with your friends and click Boost 🚀

EURUSD: Weak Market & Bearish Continuation
Remember that we can not, and should not impose our will on the market but rather listen to its whims and make profit by following it. And thus shall be done today on the EURUSD pair which is likely to be pushed down by the bears so we will sell!
Disclosure: I am part of Trade Nation's Influencer program and receive a monthly fee for using their TradingView charts in my analysis.
❤️ Please, support our work with like & comment! ❤️

BTCUSD What Next? SELL!
My dear followers,
This is my opinion on the BTCUSD next move:
The asset is approaching an important pivot point 10376
Bias - Bearish
Safe Stop Loss - 10456
Technical Indicators: Supper Trend generates a clear short signal while Pivot Point HL is currently determining the overall Bearish trend of the market.
Goal - 10230
About Used Indicators:
For more efficient signals, super-trend is used in combination with other indicators like Pivot Points.
Disclosure: I am part of Trade Nation's Influencer program and receive a monthly fee for using their TradingView charts in my analysis.
———————————
WISH YOU ALL LUCK

CAD/CHF BEARS WILL DOMINATE THE MARKET|SHORT
Hello, Friends!
CAD/CHF pair is trading in a local uptrend which we know by looking at the previous 1W candle which is green. On the 1D timeframe the pair is going up too. The pair is overbought because the price is close to the upper band of the BB indicator. So we are looking to sell the pair with the upper BB line acting as resistance. The next target is 0.561 area.
Disclosure: I am part of Trade Nation's Influencer program and receive a monthly fee for using their TradingView charts in my analysis.
✅LIKE AND COMMENT MY IDEAS✅

AUDUSD Potential DownsidesHey Traders, in today's trading session we are monitoring AUDUSD for a selling opportunity around 0.65100 zone, AUDUSD is trading in a downtrend and currently is in a correction phase in which it is approaching the trend at 0.65100 support and resistance area.
Trade safe, Joe.

CADJPY: Short Trading Opportunity
CADJPY
- Classic bearish formation
- Our team expects fall
SUGGESTED TRADE:
Swing Trade
Sell CADJPY
Entry Level - 108.83
Sl - 108.98
Tp - 108.55
Our Risk - 1%
Start protection of your profits from lower levels
Disclosure: I am part of Trade Nation's Influencer program and receive a monthly fee for using their TradingView charts in my analysis.
❤️ Please, support our work with like & comment! ❤️

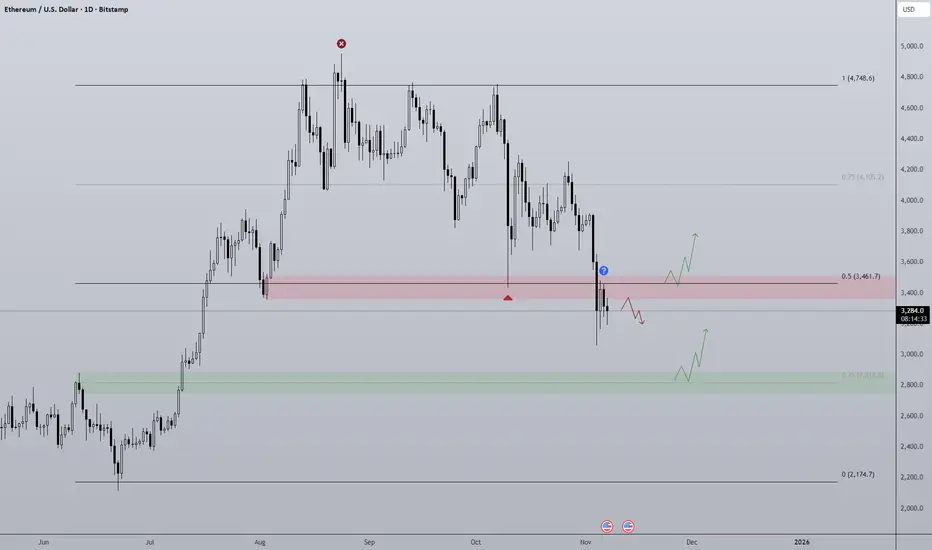
ETH Losing Range Midpoint? Similarly to Bitcoin, Ethereum finds itself around the midpoint of the high time frame range, only ETH has already lost the level and has rejected when retesting. Such a lack of strength is concerning for the project as well as the broader altcoin market.
So there are a few actionable moves I'm looking out for:
Bullish scenario is we maybe chop for a while around/under the midpoint then with high volume the midpoint gets flipped with conviction. That would open the door for the top half of the range to be accessible again. I think this scenario relies on the US Government shutdown coming to an end and QT also ending. Right now there just isn't the liquidity needed to prop up prices hence the slow bleed.
Bearish scenario is a simple continuation of the local bearish trend where 0.25 ($2,800) is the target. This area signaled the break in structure responsible for the previous rally and so I believe it will provide support but is also the target for the bears to reach.
EURJPY My Opinion! SELL!
My dear friends,
EURJPY looks like it will make a good move, and here are the details:
The market is trading on 177.35pivot level.
Bias - Bearish
Technical Indicators: Supper Trend generates a clear short signal while Pivot Point HL is currently determining the overall Bearish trend of the market.
Goal - 176.90
About Used Indicators:
Pivot points are a great way to identify areas of support and resistance, but they work best when combined with other kinds of technical analysis
Disclosure: I am part of Trade Nation's Influencer program and receive a monthly fee for using their TradingView charts in my analysis.
———————————
WISH YOU ALL LUCK

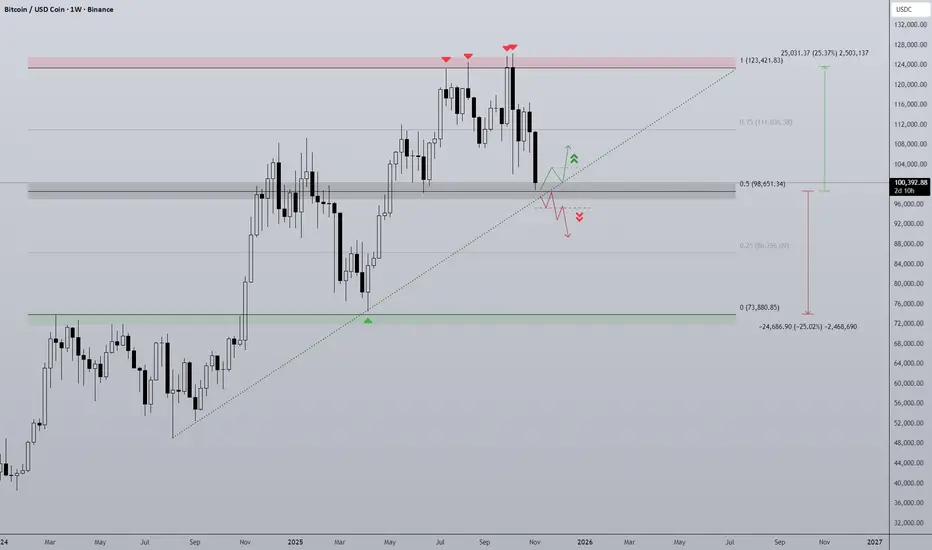
BTC Line In The Sand Bitcoin has had a turbulent Q4 so far and finds itself at ~$100,000 at the start of November.
The chart clearly defines the structure of the move since the beginning of 2024. Once breaking above last cycles ATH of ~$69,000 BTC's price has moved in relatively typical fashion for a bullrun uptrend. The tariff war marking the range low back in April and the highs have been capped at ~$125,000, on 4 separate weeks this area has rejected and remains major resistance.
As of now BTC is retesting the midpoint as support as it did back in June. Where this time is different is the momentum difference, since the first test of range highs the trend has gone into a choppy phase with lower lows being printed. This distribution pattern is vastly different and quite bearish. Another element to this is the diagonal support trendline that intersects the midpoint at roughly current price, losing this trendline would be added confluence that the bullish trend is over.
Should midpoint and diagonal support be lost the bottom half of the range comes into play, a 25% range that would open the door to a full retrace of this cycles progress back to 2021's ATH.
A strong bounce at midpoint keeps the uptrend alive at least in the short term but BTC would need to finally break range high.
CHF/JPY SELLERS WILL DOMINATE THE MARKET|SHORT
CHF/JPY SIGNAL
Trade Direction: short
Entry Level: 190.016
Target Level: 189.715
Stop Loss: 190.214
RISK PROFILE
Risk level: medium
Suggested risk: 1%
Timeframe: 1h
Disclosure: I am part of Trade Nation's Influencer program and receive a monthly fee for using their TradingView charts in my analysis.
✅LIKE AND COMMENT MY IDEAS✅

GOLD: Great Trading Opportunity
GOLD
- Classic bearish formation
- Our team expects pullback
SUGGESTED TRADE:
Swing Trade
Short GOLD
Entry - 4002.6
Sl - 4009.3
Tp - 3990.4
Our Risk - 1%
Start protection of your profits from lower levels
Disclosure: I am part of Trade Nation's Influencer program and receive a monthly fee for using their TradingView charts in my analysis.
❤️ Please, support our work with like & comment! ❤️

USDJPY Will Fall! Sell!
Please, check our technical outlook for USDJPY.
Time Frame: 12h
Current Trend: Bearish
Sentiment: Overbought (based on 7-period RSI)
Forecast: Bearish
The market is approaching a significant resistance area 153.342.
Due to the fact that we see a positive bearish reaction from the underlined area, I strongly believe that sellers will manage to push the price all the way down to 151.544 level.
P.S
Please, note that an oversold/overbought condition can last for a long time, and therefore being oversold/overbought doesn't mean a price rally will come soon, or at all.
Like and subscribe and comment my ideas if you enjoy them!

AUDUSD Will Go Lower From Resistance! Short!
Here is our detailed technical review for AUDUSD.
Time Frame: 2h
Current Trend: Bearish
Sentiment: Overbought (based on 7-period RSI)
Forecast: Bearish
The market is on a crucial zone of supply 0.648.
The above-mentioned technicals clearly indicate the dominance of sellers on the market. I recommend shorting the instrument, aiming at 0.643 level.
P.S
The term oversold refers to a condition where an asset has traded lower in price and has the potential for a price bounce.
Overbought refers to market scenarios where the instrument is traded considerably higher than its fair value. Overvaluation is caused by market sentiments when there is positive news.
Like and subscribe and comment my ideas if you enjoy them!

GOLD Buyers In Panic! SELL!
My dear friends,
GOLD looks like it will make a good move, and here are the details:
The market is trading on 3999.2 pivot level.
Bias - Bearish
Technical Indicators: Supper Trend generates a clear short signal while Pivot Point HL is currently determining the overall Bearish trend of the market.
Goal - 3985.2
Recommended Stop Loss - 4007.7
About Used Indicators:
Pivot points are a great way to identify areas of support and resistance, but they work best when combined with other kinds of technical analysis
Disclosure: I am part of Trade Nation's Influencer program and receive a monthly fee for using their TradingView charts in my analysis.
———————————
WISH YOU ALL LUCK

AUDUSD Will Fall! Sell!
Take a look at our analysis for AUDUSD.
Time Frame: 4h
Current Trend: Bearish
Sentiment: Overbought (based on 7-period RSI)
Forecast: Bearish
The price is testing a key resistance 0.654.
Taking into consideration the current market trend & overbought RSI, chances will be high to see a bearish movement to the downside at least to 0.650 level.
P.S
We determine oversold/overbought condition with RSI indicator.
When it drops below 30 - the market is considered to be oversold.
When it bounces above 70 - the market is considered to be overbought.
Like and subscribe and comment my ideas if you enjoy them!

BTCUSD Short: Bearish Rejection Targeting $100.6K Support ZoneHello traders! Bitcoin (BTCUSD) continues to trade within a well-defined descending channel, reflecting sustained bearish pressure after the rejection from the $116,000 Supply Zone. The market previously experienced a Fibonacci Arc retracement followed by a strong sell-off, signaling exhaustion from buyers and the formation of a broader corrective structure.
Currently, we have seen multiple fake breakouts on both the upper and lower boundaries of the channel, suggesting that liquidity sweeps are actively influencing volatility. Notably, price recently tapped the major Demand Zone around $100,600, a level that has historically triggered strong reactions. The sharp wick and immediate recovery from this support indicate buyer accumulation and defense of the zone. A short-term pivot point has now formed near $103,500–$104,000, marking a key decision area. If buyers hold above the $100,600–$101,000 support, a corrective move toward the upper channel boundary becomes increasingly likely.
I expect Bitcoin to retest the $103,500–$105,000 Pivot Resistance Zone, which aligns with the mid-channel level and previous breakout point. If price shows rejection in this region — such as bearish candlestick patterns or weakening momentum — it would provide a favorable entry point for short positions. A break and hold below $100,600 would strengthen bearish momentum and may trigger a continuation toward $98,000. However, if the price breaks and closes above $105,200, the short setup becomes invalid, as this would signal a potential shift in structure and a move toward $110,000. Manage your risk!

EURJPY Will Move Lower! Short!
Here is our detailed technical review for EURJPY.
Time Frame: 12h
Current Trend: Bearish
Sentiment: Overbought (based on 7-period RSI)
Forecast: Bearish
The market is on a crucial zone of supply 178.721.
The above-mentioned technicals clearly indicate the dominance of sellers on the market. I recommend shorting the instrument, aiming at 176.803 level.
P.S
Overbought describes a period of time where there has been a significant and consistent upward move in price over a period of time without much pullback.
Like and subscribe and comment my ideas if you enjoy them!
