EURUSD Will Go Down! Short!
Here is our detailed technical review for EURUSD.
Time Frame: 1h
Current Trend: Bearish
Sentiment: Overbought (based on 7-period RSI)
Forecast: Bearish
The market is testing a major horizontal structure 1.151.
Taking into consideration the structure & trend analysis, I believe that the market will reach 1.149 level soon.
P.S
Please, note that an oversold/overbought condition can last for a long time, and therefore being oversold/overbought doesn't mean a price rally will come soon, or at all.
Like and subscribe and comment my ideas if you enjoy them!
Short!!!!

GBPJPY Will Move Lower! Sell!
Take a look at our analysis for GBPJPY.
Time Frame: 1D
Current Trend: Bearish
Sentiment: Overbought (based on 7-period RSI)
Forecast: Bearish
The market is approaching a key horizontal level 201.166.
Considering the today's price action, probabilities will be high to see a movement to 197.887.
P.S
The term oversold refers to a condition where an asset has traded lower in price and has the potential for a price bounce.
Overbought refers to market scenarios where the instrument is traded considerably higher than its fair value. Overvaluation is caused by market sentiments when there is positive news.
Like and subscribe and comment my ideas if you enjoy them!

GBPUSD is Tanking Under The Pressure of a Strong Dollar!!Hey Traders, in today’s trading session we’re monitoring GBPUSD for a selling opportunity around the 1.31000 zone. The pair has broken below a key support level and is now showing signs of a potential retracement, possibly setting up a continuation to the downside.
From a fundamental standpoint, the Federal Reserve’s firm tone and the reduced likelihood of a rate cut in December continue to support dollar strength, keeping pressure on the pound.
Watching closely for rejection signals near 1.31000 that could confirm bearish momentum resuming.
Trade safe,
Joe

BTC Price Prediction – Key Support at 98900 Before Next Big MoveBitcoin is currently trading around $105,700, showing a short-term correction after a strong sell-off.
Trendline: A clear descending resistance line continues to hold, capping all recovery attempts.
Break of Structure: The BOS from 109,800 → 103,000 confirms bearish control.
Order Blocks:
🔴 Supply zones: $107,800 → $109,800 and $111,400 → $115,900 — strong resistance where sellers are likely to react.
🔵 Demand zones: $103,000 → $100,000 and a deeper block near $98,900, aligning with a trendline support — potential rebound area.
Volume: Buyer interest weakened after the recent bounce — showing limited demand at current levels.
Bias: Still bearish until BTC breaks above EMA trendline / $107,800 zone.
Next supports are $103,000 and $98,900; resistance levels remain at $107,800 and $111,400.

Gold 8H Forecast- Price will continue to sell off🔥 GOLD (XAU/USD) – 8H Forecast 🔥
Alright fam, let’s break this one down nice and clean 👇
🧠 Bias : Short-term bearish → Long-term bullish
Gold’s cooking a classic pullback setup right now — we’re in a mid-range squeeze after that massive rally and rejection from the external BSL (Buy-Side Liquidity) at the top.
📉 Technical Breakdown
Price broke structure at the top and started forming lower highs under that descending trendline.
We’ve already taken external SSL (Sell-Side Liquidity) below recent lows, showing signs of a cleanup phase.
The current compression looks like a bearish continuation pattern that could push into the 8H demand zone around $3,750 – $3,800.
That zone also aligns perfectly with the 200 EMA, making it a juicy liquidity magnet before any major reversal.
🎯 Potential Play
Short-term:
Watch for a breakdown below current structure → ride it down to that $3,750 demand area.
Ideal short confirmation = rejection at the $3,950 – $4,000 supply zone.
Medium to Long-term:
Once price taps that HTF demand, expect bulls to step back in hard.
A clean rebound from there could launch us toward $4,300 – $4,500, following the red arrow projection. 🚀
⚙️ Risk Management
Avoid early longs until the sweep and reaction from demand confirm a shift.
Keep stops tight above the 8H swing high if shorting.
Wait for structure + volume confirmation before flipping bias long.
🧩 Summary
Gold’s chilling mid-range after a big rally — expect one more dip into demand before the next bullish leg ignites. HTF structure remains intact, but we’re not done with the correction yet. Patience pays here.

AUDCHF: Bearish Continuation & Short Trade
AUDCHF
- Classic bearish setup
- Our team expects bearish continuation
SUGGESTED TRADE:
Swing Trade
Short AUDCHF
Entry Point - 0.5274
Stop Loss - 0.5285
Take Profit - 0.5255
Our Risk - 1%
Start protection of your profits from lower levels
Disclosure: I am part of Trade Nation's Influencer program and receive a monthly fee for using their TradingView charts in my analysis.
❤️ Please, support our work with like & comment! ❤️

CADJPY Massive Short! SELL!
My dear subscribers,
This is my opinion on the CADJPY next move:
The instrument tests an important psychological level 109.12
Bias - Bearish
Technical Indicators: Supper Trend gives a precise Bearish signal, while Pivot Point HL predicts price changes and potential reversals in the market.
Target - 108.83
My Stop Loss - 109.30
About Used Indicators:
On the subsequent day, trading above the pivot point is thought to indicate ongoing bullish sentiment, while trading below the pivot point indicates bearish sentiment.
Disclosure: I am part of Trade Nation's Influencer program and receive a monthly fee for using their TradingView charts in my analysis.
———————————
WISH YOU ALL LUCK

GOLD A Fall Expected! SELL!
My dear subscribers,
GOLD looks like it will make a good move, and here are the details:
The market is trading on 3995.7 pivot level.
Bias - Bearish
My Stop Loss - 4003.2
Technical Indicators: Both Super Trend & Pivot HL indicate a highly probable Bearish continuation.
Target - 3983.4
About Used Indicators:
The average true range (ATR) plays an important role in 'Supertrend' as the indicator uses ATR to calculate its value. The ATR indicator signals the degree of price volatility.
Disclosure: I am part of Trade Nation's Influencer program and receive a monthly fee for using their TradingView charts in my analysis.
———————————
WISH YOU ALL LUCK

GOLD: Short Signal with Entry/SL/TP
GOLD
- Classic bearish formation
- Our team expects pullback
SUGGESTED TRADE:
Swing Trade
Short GOLD
Entry - 3982.0
Sl - 3995.9
Tp - 3959.8
Our Risk - 1%
Start protection of your profits from lower levels
Disclosure: I am part of Trade Nation's Influencer program and receive a monthly fee for using their TradingView charts in my analysis.
❤️ Please, support our work with like & comment! ❤️

USDJPY Under Pressure! SELL!
My dear friends,
Please, find my technical outlook for USDJPY below:
The price is coiling around a solid key level - 154.18
Bias - Bearish
Technical Indicators: Pivot Points High anticipates a potential price reversal.
Super trend shows a clear sell, giving a perfect indicators' convergence.
Goal - 153.86
Safe Stop Loss - 154.35
About Used Indicators:
The pivot point itself is simply the average of the high, low and closing prices from the previous trading day.
Disclosure: I am part of Trade Nation's Influencer program and receive a monthly fee for using their TradingView charts in my analysis.
———————————
WISH YOU ALL LUCK

MSTR - How to profit from a $140 short target🔱 The MS ponzi is taking its toll. 🔱
I’m not laughing, because it’s genuinely unfortunate for everyone who believed in this scam.
But today, I don’t want to rant about that.
I want to show how one could profit from a potential drop of more than $100.
As an Andrews Pitchfork trader, I know there’s roughly an 80% chance that price will reach the centerline. From there, price either reverses in the opposite direction or breaks through the centerline to continue its journey.
That’s exactly what happened with MSTR.
You can see how the price first reached the centerline, held there a few times, and then broke it. Since then, it’s been following the rulebook by moving further to the downside.
Now, there’s another rule worth remembering:
price often tests or retests the line it just broke.
In our case, that line is the centerline.
This means we could be lucky enough to get a pullback to the centerline, and that would be a good level to consider shorting.
The target is usually the opposite line of the centerline, which in our case is the L-MLH (Lower Median Line Parallel).
👉 If you want to learn the full framework and its rules, check the links for free material.
I hope this helps many of you, and I wish you all good profits.

Euro continued Weakness Points to 1.1480 RetestHello traders, I’d like to share my view on EURUSD. The current market structure shows a clear bearish momentum, with the pair consistently forming lower highs and lower lows inside a well-defined descending channel. The rejection from the 1.1660 Resistance Zone — which coincides with a strong Seller Zone — marked the beginning of a sustained downtrend. After a fake breakout attempt above the resistance, the market quickly reversed and continued to decline, confirming that sellers remain in control. The pair is now trading close to the Buyer Zone, which aligns with the Support Level around 1.1500–1.1480. This area has historically acted as a key demand region, making it crucial for the next price reaction. At the moment, EURUSD is respecting both the Resistance Line and the Support Line within the channel, showing the continuation of the bearish cycle. My primary scenario anticipates a potential short-term pullback toward the upper boundary of the channel (around 1.1560–1.1580) before another bearish impulse develops toward TP1 at 1.1480. However, a confirmed breakout above 1.1600 could invalidate this bearish setup and open the way for a broader correction toward the 1.1660 Resistance Level. Until then, the trend remains bearish, and I favor short opportunities targeting 1.1480 as the next key level. Please share this idea with your friends and click Boost 🚀

#040: Short Investment Opportunity on CAD/CHF
In recent days, the Canadian dollar-Swiss franc cross has entered a market configuration closely resembling typical institutional distribution phases.
After weeks of moderate gains, supported by a temporary risk-on sentiment and a moderate recovery in the CAD linked to stable oil prices, the technical structure is now beginning to show signs of losing momentum.
The latest medium-high timeframe candlesticks reveal a progressive compression of the highs, accompanied by volatility that remains contained but with a declining volume delta.
This type of behavior, in intermarket readings, suggests that large operators are reducing long positions rather than accumulating new ones.
At the same time, the Swiss franc is gradually benefiting from a renewed search for protection:
rising global uncertainty and declining real yields are pushing many desks to reactivate the franc as a tactical safe haven.
This isn't yet an impulsive move, but a shift in sentiment that's beginning to be reflected in several crosses tied to the Swiss currency.
On the Canadian front, the macro outlook remains mixed:
The Bank of Canada maintains a cautious stance, openly declaring that monetary policy will remain restrictive "for an extended period," but the historical correlation between the CAD and the commodity cycle continues to make the currency vulnerable to a weakening crude oil price.
In this context, profit-taking at highs becomes natural.
From a microstructural perspective, the current price range represents a fragile equilibrium point:
The presence of passive orders concentrated in a narrow area could amplify the movement if the market decisively breaches the lower distribution margin.
A strong catalyst isn't needed; a return of risk aversion or a repricing of global interest rates is enough to trigger a rotation toward the CHF.

SILVER BEARS ARE GAINING STRENGTH|SHORT
SILVER SIGNAL
Trade Direction: short
Entry Level: 4,774.1
Target Level: 4,681.8
Stop Loss: 4,835.8
RISK PROFILE
Risk level: medium
Suggested risk: 1%
Timeframe: 1h
Disclosure: I am part of Trade Nation's Influencer program and receive a monthly fee for using their TradingView charts in my analysis.
✅LIKE AND COMMENT MY IDEAS✅

EUR/CHF BEST PLACE TO SELL FROM|SHORT
Hello, Friends!
EUR/CHF pair is trading in a local uptrend which we know by looking at the previous 1W candle which is green. On the 9H timeframe the pair is going up too. The pair is overbought because the price is close to the upper band of the BB indicator. So we are looking to sell the pair with the upper BB line acting as resistance. The next target is 0.926 area.
Disclosure: I am part of Trade Nation's Influencer program and receive a monthly fee for using their TradingView charts in my analysis.
✅LIKE AND COMMENT MY IDEAS✅

USDJPY Is Going Down! Short!
Take a look at our analysis for USDJPY.
Time Frame: 1D
Current Trend: Bearish
Sentiment: Overbought (based on 7-period RSI)
Forecast: Bearish
The price is testing a key resistance 153.489.
Taking into consideration the current market trend & overbought RSI, chances will be high to see a bearish movement to the downside at least to 149.764 level.
P.S
Please, note that an oversold/overbought condition can last for a long time, and therefore being oversold/overbought doesn't mean a price rally will come soon, or at all.
Like and subscribe and comment my ideas if you enjoy them!

GBPUSD Will Fall! Sell!
Please, check our technical outlook for GBPUSD.
Time Frame: 1D
Current Trend: Bearish
Sentiment: Overbought (based on 7-period RSI)
Forecast: Bearish
The market is trading around a solid horizontal structure 1.302.
The above observations make me that the market will inevitably achieve 1.280 level.
P.S
The term oversold refers to a condition where an asset has traded lower in price and has the potential for a price bounce.
Overbought refers to market scenarios where the instrument is traded considerably higher than its fair value. Overvaluation is caused by market sentiments when there is positive news.
Like and subscribe and comment my ideas if you enjoy them!

EURJPY Will Go Down From Resistance! Short!
Here is our detailed technical review for EURJPY.
Time Frame: 1h
Current Trend: Bearish
Sentiment: Overbought (based on 7-period RSI)
Forecast: Bearish
The market is testing a major horizontal structure 176.410.
Taking into consideration the structure & trend analysis, I believe that the market will reach 175.373 level soon.
P.S
We determine oversold/overbought condition with RSI indicator.
When it drops below 30 - the market is considered to be oversold.
When it bounces above 70 - the market is considered to be overbought.
Like and subscribe and comment my ideas if you enjoy them!

NZDJPY Will Move Lower! Sell!
Here is our detailed technical review for NZDJPY.
Time Frame: 1h
Current Trend: Bearish
Sentiment: Overbought (based on 7-period RSI)
Forecast: Bearish
The market is on a crucial zone of supply 87.148.
The above-mentioned technicals clearly indicate the dominance of sellers on the market. I recommend shorting the instrument, aiming at 86.732 level.
P.S
The term oversold refers to a condition where an asset has traded lower in price and has the potential for a price bounce.
Overbought refers to market scenarios where the instrument is traded considerably higher than its fair value. Overvaluation is caused by market sentiments when there is positive news.
Like and subscribe and comment my ideas if you enjoy them!

Bitcoin TA and ALT coin TAHi guys,
I hope you enjoyed the video! Its going to be a very existing next 3 months!

GBPUSD within Bearish StructureHi Traders!
With price failing to swing higher I'm still seeing it's within bearish structure. The 1.35000 area looks like a strong resistance/supply zone. If price fails to break and close above it, that reinforces my bearish bias.
As of now, the current bounce looks corrective- possibly a retracement toward the 1.3500 zone before sellers step in again.
If price rejects near 1.35000 and continues to break below, then the next level I'd be considering would be 1.30000.
In addition, DXY is sitting at a higher low zone on a higher TF. It hasn't broken its longer-term uptrend yet. The price action looks like it's attempting a base/reversal. If it holds within 98.000-98.500 and starts pushing up, that could align with GBPUSD weakness.
*DISCLAIMER: I am not a financial advisor. The ideas and trades I take on my page are for educational and entertainment purposes only. I'm just showing you guys how I trade. Remember, trading of any kind involves risk. Your investments are solely your responsibility and not mine.*

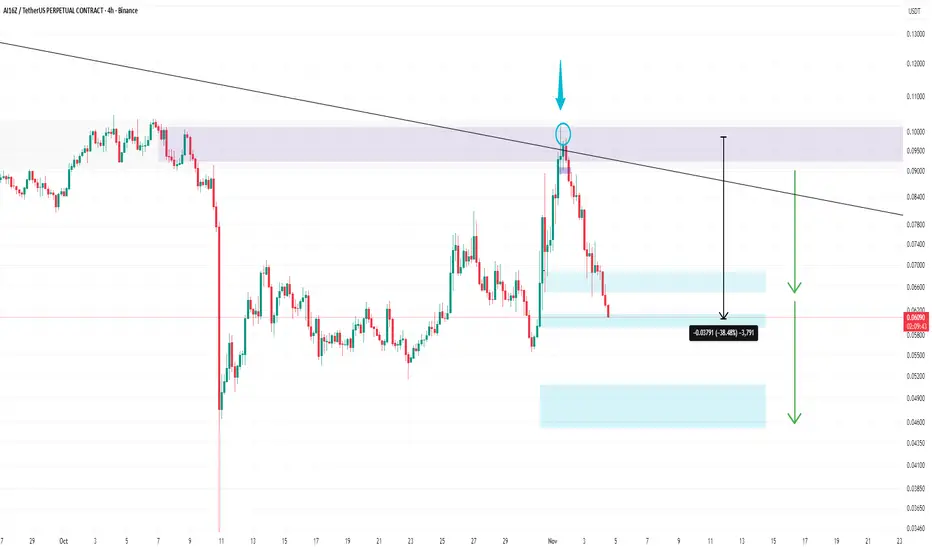
AI16Z Update #1 ShortHello everyone 😍
💁♂️ I'm back with an update on the analysis of the AI16Z cryptocurrency
Unfortunately, the previous analysis was accompanied by a bit of bad luck, but since the area in question was very important to me, I entered the short position again inside the blue circle and the second target was touched and it fell by 38.5%. 🔥🔥
First target area $0.067 ✅
Second target area $0.0602 ✅
Last target area $0.052
Did anyone use the analysis?
Was it useful for you?
Share your comments with me.
⚠️The analysis may not reach the final target, so at each target, if you make a good profit and see signs of a trend change, you can exit the trade or manage your capital.
⚠️ None of the analysis is a recommendation to buy or sell, but simply my personal opinions on the charts. You can use the charts and choose any that interest you and take a position if you wish.
To support me, I would appreciate it if you boost the analysis and share it with your friends so that I can analyze it with more energy for you, my dears. Thank you all. 💖
AUDUSD Potential DownsidesHey Traders, in today's trading session we are monitoring AUDUSD for a selling opportunity around 0.65300 zone, AUDUSD is trading in a downtrend and currently is in a correction phase in which it is approaching the trend at 0.65300 support and resistance area.
Trade safe, Joe.
