NZDCHF Under Pressure! SELL!
My dear friends,
Please, find my technical outlook for NZDCHF below:
The price is coiling around a solid key level - 0.4593
Bias - Bearish
Technical Indicators: Pivot Points Low anticipates a potential price reversal.
Super trend shows a clear sell, giving a perfect indicators' convergence.
Goal - 0.4584
Safe Stop Loss - 0.4598
About Used Indicators:
The pivot point itself is simply the average of the high, low and closing prices from the previous trading day.
Disclosure: I am part of Trade Nation's Influencer program and receive a monthly fee for using their TradingView charts in my analysis.
———————————
WISH YOU ALL LUCK
Short!!!!

EURUSD: Bearish Continuation & Short Signal
EURUSD
- Classic bearish formation
- Our team expects fall
SUGGESTED TRADE:
Swing Trade
Sell EURUSD
Entry Level - 1.1737
Sl - 1.1744
Tp - 1.1724
Our Risk - 1%
Start protection of your profits from lower levels
Disclosure: I am part of Trade Nation's Influencer program and receive a monthly fee for using their TradingView charts in my analysis.
❤️ Please, support our work with like & comment! ❤️

#047: Short Investment Opportunity on GBP/AUD
The GBP/AUD exchange rate is currently in a particularly interesting technical phase, characterized by a structure that deserves attention from those who analyze the market with a professional, non-reactive approach. The recent movement displays all the typical characteristics of a corrective rally rather than a genuine directional impulse, suggesting that the market is working more on redistributing liquidity than building a new uptrend.
From a structural perspective, the price is operating in an area definable as "premium," where institutional traders historically tend to reduce long exposures and build opposite positions. The lack of acceleration, combined with a progressive loss of momentum, reinforces the hypothesis that the current movement is incentivizing late retail entry rather than supporting a directional continuation.
Price action analysis highlights signs of absorption at the upper end of the structure. Candlesticks show progressive rejections and the price's inability to consolidate above key areas, a behavior typical of distribution phases. In these contexts, the market does not need to decline immediately: it often trades sideways or with small, controlled increases, precisely to accumulate the liquidity necessary for the next move.
From a volume perspective, the picture is also consistent. Volumes do not convincingly accompany the rise, and the areas of greatest trading are located above the current price, suggesting that the most significant participation occurred in higher areas. This type of configuration tends to favor, over time, a price reversion to underlying areas of inefficiency, where liquidity is not yet fully explored.
Retail sentiment, cross-referenced across multiple sources, appears balanced and free of extremes. This is particularly important: the absence of an unbalanced positioning eliminates the risk of sudden contrarian movements and leaves room for a dynamic driven primarily by the technical structure and liquidity management. In other words, it is not sentiment that drives the market in this phase, but rather the logic of price.
On the macro and intermarket levels, the cross reflects a period of relative uncertainty, with neither currency expressing enough dominance to justify impulsive movements. This reinforces the idea of an environment favorable to mean reversion trades and re-entries toward equilibrium areas, rather than aggressive directional extensions.
In short, GBP/AUD is in a configuration that, from an institutional perspective, is typically associated with distribution phases and potential subsequent corrective movements. As always, the key is not to anticipate the market, but to wait for the price to provide confirmation through the behavior of the candlesticks and the structure. In these contexts, patience and operational discipline make the difference between a theoretically correct analysis and a truly professionally executed trade.
The market shouldn't be chased: it should be read. And when the structure speaks clearly, the trader's job is not to predict, but to recognize.

USOIL: Short Trade Explained
USOIL
- Classic bearish pattern
- Our team expects retracement
SUGGESTED TRADE:
Swing Trade
Sell USOIL
Entry - 56.53
Stop - 56.72
Take - 56.20
Our Risk - 1%
Start protection of your profits from lower levels
Disclosure: I am part of Trade Nation's Influencer program and receive a monthly fee for using their TradingView charts in my analysis.
❤️ Please, support our work with like & comment! ❤️

GBPUSD Is Very Bearish! Short!
Please, check our technical outlook for GBPUSD.
Time Frame: 1D
Current Trend: Bearish
Sentiment: Overbought (based on 7-period RSI)
Forecast: Bearish
The price is testing a key resistance 1.338.
Taking into consideration the current market trend & overbought RSI, chances will be high to see a bearish movement to the downside at least to 1.322 level.
P.S
The term oversold refers to a condition where an asset has traded lower in price and has the potential for a price bounce.
Overbought refers to market scenarios where the instrument is traded considerably higher than its fair value. Overvaluation is caused by market sentiments when there is positive news.
Like and subscribe and comment my ideas if you enjoy them!

AUD/CHF BEARS ARE GAINING STRENGTH|SHORT
Hello, Friends!
Previous week’s green candle means that for us the AUD/CHF pair is in the uptrend. And the current movement leg was also up but the resistance line will be hit soon and upper BB band proximity will signal an overbought condition so we will go for a counter-trend short trade with the target being at 0.524.
Disclosure: I am part of Trade Nation's Influencer program and receive a monthly fee for using their TradingView charts in my analysis.
✅LIKE AND COMMENT MY IDEAS✅

AAVEUSD — SHORT IDEA (BEARISH ORDER FLOW)Price is trading at premium levels and reacting from a strong supply zone.
Buy-side liquidity has already been taken, which suggests smart money distribution.
Not financial advice. Trade at your own risk
Invalidation if price hits the target before triggering entry, as this is a more conservative entry.

USDJPY: Bears Will Push Lower
The price of USDJPY will most likely collapse soon enough, due to the supply beginning to exceed demand which we can see by looking at the chart of the pair.
Disclosure: I am part of Trade Nation's Influencer program and receive a monthly fee for using their TradingView charts in my analysis.
❤️ Please, support our work with like & comment! ❤️

US30: Bearish Continuation & Short Trade
US30
- Classic bearish setup
- Our team expects bearish continuation
SUGGESTED TRADE:
Swing Trade
Short US30
Entry Point - 48139
Stop Loss - 48220
Take Profit - 48005
Our Risk - 1%
Start protection of your profits from lower levels
Disclosure: I am part of Trade Nation's Influencer program and receive a monthly fee for using their TradingView charts in my analysis.
❤️ Please, support our work with like & comment! ❤️

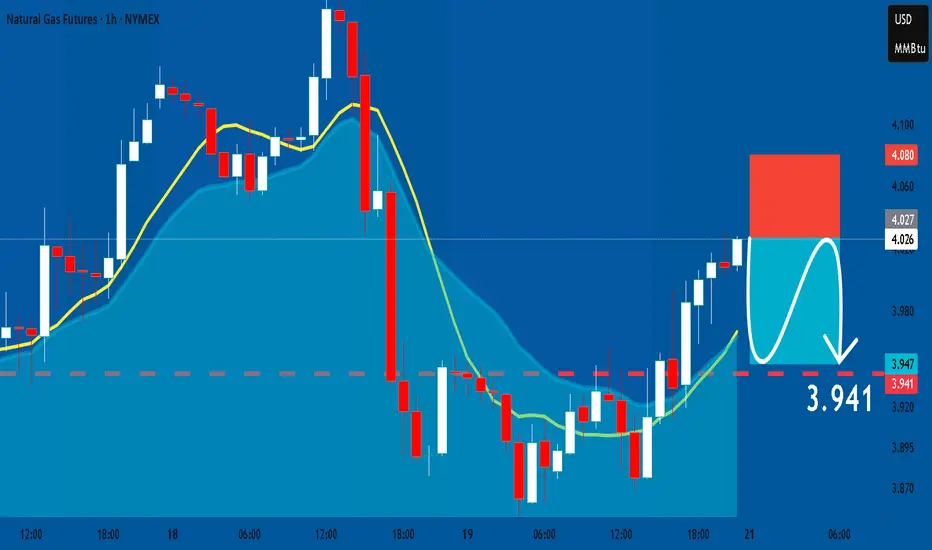
NATGAS: Short Signal with Entry/SL/TP
NATGAS
- Classic bearish formation
- Our team expects fall
SUGGESTED TRADE:
Swing Trade
Sell NATGAS
Entry Level - 4.027
Sl - 4.080
Tp - 3.941
Our Risk - 1%
Start protection of your profits from lower levels
Disclosure: I am part of Trade Nation's Influencer program and receive a monthly fee for using their TradingView charts in my analysis.
❤️ Please, support our work with like & comment! ❤️
USOIL What Next? SELL!
My dear friends,
Please, find my technical outlook for USOIL below:
The instrument tests an important psychological level 56.53
Bias - Bearish
Technical Indicators: Supper Trend gives a precise Bearish signal, while Pivot Point HL predicts price changes and potential reversals in the market.
Target - 56.17
Recommended Stop Loss - 56.74
About Used Indicators:
Super-trend indicator is more useful in trending markets where there are clear uptrends and downtrends in price.
Disclosure: I am part of Trade Nation's Influencer program and receive a monthly fee for using their TradingView charts in my analysis.
———————————
WISH YOU ALL LUCK

US100 My Opinion! SELL!
My dear subscribers,
US100 looks like it will make a good move, and here are the details:
The market is trading on 25354 pivot level.
Bias - Bearish
Technical Indicators: Both Super Trend & Pivot HL indicate a highly probable Bearish continuation.
Target - 25068
About Used Indicators:
The average true range (ATR) plays an important role in 'Supertrend' as the indicator uses ATR to calculate its value. The ATR indicator signals the degree of price volatility.
Disclosure: I am part of Trade Nation's Influencer program and receive a monthly fee for using their TradingView charts in my analysis.
———————————
WISH YOU ALL LUCK

SILVER Set To Fall! SELL!
My dear subscribers,
My technical analysis for SILVER is below:
The price is coiling around a solid key level - 67.212
Bias - Bearish
Technical Indicators: Pivot Points Low anticipates a potential price reversal.
Super trend shows a clear sell, giving a perfect indicators' convergence.
Goal - 66.355
My Stop Loss - 67.771
About Used Indicators:
By the very nature of the supertrend indicator, it offers firm support and resistance levels for traders to enter and exit trades. Additionally, it also provides signals for setting stop losses
Disclosure: I am part of Trade Nation's Influencer program and receive a monthly fee for using their TradingView charts in my analysis.
———————————
WISH YOU ALL LUCK

GOLD Is Going Down! Sell!
Here is our detailed technical review for GOLD.
Time Frame: 1D
Current Trend: Bearish
Sentiment: Overbought (based on 7-period RSI)
Forecast: Bearish
The market is trading around a solid horizontal structure 4,340.66.
The above observations make me that the market will inevitably achieve 4,164.19 level.
P.S
We determine oversold/overbought condition with RSI indicator.
When it drops below 30 - the market is considered to be oversold.
When it bounces above 70 - the market is considered to be overbought.
Like and subscribe and comment my ideas if you enjoy them!

EURUSD Will Fall! Short!
Take a look at our analysis for EURUSD.
Time Frame: 1D
Current Trend: Bearish
Sentiment: Overbought (based on 7-period RSI)
Forecast: Bearish
The market is testing a major horizontal structure 1.171.
Taking into consideration the structure & trend analysis, I believe that the market will reach 1.161 level soon.
P.S
Overbought describes a period of time where there has been a significant and consistent upward move in price over a period of time without much pullback.
Like and subscribe and comment my ideas if you enjoy them!

AUDCHF Will Go Lower From Resistance! Sell!
Please, check our technical outlook for AUDCHF.
Time Frame: 1h
Current Trend: Bearish
Sentiment: Overbought (based on 7-period RSI)
Forecast: Bearish
The market is approaching a key horizontal level 0.525.
Considering the today's price action, probabilities will be high to see a movement to 0.524.
P.S
Please, note that an oversold/overbought condition can last for a long time, and therefore being oversold/overbought doesn't mean a price rally will come soon, or at all.
Like and subscribe and comment my ideas if you enjoy them!

USOIL SELLERS WILL DOMINATE THE MARKET|SHORT
USOIL SIGNAL
Trade Direction: short
Entry Level: 56.54
Target Level: 55.07
Stop Loss: 57.51
RISK PROFILE
Risk level: medium
Suggested risk: 1%
Timeframe: 4h
Disclosure: I am part of Trade Nation's Influencer program and receive a monthly fee for using their TradingView charts in my analysis.
✅LIKE AND COMMENT MY IDEAS✅

AUD/NZD BEST PLACE TO SELL FROM|SHORT
Hello, Friends!
AUD/NZD pair is in the uptrend because previous week’s candle is green, while the price is obviously rising on the 9H timeframe. And after the retest of the resistance line above I believe we will see a move down towards the target below at 1.142 because the pair overbought due to its proximity to the upper BB band and a bearish correction is likely.
Disclosure: I am part of Trade Nation's Influencer program and receive a monthly fee for using their TradingView charts in my analysis.
✅LIKE AND COMMENT MY IDEAS✅

BTC – Weak Rebound Below EMAs, Bias Still Toward CorrectionHello everyone, Domic here.
Looking at BTC on the H4 timeframe right now, the overall feeling is not panic — but there is certainly nothing reassuring either. Price is trading around 85,700 USD, sitting firmly below both the EMA34 and EMA89, and that alone already says a lot about the current market condition.
Since mid-month, a lower high – lower low structure has become fairly clear. The rebound we are seeing at the moment is essentially just a technical pullback after the prior sharp sell-off, as price attempts to climb back up and retest resistance. However, BTC has still failed to reclaim the EMA34, which shows that buying pressure is not strong enough to regain short-term control. At this stage, EMA34 acts as an overhead pressure ceiling, while EMA89 remains the key boundary defining the H4 trend. As long as price stays below both of these moving averages, the market should still be viewed from a defensive perspective.
On the macro and news side, BTC is not being driven by any crypto-specific shock, but rather by broader macro conditions and the risk-on / risk-off environment. The Fed continues to signal higher rates for longer, making it difficult for risk assets to attract fresh inflows. US Treasury yields remain elevated, pushing short-term capital toward the USD and bonds instead of crypto. US equities are undergoing a mild correction, and BTC, at this stage, is still moving quite in sync with the broader risk asset complex. In addition, inflows into spot Bitcoin ETFs have cooled significantly compared to the earlier surge, further weakening the price support.
From my perspective, as long as BTC remains below the EMA34, any upward move should still be treated as a rebound into resistance. And while price stays below the EMA89, the H4 trend remains in a corrective state.

AUDJPY: Expecting Bearish Movement! Here is Why:
Our strategy, polished by years of trial and error has helped us identify what seems to be a great trading opportunity and we are here to share it with you as the time is ripe for us to sell AUDJPY.
Disclosure: I am part of Trade Nation's Influencer program and receive a monthly fee for using their TradingView charts in my analysis.
❤️ Please, support our work with like & comment! ❤️

USDCHF: Short Signal Explained
USDCHF
- Classic bearish formation
- Our team expects pullback
SUGGESTED TRADE:
Swing Trade
Short USDCHF
Entry - 0.7951
Sl - 0.7955
Tp - 0.7944
Our Risk - 1%
Start protection of your profits from lower levels
Disclosure: I am part of Trade Nation's Influencer program and receive a monthly fee for using their TradingView charts in my analysis.
❤️ Please, support our work with like & comment! ❤️

NZDJPY Will Collapse! SELL!
My dear followers,
This is my opinion on the NZDJPY next move:
The asset is approaching an important pivot point 90.656
Bias - Bearish
Technical Indicators: Supper Trend generates a clear short signal while Pivot Point HL is currently determining the overall trend of the market.
Goal - 90.219
About Used Indicators:
For more efficient signals, super-trend is used in combination with other indicators like Pivot Points.
Disclosure: I am part of Trade Nation's Influencer program and receive a monthly fee for using their TradingView charts in my analysis.
———————————
WISH YOU ALL LUCK

AUDCHF Will Collapse! SELL!
My dear followers,
I analysed this chart on AUDCHF and concluded the following:
The market is trading on 0.5263 pivot level.
Bias - Bearish
Technical Indicators: Both Super Trend & Pivot HL indicate a highly probable Bearish continuation.
Target - 0.5255
Safe Stop Loss - 0.5268
About Used Indicators:
A super-trend indicator is plotted on either above or below the closing price to signal a buy or sell. The indicator changes color, based on whether or not you should be buying. If the super-trend indicator moves below the closing price, the indicator turns green, and it signals an entry point or points to buy.
Disclosure: I am part of Trade Nation's Influencer program and receive a monthly fee for using their TradingView charts in my analysis.
———————————
WISH YOU ALL LUCK
