XAUUSD Trade IdeaHello Traders,
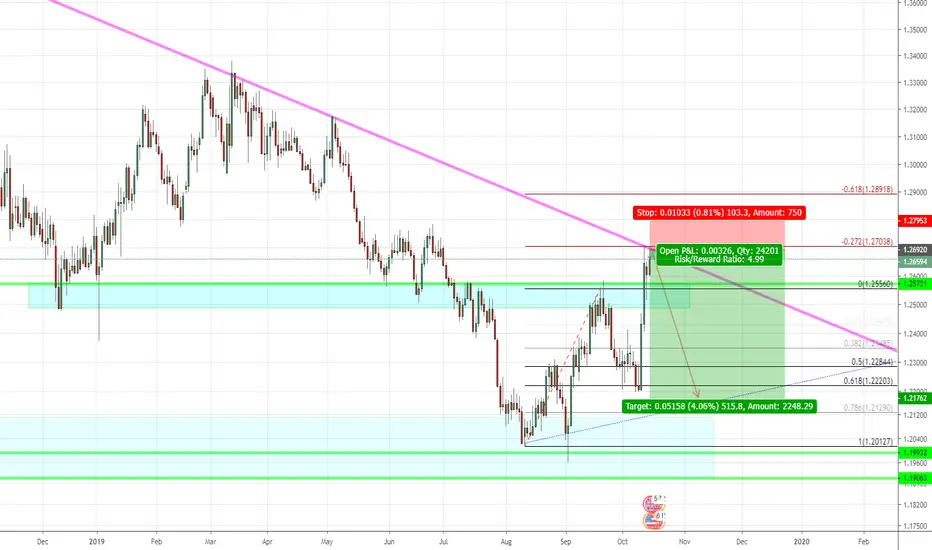
Here's my analysis for XAUUSD, it seems to be retesting back to the 0.618-0.786 fib level!
TRADE SAFE
Short-trade


Successful Short Trade (BOUNCER Market)Cable is in an obvious BOUNCER market here, which is great!
We are allowed to trade both short and long, inside the recognized range
- as long as our TS has all of our trades are fully confirmed.
Most technical studies show near-perfect signals when Mr. Bouncer rules the game.
Recognized and confirmed a trading opportunity at point marked with the callout.
Trade successfully closed hitting PL within just 1 60m candle.
Happy CONDI trading!

NZDJPY: Great Selling Opportunity
NZDJPY is approaching a strong resistance area.
I will short the market in case of a bearish breakout of a rising wedge pattern.
Target levels will be:
72.0 / 71.75

AGI GO DOWN FOR NICE PROFITS DUE TO BITCOIN MOVE Hey here is AGI trade Call
Buy in 235-240
Sell 245-260
Short Trade


Short movement coming on GBP/USD by ThinkingAntsOk4H CHART EXPLANATION:
Price has bounced at the confluence zone between the Ascending Channel and the Resistance Zone (observe the daily chart below). After that, it has broken the Ascending Trendline, and now it is consolidating below. We consider that should be a nice bearish movement in the short term.
DAILY CHART ANALYSIS:


AMD SHORT! This is beautiful.Someone pointed out to me how high $AMD was and this just JUMPED out at me as a short.
Fib time zones...
But look at how clear this is
We even have a very clear stop on the 1 hr.
For sure on watch Monday
Join our discord and tell us what you see. Its free
discord.gg


Short Trade on CAD/CHF by ThinkingAntsOk4H CHART EXPLANATION:
We observe that price is consolidating on a corrective structure below the Broken Ascending Trendline. Now we will wait for a breakout and a bearish movement towards the Support Zone at 0.74500. If this zone is broken, then there is potential to reach the Support Zone at 0.7300.
DAILY CHART EXPLANATION:


CHF/JPY SHORTFew reasons to go short on this pair:
1. We had a rejection on a major trendline on a Daily/4h chart.
2. Price broke out of a rising channel and at the moment is retesting the trendline.
3. We had a cross on ichimoku cloud on 30m, also MACD and RSI are matching their movement to the downside.

GOOG - STRONG SELL - Wave Failure - Wave Theory & FibonacciGOOG looks to be expeienceing what I would call 'wave failure' and remains a STRONG SELL!
GOOG complete Cycle Waves 1,2,3 and 4.
But, now the 5th impulse waves seems to be collapsing...
Normal Terminal points for the 5th Wave are between .382-.618
GOOG briefly touch .382 before it retreated...
NASDAQ:GOOG is a very interesting chart.
*Please see related idea for further analysis
-AB


BTCUSD - thinking we expand to the downside Good Luck. Thinking we expand to the downside. Trade Active


Divergence VOL III: AUDJPY Short!Short trade at AUDJPY. Great RR-ratio, Divergence confirm the forecast, target the next support level.
