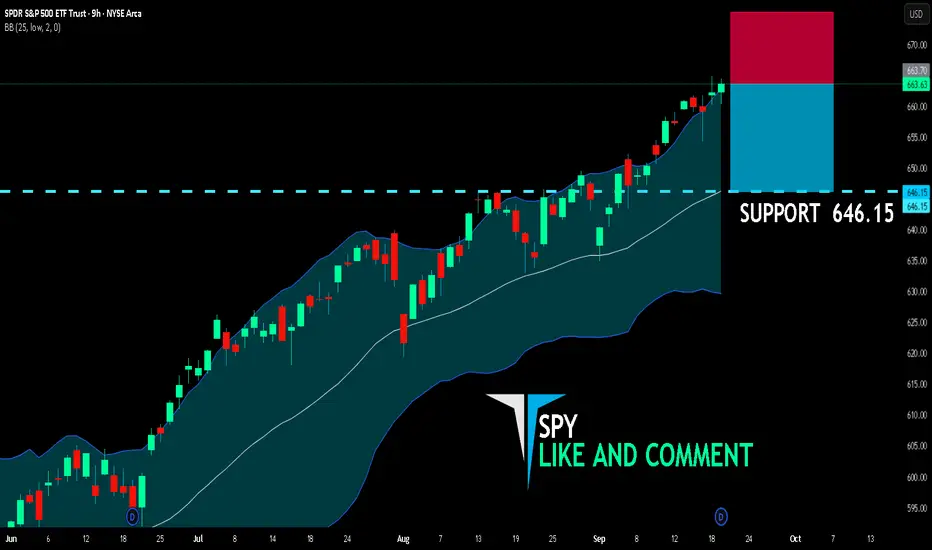
SPY SHORT FROM RESISTANCE
SPY SIGNAL
Trade Direction: short
Entry Level: 663.70
Target Level: 646.15
Stop Loss: 675.36
RISK PROFILE
Risk level: medium
Suggested risk: 1%
Timeframe: 9h
Disclosure: I am part of Trade Nation's Influencer program and receive a monthly fee for using their TradingView charts in my analysis.
✅LIKE AND COMMENT MY IDEAS✅
Short
The Big Short? BTCHere we have an ascending channel on the 15 minute chart bulls have been weak since our recent top. I feel a strong move is coming here soon in the market time to lock in.

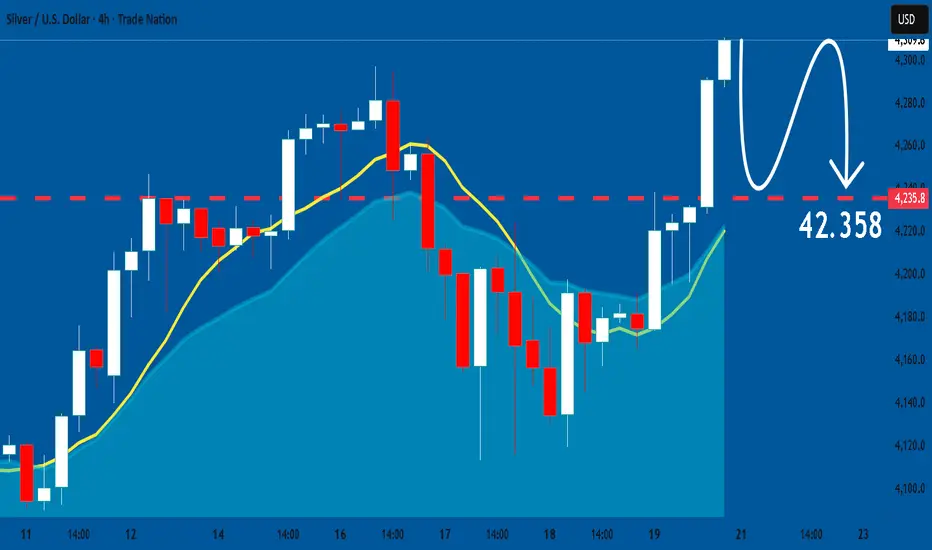
SILVER: Market Sentiment & Price Action
Remember that we can not, and should not impose our will on the market but rather listen to its whims and make profit by following it. And thus shall be done today on the SILVER pair which is likely to be pushed down by the bears so we will sell!
Disclosure: I am part of Trade Nation's Influencer program and receive a monthly fee for using their TradingView charts in my analysis.
❤️ Please, support our work with like & comment! ❤️
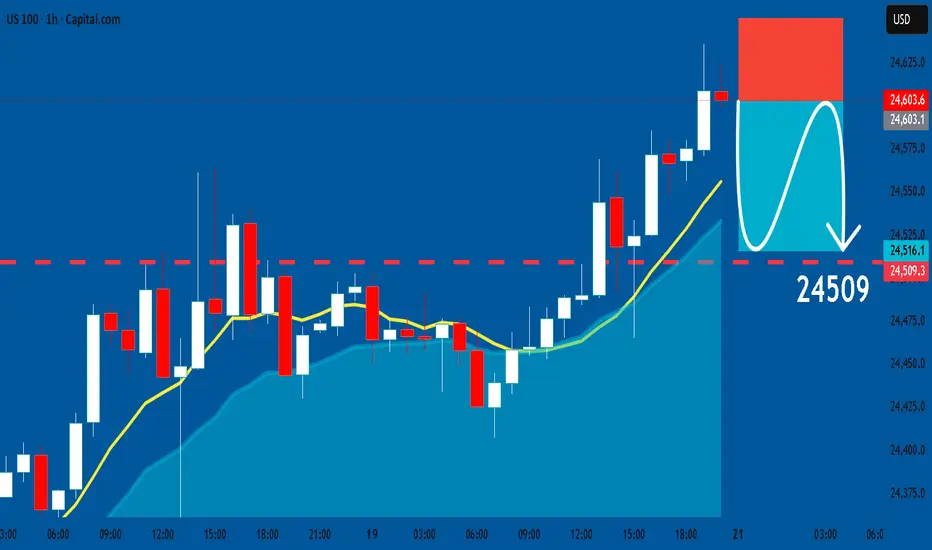
US100: Short Signal with Entry/SL/TP
US100
- Classic bearish formation
- Our team expects fall
SUGGESTED TRADE:
Swing Trade
Sell US100
Entry Level - 24603
Sl - 24651
Tp - 24509
Our Risk - 1%
Start protection of your profits from lower levels
Disclosure: I am part of Trade Nation's Influencer program and receive a monthly fee for using their TradingView charts in my analysis.
❤️ Please, support our work with like & comment! ❤️
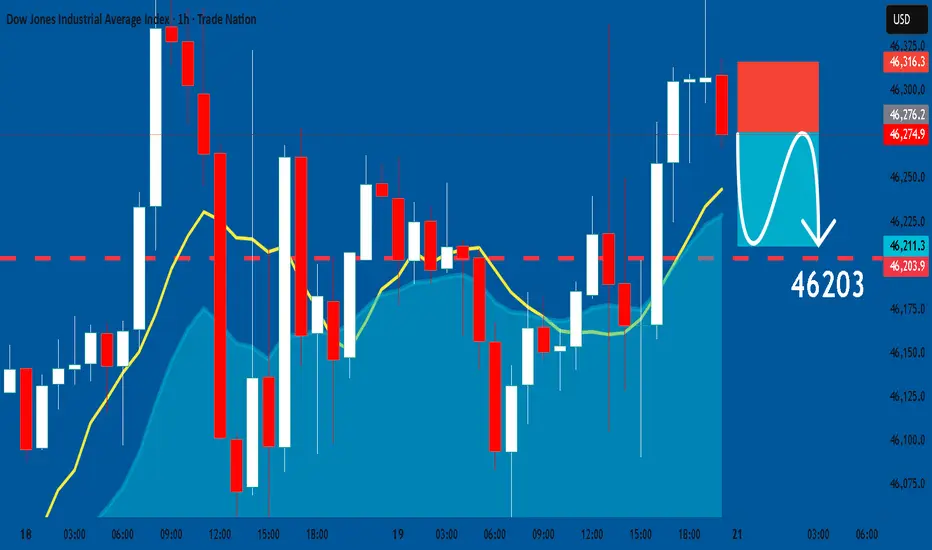
US30: Short Signal Explained
US30
- Classic bearish formation
- Our team expects pullback
SUGGESTED TRADE:
Swing Trade
Short US30
Entry - 46276
Sl - 46316
Tp - 46203
Our Risk - 1%
Start protection of your profits from lower levels
Disclosure: I am part of Trade Nation's Influencer program and receive a monthly fee for using their TradingView charts in my analysis.
❤️ Please, support our work with like & comment! ❤️
SPY Trading Opportunity! SELL!
My dear friends,
Please, find my technical outlook for SPY below:
The instrument tests an important psychological level 663.63
Bias - Bearish
Technical Indicators: Supper Trend gives a precise Bearish signal, while Pivot Point HL predicts price changes and potential reversals in the market.
Target - 661.35
Recommended Stop Loss - 664.75
About Used Indicators:
Super-trend indicator is more useful in trending markets where there are clear uptrends and downtrends in price.
Disclosure: I am part of Trade Nation's Influencer program and receive a monthly fee for using their TradingView charts in my analysis.
———————————
WISH YOU ALL LUCK

USOIL (WTI Crude Oil) Intraday & Swing Outlook🛢️ USOIL (WTI Crude Oil) Forecast – Intraday & Swing Outlook 🚀📉
Asset Class: USOIL (SPOTCRUDE / WTI CASH)
Last Closing Price: $62.796
Date/Time: 20th Sept 2025 – 12:50 AM UTC+4
🔍 Market Context
Crude oil remains in a volatile zone as macro factors like OPEC+ policy, global demand recovery, and geopolitical risks continue to steer momentum. Traders must prepare for short squeezes, traps, and breakout plays this week.
📊 Technical Overview
Chart Theories Applied:
📈 Elliott Waves – corrective Phase B nearing end.
🔄 Wyckoff – signs of re-accumulation spotted.
🔺 Head & Shoulders (Inverse) – potential bullish reversal.
🔮 Gann Angles & Time Cycle – short-term resistance clustering near $64.50.
🛠️ Indicators
🔵 RSI (H1) → Neutral zone (48–52).
📏 VWAP Anchored → $62.20 (support pivot).
📉 EMA 20 / EMA 50 → Bullish cross on H4 confirmed.
🎯 Bollinger Bands → Expansion phase → Expect high volatility.
🕒 Timeframe Strategies
📌 Intraday (5M / 15M / 1H / 4H)
Buy Entry (Scalp): $62.20 – $62.50 🟢
TP1: $63.20 🎯
TP2: $63.85 🎯
SL: $61.80 ❌
Sell Entry (Scalp): $63.80 – $64.20 🔴
TP1: $63.00 🎯
TP2: $62.40 🎯
SL: $64.70 ❌
📌 Swing (Daily / Weekly)
Buy Zone: $61.50 – $62.00 🟢
Targets: $65.20 / $67.40 / $70.00 🎯
Stop Loss: $60.50 ❌
Sell Zone (Rejection): $67.40 – $68.00 🔴
Targets: $64.50 / $62.20 🎯
Stop Loss: $68.80 ❌
⚠️ Risk Management
Volatility expected due to Fed rate guidance & OPEC+ commentary.
Stick to 2–3% capital risk per trade.
Watch for bull/bear traps near breakout zones.
📌 Summary
Intraday: Range $62.20 – $64.20 ⚖️
Swing: Upside bias if $61.50 holds strong 💹
Key Resistance: $64.50 / $67.40
Key Support: $61.50 / $60.50
🔥 Bias: Short-term sideways → Medium-term bullish above $61.50.
For individuals seeking to enhance their trading abilities based on the analyses provided, I recommend exploring the mentoring program offered by Shunya Trade. (Website: shunya dot trade)
I would appreciate your feedback on this analysis, as it will serve as a valuable resource for future endeavors.
Sincerely,
Shunya.Trade
Website: shunya dot trade

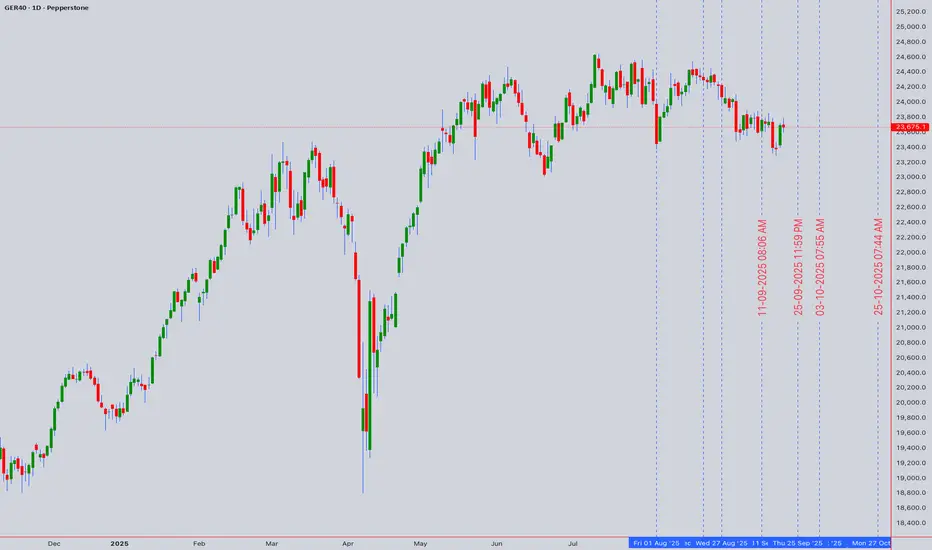
GER40 (DAX40) Technical Forecast📊🇩🇪 GER40 (DAX40) Technical Forecast – Intraday & Swing Outlook
Asset Class: GER40 CFD (DAX40)
Current Close: 23,675.1 (20th Sept 2025, 12:50 AM UTC+4)
🔎 Technical Setup
🕯 Candlesticks: Strong rejection tails at resistance, suggesting supply pressure.
🌊 Elliott Waves: Market in corrective wave phase after strong rally.
📐 Harmonics: Possible Bearish Gartley forming near 23,950 zone.
📊 Wyckoff: Distribution signs emerging after extended markup.
📏 Gann Angles: 23,800 key pivot (time & price convergence).
☁️ Ichimoku: Price testing Kijun resistance; cloud support below 23,400.
📈 Indicators
💪 RSI (H1): 65 – nearing overbought zone.
📉 RSI (Daily): Neutral → potential downside risk.
🎯 Bollinger Bands: Pinching – volatility expansion expected.
⚖️ VWAP (Weekly): 23,520 – magnet level.
📊 MA Cross: Short-term EMA threatening bearish crossover.
⏱ Intraday Outlook
🕒 Key Levels:
🟢 Buy Zone: 23,420 – 23,480 (bounce setup).
🔴 Sell Zone: 23,800 – 23,950 (rejection expected).
🎯 Targets:
Upside: 23,720 → 23,840 → 23,950
Downside: 23,520 → 23,400 → 23,250
⚡ Bias: Range-bound with bearish tilt near highs.
📆 Swing Trading Outlook
🟢 Swing Buy Entry: 23,200 – 23,300 (strong demand zone).
🎯 Upside Swing Targets: 23,850 → 24,100 → 24,350
🔴 Swing Sell Entry: 23,900 – 24,050 (supply area).
🎯 Downside Swing Targets: 23,400 → 23,050 → 22,750
📉 Bias: Bearish divergence forming – possible correction if 23,900 rejects.
🌐 Market Context
⚠️ Eurozone slowdown + ECB policy risks may cap upside.
📊 US indices correlation → keep an eye on US500/NAS100.
🛢 Energy price spikes = potential drag on DAX industries.
📝 Trading Plan
✔️ Intraday traders: Sell rallies into 23,800–23,950 🔻
✔️ Swing traders: Accumulate near 23,200–23,300 🟢
✔️ Manage risk: Always place tight stops below support or above resistance.
🔥 Conclusion:
DAX40 (GER40) faces stiff resistance at 23,900. Intraday range traders can fade extremes, while swing traders prepare for a correction towards 23,200 support before the next big move.
For individuals seeking to enhance their trading abilities based on the analyses provided, I recommend exploring the mentoring program offered by Shunya Trade. (Website: shunya dot trade)
I would appreciate your feedback on this analysis, as it will serve as a valuable resource for future endeavors.
Sincerely,
Shunya.Trade
Website: shunya dot trade
SILVER Is Going Down! Sell!
Please, check our technical outlook for SILVER.
Time Frame: 1h
Current Trend: Bearish
Sentiment: Overbought (based on 7-period RSI)
Forecast: Bearish
The market is trading around a solid horizontal structure 4,309.9.
The above observations make me that the market will inevitably achieve 4,247.3 level.
P.S
Overbought describes a period of time where there has been a significant and consistent upward move in price over a period of time without much pullback.
Like and subscribe and comment my ideas if you enjoy them!

EURGBP Will Fall! Short!
Here is our detailed technical review for EURGBP.
Time Frame: 1D
Current Trend: Bearish
Sentiment: Overbought (based on 7-period RSI)
Forecast: Bearish
The market is testing a major horizontal structure 0.871.
Taking into consideration the structure & trend analysis, I believe that the market will reach 0.864 level soon.
P.S
Please, note that an oversold/overbought condition can last for a long time, and therefore being oversold/overbought doesn't mean a price rally will come soon, or at all.
Like and subscribe and comment my ideas if you enjoy them!

CHF/JPY SELLERS WILL DOMINATE THE MARKET|SHORT
Hello, Friends!
We are going short on the CHF/JPY with the target of 184.981 level, because the pair is overbought and will soon hit the resistance line above. We deduced the overbought condition from the price being near to the upper BB band. However, we should use low risk here because the 1W TF is green and gives us a counter-signal.
Disclosure: I am part of Trade Nation's Influencer program and receive a monthly fee for using their TradingView charts in my analysis.
✅LIKE AND COMMENT MY IDEAS✅

XHB - Housing Is In Real Trouble - My Short explained🏠 Some Facts & Fundamentals first 🏠
The Fed has made its first rate cut in 2025, and more are expected if inflation remains under control. That could put downward pressure on long-term mortgage rates, which may give the market a little boost.
Builders (like Lennar) are 🏚️ facing profit pressure 🏚️ due to affordability and are offering incentives (rate buydowns, other discounts) to spur demand.
📈 Now to the technicals 📉
Price went up to the Centerline. The 80% rule played out like textbook.
Then it closed above the Centerline, and failed to move further up to the U-MLH, which is a loud 🚨 warning sign 🚨.
And finally, we have a confirmed "Hagopian", when we close below the Centerline this Week.
To me it's all perfect in line - I mean, the TA & Fundamentals.
My plan is, to play XHB short with LEAP Options (182 Days) and take profit on the way down, which is at the Centerline, 1/4 Line and the L-MLH.
Of cours I would bail out or hedge, if price open & close again above the Centerline on the weekly time frame Chart.
⚠️ Stay updated ⚠️
I will start something new in one or two weeks, so you better don't miss it and follow! §8-)
❤️ THANK YOU ALL ❤️
...for the Boosts and Follow from this week. Your feedback is what makes it worth to post!
I wish you all a relaxing and happy weekend §8-)

Bitcoin Has Potential to Continue – Don’t Miss Out!Hello everyone, Ken here!
Let’s dive deeper into the current price action of Bitcoin.
As you can see, price is moving within a clear upward channel, signaling strong bullish momentum. After a sharp rise, the price has slightly pulled back to retest the broken resistance. This is a classic break and retest setup within a larger channel, a popular trading pattern I often use.
The key point here is that if this level holds as support, buyer confidence will be further solidified. And we’re already seeing that happen!
With this momentum, I believe 118,850 USDT is the next target, where the price could reverse depending on market reactions at that point.
Wishing you successful trades and a disciplined strategy!

EURCAD A Fall Expected! SELL!
My dear friends,
Please, find my technical outlook for EURCAD below:
The instrument tests an important psychological level 1.6289
Bias - Bearish
Technical Indicators: Supper Trend gives a precise Bearish signal, while Pivot Point HL predicts price changes and potential reversals in the market.
Target - 1.6257
About Used Indicators:
Super-trend indicator is more useful in trending markets where there are clear uptrends and downtrends in price.
Disclosure: I am part of Trade Nation's Influencer program and receive a monthly fee for using their TradingView charts in my analysis.
———————————
WISH YOU ALL LUCK

USDJPY Under Pressure! SELL!
My dear friends,
My technical analysis for USDJPY is below:
The market is trading on 147.95 pivot level.
Bias - Bearish
Technical Indicators: Both Super Trend & Pivot HL indicate a highly probable USDJPY continuation.
Target - 147.30
About Used Indicators:
A pivot point is a technical analysis indicator, or calculations, used to determine the overall trend of the market over different time frames.
Disclosure: I am part of Trade Nation's Influencer program and receive a monthly fee for using their TradingView charts in my analysis.
———————————
WISH YOU ALL LUCK

HBARUSDT: Ready for the Next Bull Run to 0.27430!The HBARUSDT market is looking incredibly bullish! We've just seen a strong shift from a downtrend to an uptrend, creating a perfect opportunity to go long.
The price has broken through a key resistance level, then pulled back to retest it – a textbook breakout & retest setup. This highlights the strength of the bullish momentum.
Now, with the price rejecting that level and turning it into new support, this is a strong long signal with the next target in sight!
My target is 0.27430. Let’s get ready for the next move!

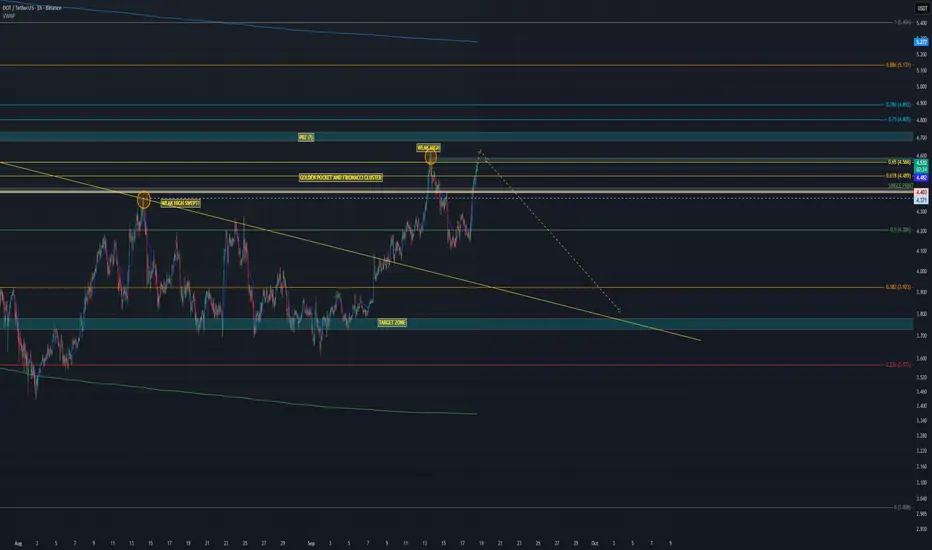
WHAT GOES UP, MUST COME DOWN – $DOT DUMP TIME?In my last analysis we nailed the move: CRYPTOCAP:DOT pumped to sweep the weak 14 Aug high exactly as projected. ✅ That mission is complete – now it’s time for the other side of the trade.
Analysis
14 Aug high swept → equilibrium reached.
Price in HTF Golden Pocket + strong Fib cluster.
Bearish harmonic + hidden bear div on CVD.
Orderflow: longs piling in, OI ↑ but price stuck → squeeze risk.
Likely SFP around $4.65 (take out Sept 13 high) → then dump.
First target: $3.75.
GOLD BEARISH BIAS RIGHT NOW| SHORT
GOLD SIGNAL
Trade Direction: short
Entry Level: 3,653.06
Target Level: 3,487.88
Stop Loss: 3,762.88
RISK PROFILE
Risk level: medium
Suggested risk: 1%
Timeframe: 1D
Disclosure: I am part of Trade Nation's Influencer program and receive a monthly fee for using their TradingView charts in my analysis.
✅LIKE AND COMMENT MY IDEAS✅

CAD/JPY BEARS ARE STRONG HERE|SHORT
Hello, Friends!
CAD/JPY is making a bullish rebound on the 12H TF and is nearing the resistance line above while we are generally bearish biased on the pair due to our previous 1W candle analysis, thus making a trend-following short a good option for us with the target being the 106.590 level.
Disclosure: I am part of Trade Nation's Influencer program and receive a monthly fee for using their TradingView charts in my analysis.
✅LIKE AND COMMENT MY IDEAS✅

AUD/JPY SHORT FROM RESISTANCE
Hello, Friends!
The BB upper band is nearby so AUD-JPY is in the overbought territory. Thus, despite the uptrend on the 1W timeframe I think that we will see a bearish reaction from the resistance line above and a move down towards the target at around 96.239.
Disclosure: I am part of Trade Nation's Influencer program and receive a monthly fee for using their TradingView charts in my analysis.
✅LIKE AND COMMENT MY IDEAS✅


EURGBP: Short Trade with Entry/SL/TP
EURGBP
- Classic bearish pattern
- Our team expects retracement
SUGGESTED TRADE:
Swing Trade
Sell EURGBP
Entry - 0.8697
Stop - 0.8704
Take - 0.8681
Our Risk - 1%
Start protection of your profits from lower levels
Disclosure: I am part of Trade Nation's Influencer program and receive a monthly fee for using their TradingView charts in my analysis.
❤️ Please, support our work with like & comment! ❤️

BTC End of Q3 Setup Now that FOMC is over and the FED finally cut interest rates by 25bps, what does this mean for BTC in the short term future and beyond?
It has been known for a while that the September FOMC would bring a cut to interest rates and that is what we got, generally this was priced into the market and despite some low time frame volatility not much has changed in terms of % move in the last day.
However, the macro does look bullish from here. Flipping $117,500 opens up the possibility of a range high test. For me this is the direction I'm leaning towards given the macro and how seasonality suggests a stronger end to the year especially after a rate cut.
Should BTC fail to break above the grey box BTC stays within the same constraints it's had for the last month.
