Bitcoin in a 4H Range: Critical Levels and Trade Scenarios Ahead👋🏻 Hey everyone! Hope you’re doing great! Welcome to SatoshiFrame channel.
✨ Today we’re diving into the 1-Day Bitcoin Dominance analysis. Stay tuned and follow along!
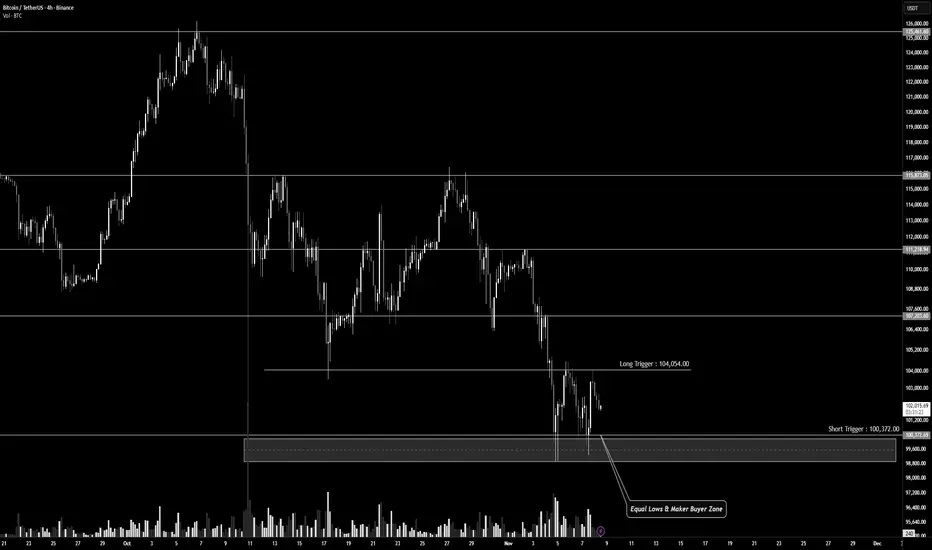
🪙 On the 4-hour timeframe, Bitcoin is currently moving within a clear trading range.
The highs and lows in lower timeframes are nearly equal, providing solid trigger zones for potential trades.
The range resistance is around $104,054, while the range support lies near $100,372, which can be considered a micro buyer zone.
💰 During Bitcoin’s first upward move, the volume increased, indicating an attempt to shift momentum bullishly.
However, after forming a lower high, buyers experienced FOMO but failed to push the price further up.
A pullback then occurred toward the support zone at $100,372, where another equal low was formed.
As price moved upward again, buying volume decreased, showing weakening buyer strength, and the move concluded with a blow-off 4H candle near the previous top.
✍️ Below are the potential trading scenarios for Bitcoin.
Review them and align with your own strategy and risk management before taking positions.
↗️ Long Position Scenario
A breakout above the resistance zone (the 4H trend-change area) around $104,054, followed by the formation of a higher low on that level, could provide a solid long setup.
Ensure this move is confirmed by increasing volume and buying pressure convergence for a higher win rate.
📉 Short Position Scenario
A breakdown below the support zone (two equal lows and a key weekly/daily support) around $100,372, combined with the formation of a lower high below that zone and strong selling pressure, could offer a short opportunity.
Watch out for large whale candles — it’s best to wait for confirmation before entering.
❤️ Disclaimer : This analysis is purely based on my personal opinion and I only trade if the stated triggers are activated .
Shortsetup
Bitcoin Bearish Setup Toward 100K TargetBitcoin is trading below a descending trend line, facing resistance near 102,000. Price is testing the support zone around 101,000, with a bearish target set at 100,000 if the support breaks.

USD/JPY consolidates due to BoJ rate hike uncertaintyThe USD/JPY pair moved within a narrow range on Friday. The Japanese Yen (JPY) consolidated the previous day's sharp gains, while the US Dollar (USD) managed to gain slightly. The overall movement was limited by conflicting fundamental and political signals in both countries.
## Mixed Signals for the Japanese Yen (JPY)
- Weakness (Delaying Interest Rate Hike): Disappointing Japanese Household Spending data fueled speculation that the Bank of Japan (BoJ) could delay its next interest rate hike.
- Strength (Limiting Declines): However, the minutes of the BoJ's September meeting released last Wednesday maintained expectations for an imminent interest rate hike.
## Risks: USD gains were limited by two concerns:
- Economic risks stemming from the prolonged US government shutdown.
- Market speculation of further interest rate cuts by the Federal Reserve (The Fed).
## Downside Scenario (Bearish)
- Selling Trigger: An overnight break below resistance-turned-support at 153.30-153.25 favors further depreciation.
- Initial Key Support: Further declines are likely to find decent support near the 152.15-152.10 region (although the daily oscillator remains positive).
- Bias Reversal: Continued selling below the 152.00 mark will provide a fresh trigger for bearish traders and extend the decline from the February high.
## Bullish Scenario
- Initial Hurdle: A recovery above the 153.30-153.25 horizontal resistance will face resistance near the 153.65 area.
- Pivot Point: Sustained strength beyond the latter will allow USD/JPY to reclaim the 154.00 mark and retest the 154.45 supply zone. This level should act as a key pivot point.
- Further Targets: A break above 154.45 could lift the spot price to the psychological level of 155.00, and continue to 155.60 - 155.65 and the round number of 156.00.

Gold price under 4000 at the end of the week⭐️GOLDEN INFORMATION:
Gold (XAU/USD) gains fresh buying interest near the $4,000 psychological level during Friday’s Asian session, rebounding from Thursday’s late pullback. Renewed concerns over the prolonged US government shutdown and uncertainty surrounding President Donald Trump’s tariff policies weigh on risk sentiment, fueling safe-haven demand for gold.
Additionally, a private-sector survey on Thursday revealed job losses in October, reinforcing expectations of further Federal Reserve (Fed) rate cuts and lending support to the non-yielding metal. However, mild US Dollar (USD) buying could cap gains. Overall, the broader fundamentals continue to favor bullish momentum in XAU/USD.
⭐️Personal comments NOVA:
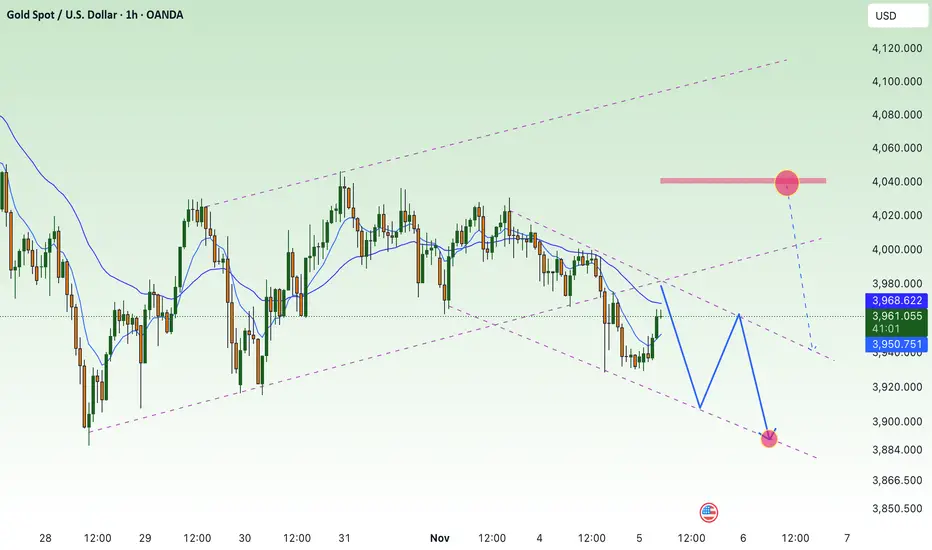
Accumulation and sideways is the main trend of gold at the moment, continuing to trade below 4000
⭐️SET UP GOLD PRICE:
🔥SELL GOLD zone: 4028 - 4030 SL 4035
TP1: $4012
TP2: $4000
TP3: $3985
🔥BUY GOLD zone: 3949 - 3947 SL 3942
TP1: $3960
TP2: $3970
TP3: $3990
⭐️Technical analysis:
Based on technical indicators EMA 34, EMA89 and support resistance areas to set up a reasonable sell order.
⭐️NOTE:
Note: Nova wishes traders to manage their capital well
- take the number of lots that match your capital
- Takeprofit equal to 4-6% of capital account
- Stoplose equal to 2-3% of capital account

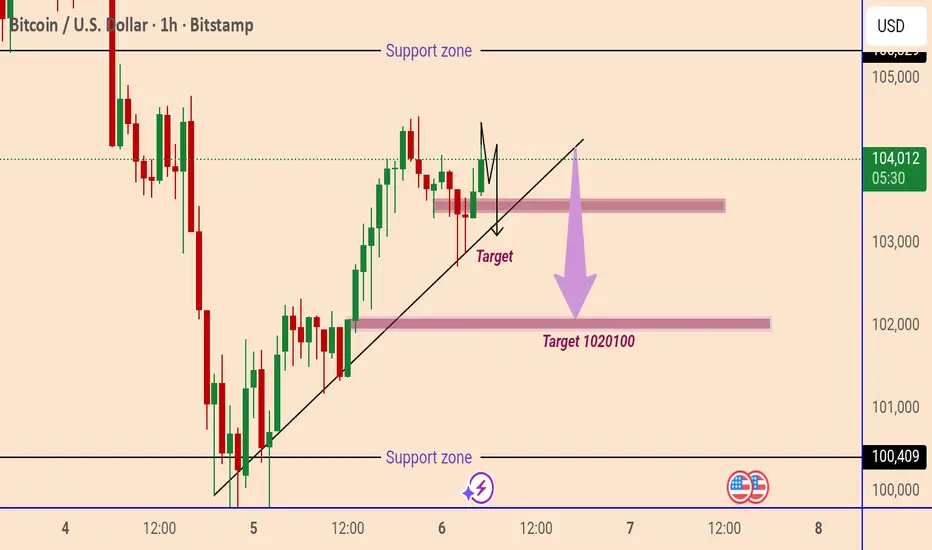
Bitcoin Trendline Breakdown SetupBitcoin (BTC/USD) is trading around $104,010, showing a mild bullish correction. However, the chart suggests a potential downward move if price breaks below the trendline support. The next targets are around $103,000 and $102,000–$102,100, with a major support zone near $100,400.
AMC SHORT SETUPThere is a strong support at $2.50—.
Stochastic is deeply oversold so I expect a bounce at the support.
The entry for the short I'm looking at is the box between $2.67 and $2.94, which lines up with the downtrend and the fibonnaci levels.
I like to keep the setups simple and low leverage.
Let me know what you think.

DXY recovers - gold price under selling pressure below 4000⭐️GOLDEN INFORMATION:
Gold (XAU/USD) slips toward $3,970 during Thursday’s Asian session as investors reassess the Federal Reserve’s (Fed) policy outlook following stronger-than-expected US economic data. Several Fed officials — including Michael Barr, John Williams, Anna Paulson, Beth Hammack, Christopher Waller, and Alberto Musalem — are set to speak later in the day.
Data from ADP on Wednesday showed US private-sector employment rose by 42,000 in October, rebounding from September’s revised 29,000 decline, suggesting signs of stabilization in the labor market after two months of weakness.
⭐️Personal comments NOVA:
Gold price continues to accumulate below 4000, DXY recovers when efforts are made for the US government to operate. Gold continues to lack current upward momentum.
⭐️SET UP GOLD PRICE:
🔥SELL GOLD zone: 4087 - 4089 SL 4094
TP1: $4070
TP2: $4050
TP3: $4030
🔥BUY GOLD zone: 3948 - 3946 SL 3941
TP1: $3960
TP2: $3970
TP3: $3990
⭐️Technical analysis:
Based on technical indicators EMA 34, EMA89 and support resistance areas to set up a reasonable sell order.
⭐️NOTE:
Note: Nova wishes traders to manage their capital well
- take the number of lots that match your capital
- Takeprofit equal to 4-6% of capital account
- Stoplose equal to 2-3% of capital account

BTC continues to correct below 100k🟠 BTCUSD Technical Plan
Current Price: 101,960
Overview: BTC continues to follow a downtrend structure, with each lower high being rejected from the descending trendline (marked with red arrows). The market recently broke below key Fibonacci support and is now trading around the 1.0 extension level near 100,950.
📉 Short-term Expectation:
Price may retest the broken support zone around 104,700 – 105,800 (Fib 0.5–0.618 + EMA zone).
This area is expected to act as strong resistance where sellers may re-enter the market.
If the rejection is confirmed, BTC could continue dropping toward the 95,200 – 94,700 support zone (1.618 extension).
📈 Alternative Scenario (Bullish Correction): If price breaks above 105,800, a short-term correction could extend toward the trendline resistance near 111,400 before another potential reversal.

Selling pressure below 4000, signs of a breakout⭐️GOLDEN INFORMATION:
Gold (XAU/USD) rises above $3,950 during Wednesday’s Asian session as persistent US government shutdown concerns and geopolitical tensions fuel safe-haven demand. The stalemate between Democrats and Republicans has stretched into a new month, putting the US on track for its longest-ever shutdown.
However, gains may be capped as traders take profits amid a stronger US Dollar (USD) and waning expectations for additional Federal Reserve (Fed) rate cuts this year. A firmer dollar typically makes gold costlier for overseas buyers, limiting its appeal.
⭐️Personal comments NOVA:
Gold price under selling pressure below 4000, downtrend after breaking trendline
⭐️SET UP GOLD PRICE:
🔥SELL GOLD zone: 4040 - 4042 SL 4047
TP1: $4030
TP2: $4015
TP3: $4000
🔥BUY GOLD zone: 3888 - 3886 SL 3881
TP1: $3900
TP2: $3915
TP3: $3930
⭐️Technical analysis:
Based on technical indicators EMA 34, EMA89 and support resistance areas to set up a reasonable sell order.
⭐️NOTE:
Note: Nova wishes traders to manage their capital well
- take the number of lots that match your capital
- Takeprofit equal to 4-6% of capital account
- Stoplose equal to 2-3% of capital account
$ Up - Emerging Markets Down?As you can see, there is a huge relationship between the DXY and EMM that most people do not understand.
I won't go into the macroeconomics of it all since most are just traders. All you need to know is that they work in opposite directions. Strong $ bad for merging markets and vice versa.
As you can see, the $ has popped off of support while EMM is still in a very tight, tight channel that usually collapses out of this structure.
Needless to say EEM price does not like to be above $50.
Simultaneously, EMM is hitting a key area at 17-year highs. This presents us with a wonderful risk-reward trade for a short with a well-defined stop-out.
This opportunity has only presented itself just 2 times before in 17 years!
Given the global sell-off going on at the moment, there is a very high probability this short pays off. Remember, fear causes money to run to the $, so the bounce we see in the current environment is pretty solid.
Conversely, should it fail and EEM pops while the $ breaks down from support, then you have an excellent long setup
You could ride for a while.
Remember, I am a macro investor. I don't do 2% moves and get scared out or take profits. My definition of success are big moves over time.
Click boost, like, and subscribe! Let's get to 5,000 followers! ))

DTM Investment 1D Conservative CounterTrend TradeConservative CounterTrend Trade
+ short impulse
- unvolumed T2 level
+ resistance level
+ 1/2 correction
+ weak approach?
+ biggest volume 2Ut-
- interaction bar bigger volume
Calculated affordable virtual stop loss
1 to 2 R/R take profit
Bough put
Monthly CounterTrend
"- long impulse
- unvolumed T1
+ resistance level
+ biggest volume 2Ut-
+ more volume on reaction bar"
Yearly CounterTrend
"- long impulse
- neutral zone 2
- continuation if the trend
+ exhaustion volume?"

IREN 5M Short Conservative Trend DayTradeConservative Trend Trade
+ short impulse
+ unvolumed T2
+ resistance zone
- before 1/2 correction
+ strong approach
+ volumed 2Ut+
+ weak test
+ first bullish bar close entry
Calculated affordable virtual stop loss
1 to 2 R/R take profit within 5M range
Bought put
1D Trend
"- short balance
+ volumed T2
+ resistance zone
+ 1/2 correction
- strong approach
+ biggest volume 2Ut-"
1M CounterTrend
"- long impulse
+ volumed T1
+ resistance zone
+ weak approach
+ biggest volume Ut
+ test"
1Y CounterTrend
"- long impulse
= neutral zone
+ exhaustion volume?"

GBPAUD A perfect Bearish Flag A bearish flag is a technical analysis pattern in trading that indicates a potential continuation of a downtrend. It's characterized by:
Key Features1. Downtrend: A prior downward trend in price.
2. Flag formation: A consolidation period with a slight upward trend, forming a flag shape.
3. Volume: Typically, volume decreases during the flag formation.
Interpretation1. Bearish signal: The bearish flag suggests the downtrend is likely to continue.
2. Breakout: A break below the flag's support level can confirm the continuation of the downtrend.
Trading Strategies1. Short selling: Traders may consider short selling after a break below the flag's support level.
2. Stop-loss: Setting a stop-loss above the flag's resistance level can help limit losses.
Important Notes1. Confirmation: Wait for confirmation of the breakout before entering a trade.
2. Risk management: Always use proper risk management techniques.
⚠️ Disclaimer:
This setup is shared for educational purposes only. It is not financial advice. Always do your own analysis and apply proper risk management before trading any setup.

NRG 1H Swing Short Conservative CounterTrend TradeConservative CounterTrend Trade
+ short impulse
+ resisting bar level
+ 1/2 correction
+ resistance zone
+ volume Ut?
Bought put
Calculated affordable virtual stop
1 to 2 R/R take profit before 1/2 1D
Daily CounterTrend
"- long impulse
+ volumed T1
+ resistance zone
- strong approach
+ volumed 2Ut+"
Monthly CounterTrend
"- long impulse
- unvolumed T1
+ resistance zone
+ volumed manipulation bar
- volumed reaction bar looks for break
- volume distribution is long"
Yearly CounterTrend
"- long impulse
= neutral zone"

DIA 1H Swing Short Conservative CounterTrend TradeConservative CounterTrend Trade
+ short impulse
- resisting bar level below BUI
+ resistance zone
+ 1/2 correction
+ volumed 2Ut-
Bought a put
1 to 2 R/R take profit
1D CounterTrend
"- short balance
+ biggest volume expanding CREEK
+ volumed 2Ut+
+ weak test"
1M CounterTrend
"- long impulse
- neutral zone
+ exhaustion volume?"
1Y CounterTrend
"- long impulse
+ beyond rotation point
- neutral zone"

GBPUSD within Bearish StructureHi Traders!
With price failing to swing higher I'm still seeing it's within bearish structure. The 1.35000 area looks like a strong resistance/supply zone. If price fails to break and close above it, that reinforces my bearish bias.
As of now, the current bounce looks corrective- possibly a retracement toward the 1.3500 zone before sellers step in again.
If price rejects near 1.35000 and continues to break below, then the next level I'd be considering would be 1.30000.
In addition, DXY is sitting at a higher low zone on a higher TF. It hasn't broken its longer-term uptrend yet. The price action looks like it's attempting a base/reversal. If it holds within 98.000-98.500 and starts pushing up, that could align with GBPUSD weakness.
*DISCLAIMER: I am not a financial advisor. The ideas and trades I take on my page are for educational and entertainment purposes only. I'm just showing you guys how I trade. Remember, trading of any kind involves risk. Your investments are solely your responsibility and not mine.*

Gold is sideways and waiting for a breakout⭐️GOLDEN INFORMATION:
Gold (XAU/USD) slips toward $4,000 in early Asian trading on Tuesday as investors scale back expectations for additional Federal Reserve (Fed) rate cuts. Markets now await comments from Fed Governor Michelle Bowman later in the day.
Last week, the Fed delivered its second rate cut of the year, lowering the benchmark range to 3.75%–4.00%. However, Chair Jerome Powell’s remark that another cut is “not a foregone conclusion” reinforced a hawkish tone, pressuring the non-yielding metal.
⭐️Personal comments NOVA:
Gold price is still maintaining the accumulation price range, not clearly determining a certain trend. Waiting for a breakout.
⭐️SET UP GOLD PRICE:
🔥SELL GOLD zone: 4089 - 4091 SL 4096
TP1: $4076
TP2: $4050
TP3: $4030
🔥BUY GOLD zone: 3922 - 3920 SL 3915
TP1: $3940
TP2: $3950
TP3: $3965
⭐️Technical analysis:
Based on technical indicators EMA 34, EMA89 and support resistance areas to set up a reasonable sell order.
⭐️NOTE:
Note: Nova wishes traders to manage their capital well
- take the number of lots that match your capital
- Takeprofit equal to 4-6% of capital account
- Stoplose equal to 2-3% of capital account

Daily Analysis Bias: Bearish continuation Key Level to Watch: 3After a corrective bounce, price remains capped below 4024 resistance.
A decisive daily close under 3976.03 would confirm momentum resuming to the downside, opening the door toward the 3930 support zone and possibly extending toward 3880 if sellers maintain pressure.
Technical Context
• Trend: Downtrend remains intact (lower highs and lower lows)
• Resistance zone: 4024 – 4040
• Support zones: 3976 → 3930
• Structure: Descending channel with recent failed breakout attempt
Trading Plan:
Watch for a retest of 3976 after a break to confirm as resistance before continuation down.
A daily close back above 4024 would invalidate the bearish setup short term.

Scalp Short – TON💎 Scalp Short – TON
RSI is weakening and entering the overbought zone, while price has broken below key support, signaling potential downside continuation.
🎯 Plan:
→ Enter after confirmation of breakdown retest.
→ TP: 2.148 | SL: 2.36 | RR: 1 : 2.85
Momentum favors the short side.
Keep entries precise, trail SL as price moves lower.
Stay disciplined — execute only after clear confirmation.

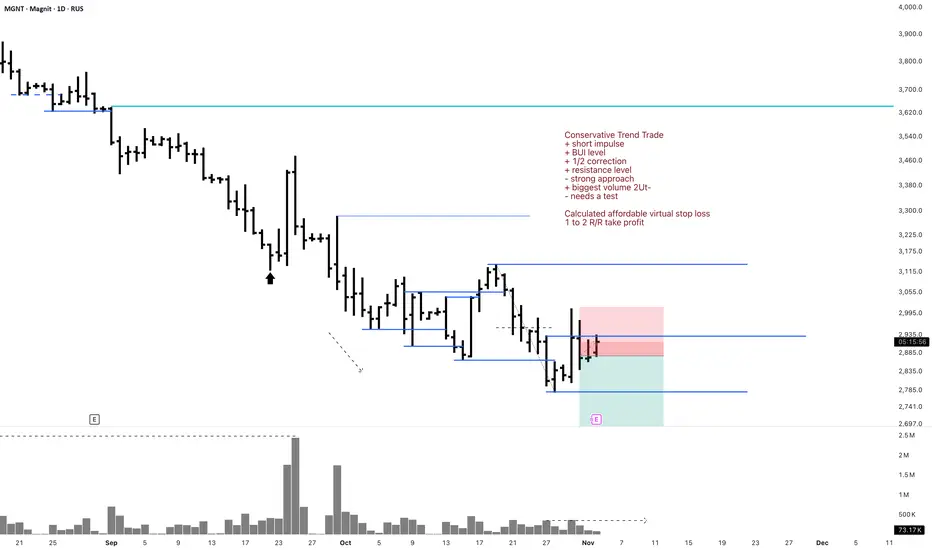
MGNT Conservative Trend TradeConservative Trend Trade
+ short impulse
+ BUI level
+ 1/2 correction
+ resistance level
- strong approach
+ biggest volume 2Ut-
- needs a test
Calculated affordable virtual stop loss
1 to 2 R/R take profit
Daily Trend
"+ short impulse
+ BUI level
+ 1/2 correction
+ resistance level
- strong approach
+ biggest volume 2Ut-
- needs a test"
Monthly Trend
"+ short impulse
= neutral zone type 2
+ continuation of the trend"
Yearly CounterTrend
"- long impulse
- T2 level
- support zone
- 1/2 correction
- biggest volume Sp?
+ long setup
+ model doesn't work"
Scalp Short – JELLY JELLY💎 Scalp Short – JELLY JELLY
RSI is heavily overbought, confirmed across the 1H timeframe, signaling exhaustion of bullish momentum.
Price is facing a strong resistance zone, where prior rejection occurred — suggesting a high-probability pullback.
🎯 Plan:
→ Enter on confirmation of rejection at resistance.
→ TP: 0.06294 | SL: 0.12658 | RR: 1 : 3.93
Momentum favors sellers.
Ride the retracement with discipline — secure profits as price approaches target.

Scalp Short – IDOL💎 Scalp Short – IDOL
RSI is overbought and showing a bearish divergence on the 5m timeframe.
The 15m chart is also overbought, suggesting an imminent correction as buying momentum weakens.
🎯 Plan:
→ Enter after confirmation of rejection from the top zone.
→ TP: 0.3324 | SL: 0.3803 | RR: 1 : 4.7
Momentum favors the short side.
Keep entries precise, trail SL as price moves lower.
Stay patient — only act once the setup confirms clearly.

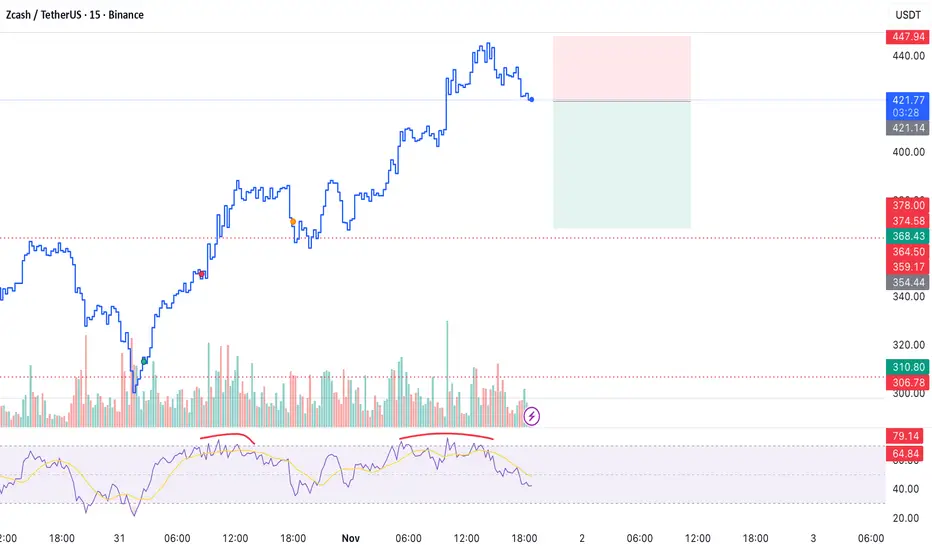
Scalp Short – ZEC💎 Scalp Short – ZEC
RSI has formed a double top and is now entering the selling zone on lower timeframes.
Selling volume is emerging, signaling growing bearish momentum.
🎯 Plan:
→ Enter after confirmation of rejection from resistance.
→ TP: 368.43 | SL: 447.94 | RR: 1 : 1.97
Momentum favors the short side.
Keep entries sharp, trail SL as price declines.
Stay disciplined — only execute once confirmation is clear.