PARTI 4H Analysis - Key Triggers Ahead❄️ Welcome to the cryptos winter , I hope you’ve started your day well.
⏰ We’re analyzing PARTI on the 4-Hour timeframe.
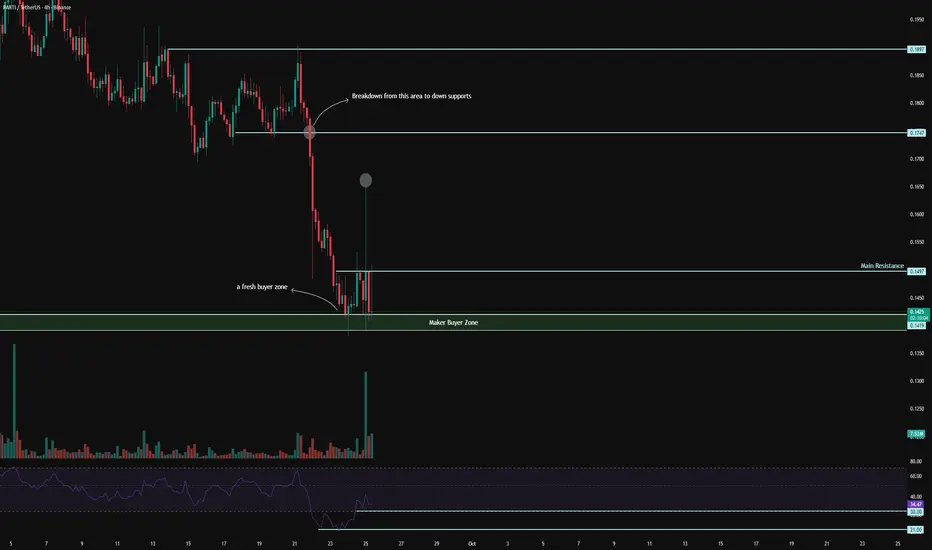
👀 On the 4-hour timeframe, Coin Party has flashed a strong sell signal after losing support at 0.1747, and is now moving toward its lower support zones. The overall trend on higher timeframes remains heavily bearish, with capital inflows steadily exiting the asset in a step-by-step manner.
Meanwhile, a relatively strong micro-buyer zone had formed, which initially pushed the price upward upon contact, but heavy selling pressure soon drove it back down. This level now represents the last defensive support for maintaining price stability. Losing it could trigger a move toward the coin’s key initial-offer support — or, at best, bring it close to that zone.
🧮 On 4-hour timeframe RSI OscillatorFrom a timing perspective, after losing the 0.1419 floor, the coin has been under intense selling pressure for 2 days. It is currently emerging from the oversold zone, sitting just below the 50 resistance level. Key areas remain at 30 and 21; a cross below 30 could generate a volatility-driven target near 21.
🕯 The size, volume, and frequency of red candles are increasing, reflecting heavy selling pressure. Sellers are actively acting as ticker sellers, absorbing any upward moves. Each price attempt away from support meets with stronger sell pressure.
🧠 For new entries, there is a strong possibility of whale-driven sell waves. Patience is key: we wait for the RSI to retest the 30 zone, and upon a confirmed breakdown of the current support floor, we can consider opening short positions.
❤️ Disclaimer : This analysis is purely based on my personal opinion and I only trade if the stated triggers are activated .
Shortsetup
BTC/USD – Critical Night Ahead; Set Your Stop-Loss!🚨 Warning to Traders 🚨
Bitcoin has completed its pullback within the long-term ascending channel and is now testing the heavy resistance zone at 120K–124K. Tonight could be one of the most critical nights for the market. If negative news hits, we may witness a bloody drop of 18–19%, pushing price action down toward 93K.
🔻 Key Levels
Major Resistance: 120K–124K
Support 1: 109K–105K
Support 2: 101K–97K
Critical Demand: 93K
Deep Liquidity: 80K–74K
📉 Likely Scenario
A breakdown below 109K could trigger a multi-leg decline: first targeting 101K–97K, then extending toward 93K. With increased fear, even the 80K–74K liquidity zone could come into play.
⚠️ Revolutionary Advice
Always set your stop-loss
Protect your capital
Tonight could define the next major Bitcoin trend
💡 Save your money – the market never jokes!

Booom as expected and expecting more drop On Gold in my last post i mentioned it will be drop which was expected and still expecting more drop as shwon in chart ... good like 👍 and support

DAX (GER40) - Great Short opportunityNasdaq down (see other idea) Dax playing Games. Was moving in a formation and did some fake breakout to the top today. Now sold back and heading south. I'm exepcting a drop to our previous defined targets.
Short at current position 23680
T1: 23487
T2: 23053
No trading advise.


BTC continues selling pressure, correctionBTC Analysis
1. Trend Structure:
BTC has broken down from its ascending channel after failing to hold above the 115,000 zone, signaling that bearish momentum is in control.
2. Key Resistance Levels:
• 113,925 and 116,132 remain strong resistance zones where sellers are likely to defend.
• Price action is currently trading below major moving averages, further supporting the bearish outlook.
3. Support & Downside Targets:
• Immediate support lies at 111,722 (Fibo 1.618).
• If selling continues, the next downside levels are 108,937 and 106,298.
4. Expectation:
A short-term bounce toward 113,900 – 114,000 is possible, but the broader structure favors further downside, with likely moves toward 109,000 – 106,000.
⸻
✅ Conclusion:
BTC remains in a bearish phase after the channel breakdown. Unless buyers reclaim 116,000+, selling pressure is expected to dominate.

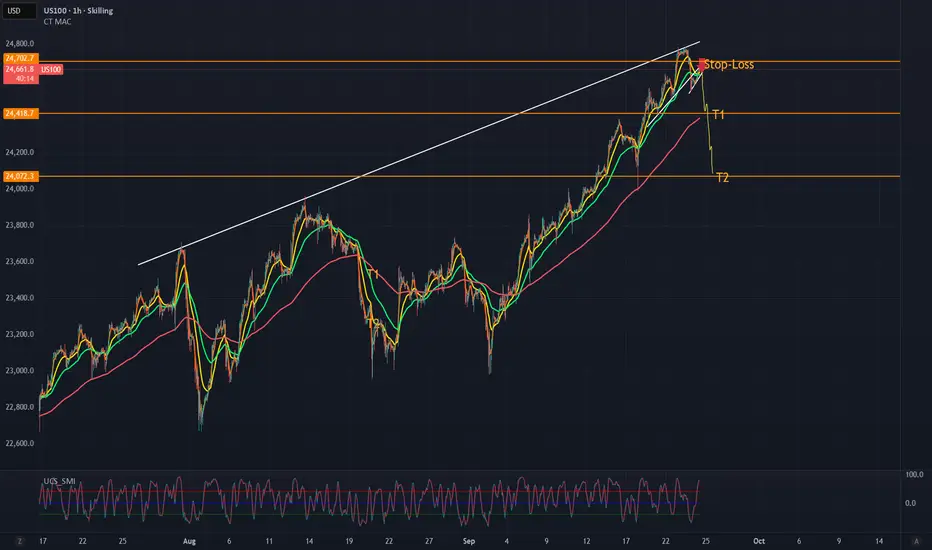
NASDAQ (US100) - ShortNasdaq (US100) currently trading at 24662.
We reached a high at 24767 and from there got a rejection. Multiple reasons here now for a continuation to the down side.
Entry: In rising channel at current levels.
Stop Loss: 24702
T1: 24418
T2: 24072
I'm expecting to see a break of this rising channel soon, may get some retest of the upper line till then which are great entry points.
No trading advise, just my opinion. Have fun.
GBPUSDTime frame 15min / 30 min Valid
Short Scalp Call
GBP USD still following bearish trend supoort break
Manage Risk / enjoy reward!
After TP1 book profits , put SL to Entry for TP 2

adjustment reduction, liquidity 3730⭐️GOLDEN INFORMATION:
Gold (XAU/USD) steadies near $3,760 in Wednesday’s Asian session after pulling back from a record $3,791. Expectations of further Fed rate cuts and safe-haven demand continue to underpin the metal. Fed Chair Jerome Powell noted the “challenging” balance between inflation risks and a weakening labor market, signaling readiness to ease policy further if needed. Markets now price in two additional 25 bps cuts this year, in October and December, which would lower the opportunity cost of holding non-yielding Gold.
⭐️Personal comments NOVA:
correction down, accumulation and continue to increase price towards 3800
⭐️SET UP GOLD PRICE:
🔥SELL GOLD zone: 3800- 3802 SL 3807
TP1: $3790
TP2: $3780
TP3: $3770
🔥BUY GOLD zone: $3730-$3728 SL $3723
TP1: $3740
TP2: $3750
TP3: $3760
⭐️Technical analysis:
Based on technical indicators EMA 34, EMA89 and support resistance areas to set up a reasonable SELL order.
⭐️NOTE:
Note: Nova wishes traders to manage their capital well
- take the number of lots that match your capital
- Takeprofit equal to 4-6% of capital account
- Stoplose equal to 2-3% of capital account

B Short 1H Aggressive CounterTrend TradeAggressive CounterTrend Trade
- long impulse
+ biggest volume T1
+ exhaustion volume
+ resistance level
+ biggest volume Ut
+ weak test
- below first bullish bar close entry
Calculated affordable virtual stop loss
1 to 2 R/R take profit
1D CounterTrend
"- long imluse
- neutral zone
- volume distribution long
+ exhaustion volume"
1M CounterTrend
"- long impulse
+ volumed interaction bar"
1Y countertrend
"- long impulse
+ volumed T1 level
+ resistance level"

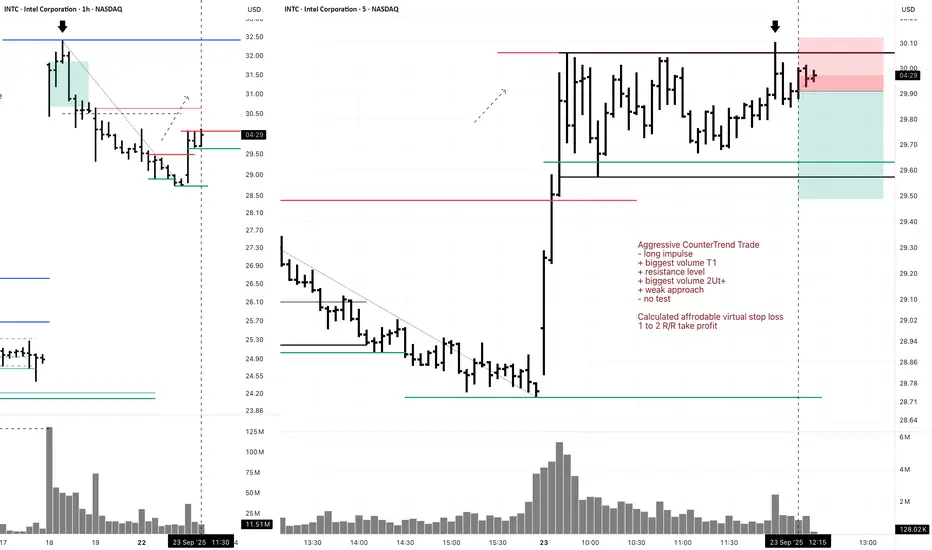
INTC Short 5M Aggressive CounterTrend Day TradeAggressive CounterTrend Trade
- long impulse
+ biggest volume T1
+ resistance level
+ biggest volume 2Ut+
+ weak approach
- no test
Calculated affordable virtual stop loss
1 to 2 R/R take profit
1H CounterTrend
"- long impulse
+ T1 level
+ resistance level
+ 1/2 correction?"
1D CounterTrend
";- long impulse
+ expanding CREEK / TE
+ exhaustion volume
- too high
+ correction to 1/2"
1M Trend
"+ short impulse
+ T2 level
+ resistance level
+ 1/2 correction"
1Y CounterTrend
"- long impulse
+ correction
- 1/2 of impulse
- biggest volume"
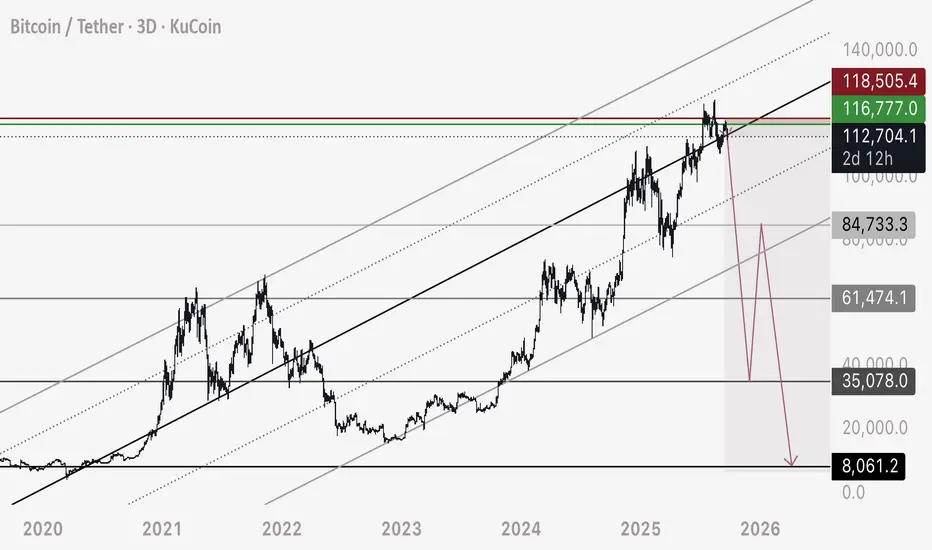
BTC - Short Initiated from Channel Breakdown Short Update going to plan.
Updated numbers and anticipated 3 wave corrective drop marked on chart.
113,000 to 35,000 (SHORT)
35,000 to 84,000-85,000 (LONG)
84,000 to 8,000 (SHORT)
For my personal trade I will be closing roughly 80% of short at 40,000-45,000
I will then look for a hold and rise from the 35,000 region to validate that we will see this corrective move. I believe there is a high probability of this - reasons I will detail more as the trade progresses. Chart would be too messy if I included all information on future confluences and pivot points.
If I see this rise occur, I will hold the 20% original short - and hedge with a long as well to 80,000 - 35,000 to 80,000
The reason the market is dropping is once again:
1. The significance of DXY breaking down a major multi month bearish channel
2. The fact that this is a bearish retest on BTC HTF - not a bull market or bull pattern
3. There is a mass amount of liquidity held in open longs in Bitcoin - we need to see a severe deleveraging of these low zones to remain bullish
Happy trading - please see related linked ideas.
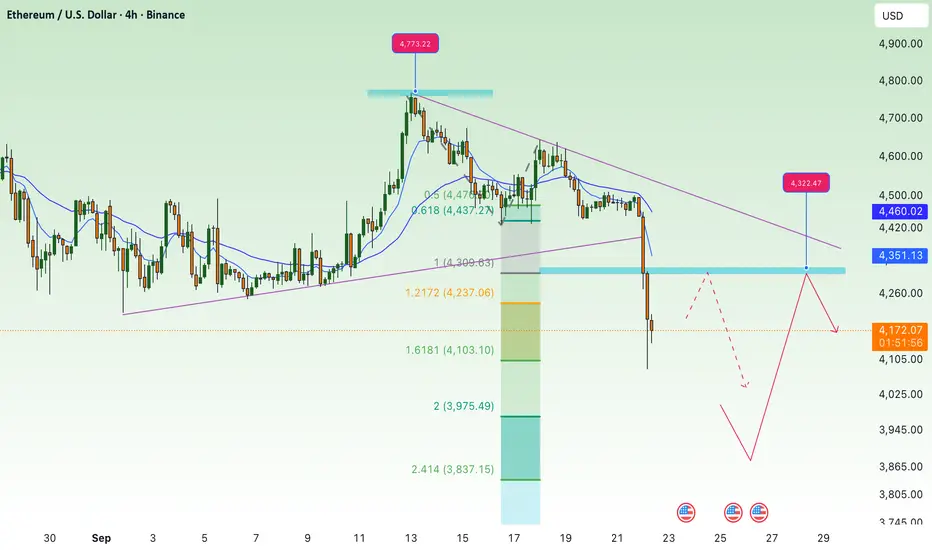
break support, continue to correct downETH 4H Chart Analysis
• Breakout Zone:
ETH has broken below the $4,360 – $4,330 zone (purple box), which previously served as strong support. This signals a shift in sentiment toward bearish momentum.
• Current Price Action:
After a sharp drop, ETH is consolidating around $4,170, hinting at a possible short-term rebound before continuing its downward structure.
• Resistance Levels:
• $4,360 – $4,330: Recently broken support, now acting as strong resistance.
• $4,505: Next resistance above, in line with prior range highs.
• Support Levels:
• $4,166: First Fib extension target, currently being tested.
• $3,880 – $3,900: Major support zone if price declines further (2.618 Fib extension + horizontal demand zone).
• Outlook:
ETH may retest the $4,330 – $4,360 resistance before continuing lower. If bearish pressure persists, the next downside target is around $3,880 – $3,900.
AUDUSD | Bearish Rejection from Order Block – Targeting Sell-SidHello Billionaires!!
In EURUSD D1 Projection we know the Price swept the Buy-Side Liquidity (BSL) and tapped into the Fair Value Gap (FVG) and Order Block (OB), showing signs of rejection. This aligns with Smart Money Concepts (SMC) for a potential bearish move.
🔹 Key Points:
Liquidity grab above recent highs (BSL).
FVG + OB acting as a rejection zone.
Price expected to target the Sell-Side Liquidity (SSL).
Balanced Price Range (BPR) around 0.6450 serves as a strong downside target.
Bearish bias remains valid as long as price stays below the OB/FVG zone.

XPO Short - Economy is WeakLooking for XPO to pull back significantly.
There is only so much demand a given economy can generate, over the course of a given cycle.
While we have been in a recession (in earnest) since early 2023, the stock market is just now figuring out that demand is increasingly absent and inflation has been the primary driver of all price growth for about 3.5 years now.
I expect at least a 50% selloff, with the possibility that this market can go much much lower.
Moreover, while indexes continue to make new highs, the real economy is completely detached (hence the XPO chart).
Good luck and God bless!

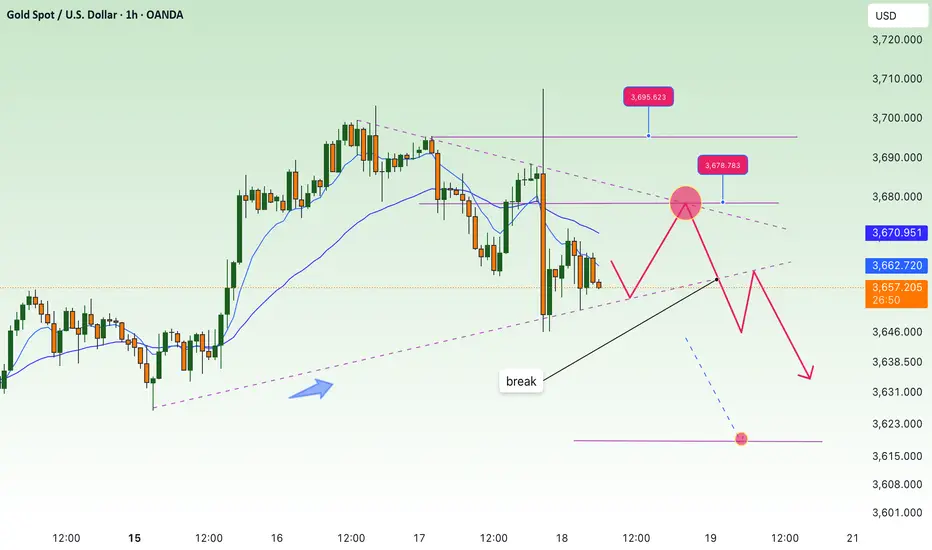
XAUUSD – Bearish Setup After Liquidity Grab at All-Time HighsAfter the recent rate cut and the sweep of liquidity above the $3,707 ATH , gold has started developing a bearish market structure . On the daily chart , RSI has been hovering in the overbought region for an extended period and has now confirmed a bearish crossover , signaling potential downside momentum.
Sellers have been stepping in aggressively since the top, and a corrective move looks increasingly likely.
🔹 Trade Plan
Short entries:
Aggressive: 3665 – 3673
Conservative (golden pocket): 3677 – 3684
Targets:
TP1: 3600
TP2: 3580
TP3: 3530
Stop Loss:
Above 3718.50 (protective buffer above liquidity zone).
⚠️ Risk Management
Always size positions carefully. A break and daily close above 3718 would invalidate this setup.

SUIUSDT.P SHORTSUIUSDT.P SHORT
The market has the potential for an downtrend to 200 MA
Price: 3.8 $
Main target 3.7441 $
SL 3.8919 $

Continued correction - gold price falls below 3600⭐️GOLDEN INFORMATION:
Gold (XAU/USD) slips for a second day, trading near $3,640 in Friday’s Asian session after profit-taking from record highs and a stronger US Dollar (USD). The pullback follows the Fed’s first rate cut of the year, a 25 bps move that lowered the target range to 4.0%–4.25% and signaled two more cuts ahead. Chair Jerome Powell described the decision as a “risk management cut” and downplayed urgency for further easing, a less dovish tone that supports the Greenback and weighs on bullion in the near term.
⭐️Personal comments NOVA:
Gold price continues to adjust, recovers briefly and returns to the 3600 price zone
⭐️SET UP GOLD PRICE:
🔥SELL GOLD zone: 3704- 3706 SL 3711
TP1: $3690
TP2: $3680
TP3: $3665
🔥BUY GOLD zone: $3596-$3598 SL $3591
TP1: $3608
TP2: $3620
TP3: $3630
⭐️Technical analysis:
Based on technical indicators EMA 34, EMA89 and support resistance areas to set up a reasonable SELL order.
⭐️NOTE:
Note: Nova wishes traders to manage their capital well
- take the number of lots that match your capital
- Takeprofit equal to 4-6% of capital account
- Stoplose equal to 2-3% of capital account

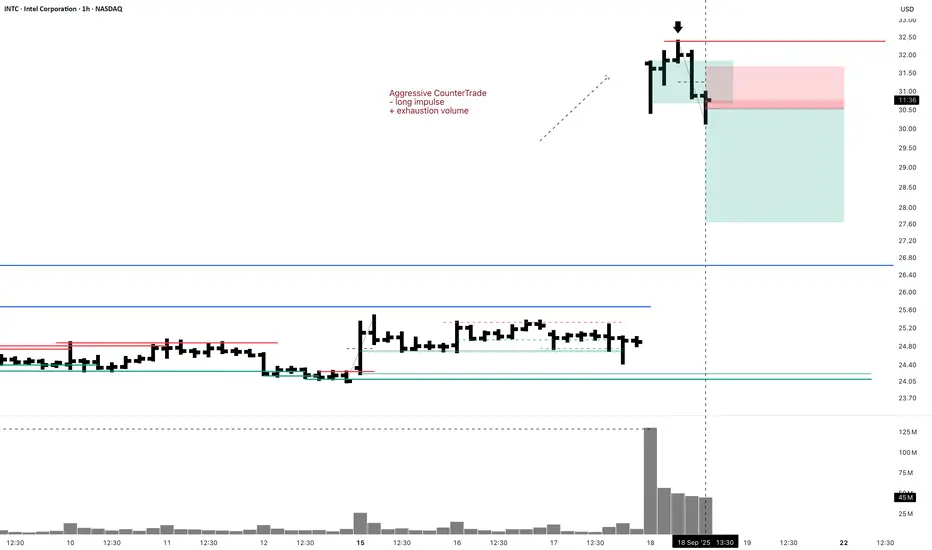
INTC Short Swing 1H Aggressive CounterTradeAggressive CounterTrade
- long impulse
+ exhaustion volume
Daily CounterTrend
"- long impulse
+ expanding CREEK level
+ exhaustion volume
+ too high"
Monthly Trend
"+ short impulse
+ T2 level
+ resistance level
+ 1/2 correction"
Yearly Trend
"- long impulse
+ correction
- 1/2 of impulse
- biggest volume"
USDCHF: Looking for Shorts After Liquidity GrabMarket Context
Price swept liquidity above recent highs and quickly rejected, creating a strong bearish reaction candle. This signals potential exhaustion of the bullish pullback within the larger downtrend.
Key Technicals
Liquidity sweep above local highs
Break of structure (BOS) to the downside
Price now retracing back into a supply zone
Supply zone aligns with the 50–61.8% Fibonacci retracement
Previous daily low (PDL) sits as a clear downside target
Trade Plan
Wait for price to retrace into the marked 1H supply zone (green box)
Look for rejection or bearish confirmation candle
Short only if price reacts cleanly from the zone and holds below the BOS
Target: Previous daily low (PDL)
Invalidation: Clean close above the liquidity sweep high
Psychology Note
Stay patient, the best trades often form after the stop hunts. Emotional chasing after big red candles leads to losses. Think like a pro: react to your levels, not to fear of missing out.

XAUUSDXAUUSD Short Call/ Bearish Candel
From area Xau has rejected before let See how the analysis goes book partial profit SL to ENtry as per your risk n reward!

start to correct down, back to 3618⭐️GOLDEN INFORMATION:
Gold (XAU/USD) consolidates after retreating from record highs above $3,700, reached following the Fed’s dovish rate cut. The central bank signaled two more reductions this year, keeping bullion supported in Thursday’s Asian session. Heightened geopolitical risks from the Russia-Ukraine war and Middle East tensions further underpin safe-haven demand.
At his press conference, Fed Chair Jerome Powell framed the move as a “risk management cut” and downplayed urgency for aggressive easing. This helped the US Dollar (USD) extend its rebound from multi-year lows, capping gold’s upside. Still, the broader backdrop favors bulls, with any dips likely to attract fresh buying
⭐️Personal comments NOVA:
The market started to correct down after reaching ATH 3707, the interest rate reduction result was as expected. Pressure to close profits this week
⭐️SET UP GOLD PRICE:
🔥SELL GOLD zone: 3678- 3680 SL 3685
TP1: $3670
TP2: $3660
TP3: $3650
🔥BUY GOLD zone: $3618-$3620 SL $3613
TP1: $3630
TP2: $3640
TP3: $3655
⭐️Technical analysis:
Based on technical indicators EMA 34, EMA89 and support resistance areas to set up a reasonable SELL order.
⭐️NOTE:
Note: Nova wishes traders to manage their capital well
- take the number of lots that match your capital
- Takeprofit equal to 4-6% of capital account
- Stoplose equal to 2-3% of capital account
Gold — Fed Cut Fade: Overextended, Eyeing a ThrowbackGold — Fed Cut Fade: Overextended, Eyeing a Throwback 🎯
Gold ripped higher into the FOMC, but the 25 bp cut was fully priced in. Post-decision, we saw the classic whipsaw — down → up → slow fade into the close. With the dollar and real yields catching a bid, the metal looks due for digestion before the next leg.
Technicals (4h)
Overextended run: Vertical leg higher with no real basing.
Supply zone: Sellers showed up around 3.71–3.75k.
Volume magnet: Confluence of the broken trendline + HVN sits down at ~3.41k.
Thin profile: Gap between 3.52 → 3.41k leaves room for a fast move lower if momentum flips.
Trade Idea
Short bias: Fading the 3.71–3.74k zone or on breakdown acceptance below 3.69k.
Stop: Above 3.76k (invalidation).
Target: 3.41k (major HVN + retest zone).
Macro Context
The Fed’s move matches expectations. With positioning stretched and “buy the rumor / sell the news” in play, near-term risk is for a pullback. Medium term, the trend stays bullish if easing continues and real yields drift lower.
Not financial advice — just sharing the setup I’m watching.
#Gold #GC1 #Futures #ShortSetup #VolumeProfile #FOMC
