BTCUSD On BTC is massive consolidation between $28-30k . My next target after this ping-pong game is over $35k , then I see another drop.. take care
Shortterm

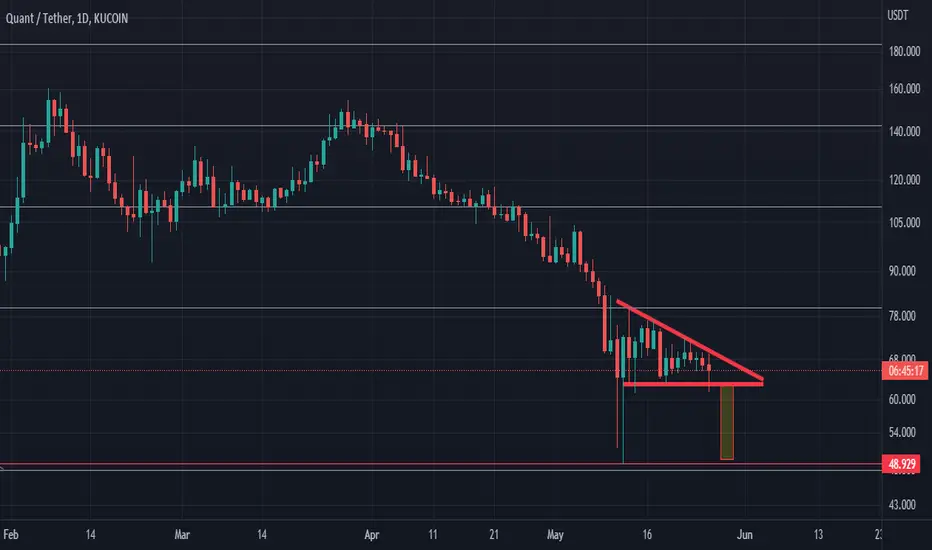
Quant descending triangle short term 2022We have a descending triangle that is a bearish pattern. If this plays out we could see QNT at $48-$49. It would make sense if QNT plays out on a drop in price thus respecting this descending triangle pattern and we drop to the previous low, this would give us a double bottom and a healthy position for a rebound.
AMD Break Out (Short Term)As we see AMD breaking out a major resistance within the rising wedge, we could expect it to keep rising and hitting resistance around the circled area on the resistance trend line of the rising wedge. On the RSI, it also shows AMD has been continuing on a uptrend channel thus showing it has already hit support and its ready to move upwards.

Possible Descending Widening Wedge SNDLSNDL has been, along with the Canadian cannabis sector, in a long downtrend since June 2021. If you exclude the 2 sharp jumps in prices, the pivot points have been making a Descending widening wedge. This reversal pattern, in addition to the company's recent acquisitions and diversification of assets, may lead to both a sharp jump in price in the short term and an overall reversal of trend in the next year or two. Additionally, the US, Canada's bordering country, has a bill that will be approaching the Senate floor for the decriminalization of cannabis on a Federal level. The news of a vote on said bill will most likely be a catalyst to an increase in price prior to the actual vote; leading to a jump in price. Sndl is currently in a curing stage to increase it's stock price to $1 for 10 days within the next few months. The company also has a stock buyback plan yet to be implemented.

Possible sell on GBPUSDConsidering weakness around current area of resistance, I will look to short the pound on the short term

AllianceBlock short term price action 2022where will ALBT be within the next couple of months? Will we move lower into the $0.06 price range or higher? Are we at the bottom with Bitcoin yet? I personally think we may have just one more dip to test the support we hit back on May 12th. If not, then we may have seen the bottom for BItcoin and AllianceBlock may move higher from here.

Short term APE entry and possible levelsThis is a very short term IDEA. As asia wkes up to a pure rout and realizes that there are no more macro news to be priced in this month. I believe we will see a very short lived rally. I stand by my prediction that over the course of the next couple of weeks APE will reach 1.03$. However for a quick scalp it is looking sweet to buy 7.70 and sell 9.50-10.05$.
High risk play given current market volatility. Maximum 1% cap trade.

Bitcoin will keep bleeding, alt season coming.Bearish flag.
Bitcoin dominance is falling.
Could this be the beginning of alt season?
bitcoin 70% drop TBA...

USDCAD#USDCAD on 1H time frame ready for a bearish wave
our suggested position for this area is a sell stop
⚜️Type: Sell Stop
🎚EP: 1.28121
✅TP1:1.27787
✅TP2:1.27302
✅TP3:1.26863
⛔️SL:1.28447
If you like this post or have any comments, leave a comment for me here and share it with your friends.


BTC : Short it Here is a simple short term trade i'm opening (all details in the chart).
Basically, we short now from about 30000-30300 and TP to 27k with a SL slightly above our entry.
Let's see how it goes
Comment your thoughts.

BTC Short Term Movement AnalysisAs you can see from the last Bitcoin analysis the 30000 area broke and the price went down with selling pressure and bounced from 25300$. with the price action analysis, Bitcoin is forming a symmetric triangle on lower time frames and we will see a break of this structure soon. The resistance is the $30,500-$31,000 area and we will see a move towards $33,000-$34,000 if BTC breaks above the $31,000 level. A break below $29,000 is bearish and we might see again $27,000-$27,500 levels. Use tight stop loss in all trades.
This analysis will be updated.
5/14/2022

MM False Bearish Breakout (SPY) Although I am titling this idea as "Long", this is more neutral than long, although it is geared towards Long.
As we can see, many stocks such as $FB are down nearly 50%. This includes $NFLX and many others. That being said, $SPY is only down about 17% , far less compared to many other major stocks (AMZN is > 40% down from its highs!).
One of two things are likely to happen.
1. $SPY possibly falls a little bit lower, and then rips up 6-12% points before it eventually makes a longer term dive, or
2. The more likely option: $SPY and other stocks find temporary bottoms soon (not necessarily today or tomorrow, although not impossible), and then starts a new trend which is either more continued consolidation, or the beginning or continuation of the old uptrend.
EITHER WAY, stocks are likely to find some sort of temporary "bottom", and then rip from there.
Again, consult the Fear and Greed Index: 20: Extremely Fearful.
www.cnn.com
Even if we are heading into a recession (as many around me and people in the news are pointing to), even in the 2008 housing crash, on the way down the overall market made 6% jumps, 10% jumps, some even up to 15% jumps. As technical analysts we must take advantage of these swings and use them to our advantage.
We Know that stocks such as $AMZN, $GOOG, $FB will likely do some sort of DCB, or retracement. When this occurs it will propel the overall market to rip up potentially bringing it into a new uptrend thus around now and the next few weeks could be a great buying opportunity for new investors... That is of course all relies on whether or not $SPY can hold above the trend lines I drew all the way back from August 2021. If price action cannot quickly shoot up above support, and continues to fall from there (potentially coming back up to go down again) then we are in for a not-so-fun ride.
Let me know what you all think in the comments below! This post was kind of rushed since I have been off of Trading View for two years getting more practical experience and knowledge of TA, and was itching to do another post since I forgot about this site. I plan on doing more posts here in the near future to get more feedback.
I am always learning, so please feel free to reach out to me and let me know personally what you think of my TA, or just write it in the comments!
Good luck everyone!
M

QQQ PutQQQ has been in a downtrend since the start of April along with SPY, BTC, US30. The market is clearly crashing, I believe QQQ will fall to $285 - $293 zone and create a small rally after. Im looking to pick up QQQ $288 Put Expiring 5/13, the current price of the contract is going for about $245-250. Once QQQ hits my zone I will then look to pick up some short term calls.

BTC ShortBitcoin seems to be riding a new down trend, I think BTC will fall to 37k within the next 1-2 days. It could possibly even go down to 35.5k zone in 2-4 days. I've been tracking BTC since its rise on March 14th, my bias is short I expect it to keep dipping. If Bitcoin does continue to dip down towards 35k I think bulls will then eventually take over and create a new uptrend.

GBPPUSD POSSIBLE NEXT MOVESHi guys!
Please, can you like for reputation so I can get involved in the chat.
I believe GBPUSD will go to 26200 and then continue the trend downwards. The DXY is currently strong and will continue to show its strength this week.


USDCAD We could see 150 pips move as soon as tomorrowThere is a good chance that we see this pair trade between 1.2850 and 1.2695, this are important levels that are align with significant structure. I will be conducting a multi time frame analysis to give you a good perspective of the possible move that could happen as soon as tomorrow April 29,2022.
Monthly
The price is currently trap between supply and demand. Currently the price is retesting the supply zone. We could expect a rejection to the downside because this a significant level. Short term move to the downside is most likely to happen .
Weekly:
The price is currently rejecting a trendline that it has been respecting since 21Dec2020. This trendline is also align with the important supply zone that we can clearly see from a monthly perspective. A movement to the downside is most likely to happen according to this time frame.
Daily
The price has created an impulsive move leaving crystal clear imbalance in price, there is a high probability of a retracement coming up to make the price efficient. This impulsive movement is testing a supply zone which give us another strong confluence that the price is close to make the retracement. Also, the price is trading above average in this scenario is likely a push short from institutional perspective.

Eicher motor short swingHere is my view on analysis for short term swing in Eicher motors.
PS- Put stop loss below that breakout candle

GSS INFOTECH *** 10 YEARS OF BREAKOUT ***
BUY GSS INFOTECH abv 152 on Closing basis...
If this stocl sustained abv 152 thn just see the magic...
Tg 161/166/175

Waiting for positionAs mentioned in the previous forecast set, we received good support at $ 1900.
Currently the price chart will fluctuate between the two levels displayed.
Passing each level will indicate a continuation in the same direction.

NIFTY MOVEWhat will be NIFTY Move, Nifty formed Inverted Head and Shoulders (Shoulders Not formed yet) will it form ? Or Break ?
My prediction
If NIFTY goes last Weekly candles low then nifty will fall more. If NIFTY crosses Last week High then NIFTY will go up

Ripple (XRP) Buy ZoneRipple (XRP) Buy Zone
--------------------
BIAS
Short-Term : Bullish
Risk : Medium
Expecting to see a short-term lower time frame we can expect to see at least a short term bounce of 3-5% overall.
--------------------
$XRP/USDT LONG SETUP
Leverage : x3 - x5
Entry Price : 0.7135 - 0.705
TP 1 : 0.7185
TP 2 : 0.726
TP 3 : 0.7285
TP 4 : 0.7335
TP 5 : 0.7385
TP 6 : 0.7445
TP 7 : 0.75
TP 8 : 0.755
Stop Loss : 0.6935
*Maximum 3% of Portfolio.
*Unload 12.5% at each TP. Whenever TP 2 hits, Move stop loss to entry.
--------------------
