Silver is Probably Over... For NowI have been watching the most interesting price action of the end of 2025: COMEX:SI1! (Silver). On the swing timeframes price is completing a fractal of the price action from December 28th:
-Big Selloff
-Attempted Retest of High
-HOLD of the 50% Retracement
-FAILURE to retest/break the high
This type of price action seriously dents momentum especially in such a volatile Rise In Price (RIP).
Fractal Price Action
What is interesting is that this is a fractal continuation of the price action from the Weekly open on Sunday night. The same pattern:
-Big Selloff
-Attempted Retest of High
-HOLD of the 50% Retracement
-FAILURE to retest/break the high
I noted saw this Sunday and wanted to put out a short but options markets were not open and I did not feel like putting down $10,000+ margin risk on Silver. I just noted it to group chats where I have a good friends who are Silver bugs that have been diligently HODLing for over a decade as a warning. I hope they took heed.
The Bubble
At this point in the standard bubble model complacency has been given over to anxiety. This is still a very short term, swing timeframe, pattern at the moment however.
In the long term the most probably pattern will be a full pullback on the Daily. Support may be found at multiple points along the RIP including the 50% Retracement of the recent yeet (65), the Volume Profile node (58), or the Breakout Pivot (53). Then as we get into Q1 2026 we will see the wider move playout. It may not be "over" entirely but definitely for 2025!
Happy New Year!
Si!

Silver pump vs the Algo - Who will win?COMEX:SI1! COMEX_MINI:SIL1! TVC:SILVER
The algorithm has reached a terminal exhaustion state at the 4.0 Standard Deviation Macro-Extension effectively completing the parabolic expansion cycle initiated from the 2024 lows.
The current price action represents a 'Distribution Node' at the 60.00 psychological event horizon where the Smart Money is actively offloading inventory into late retail buyers before initiating a high-velocity repricing event to the 54.020 algorithmic equilibrium.
Entry: 58.850 (Market Execution / Sell Limit)
Stop loss: 60.150 (1.300 points)
Take profit: 54.020 (4.830 points)
Risk to reward ratio: 3.71R
The Opportunity
The Monthly chart reveals the absolute truth: Price has struck the 4.0 Standard Deviation projection. In the realm of IPDA, this is the 'Statistical Extremity'—a zone where the probability of continued vertical expansion collapses to near zero and the probability of a mean reversion increases exponentially.
The market has left a massive 'Liquidity Void' between 54.00 and 58.00. This is not structural support; it is thin air. The algorithm abhors this vacuum. The 54.020 level identified is not merely a support level; it is the 'Fair Value' origin of the final impulse leg. The market must return here to close the circuit and validate the breakout.
The Entry
Entering short at the 58.850 region capitalizes on the 'bull trap' formed by the failure to displace above 59.50. The 8-hour chart shows a loss of momentum and the formation of a 'Rounded Top' distribution profile.
The algorithm is currently holding price up solely to induce 'Fear of Missing Out' (FOMO) longs. Once the Asian/London liquidity is swept, the floor will be removed, and the price will seek the path of least resistance: down through the vacuum.
The Invalidation
The bearish causal chain is ontologically corrupted if price achieves a daily close above the 60.150 Omega Point.
A breach of this level would imply that the market has entered a 'Hyper-Inflationary' discovery mode, ignoring standard deviation constraints.
This would shift the probability manifold to the Primary Antithetical Chain targeting the 62.00-65.00 vector.
Key Trajectory Waypoints
Target 1: 57.200 | Type: Immediate Structural Low | Probability: 85% | ETA: 24-48 Hours
Target 2: 55.500 | Type: 1.5 SD / Mid-Void | Probability: 70% | ETA: End of Week
Target 3: 54.020 | Type: The Great Rebalance | Probability: 55% | ETA: 1-2 Weeks
The Shadow Reality
A 20% probability exists for the antithetical reality: The Flag Continuation.
In this scenario, the 58.00 level acts as a 'High Tight Flag' support, and the market consolidates sideways to burn time before one final thrust to 61.00.
This reality is confirmed if price refuses to trade below 57.80 for 48 hours.

Why Silver Is Reaching New High?Why Is Silver Reaching New Highs?”
There are two key reasons for this:
First, it is due to de-dollarization. At this juncture, there are no other currencies ready to take over as the dominant reserve currency. Therefore, the market is turning to precious metals like gold and silver. We can also observe that each time the dollar trends lower, precious metals tend to move in the opposite direction.
Second, why is silver gaining momentum over gold this time? While gold is still trading below its October high, silver has already broken above it with strong momentum.
These are the two questions we will be discussing today.
Mirco Silver Futures
Ticker: SIL
Minimum fluctuation:
0.005 per troy ounce = $5.00
Disclaimer:
• What presented here is not a recommendation, please consult your licensed broker.
• Our mission is to create lateral thinking skills for every investor and trader, knowing when to take a calculated risk with market uncertainty and a bolder risk when opportunity arises.
CME Real-time Market Data help identify trading set-ups in real-time and express my market views. If you have futures in your trading portfolio, you can check out on CME Group data plans available that suit your trading needs www.tradingview.com

4000 year old money EuphoriaKudos to my good friends that have patiently waited a decade for this ancient money to finally yield great returns. But it's my job here to urge caution and share the lessons of historical finance.
First, let's try to "value" silver historically:
Code of Hammurabi (1750 BC):
Minimum wage for common labor; 8 grains of silver (0.65 g) per day (0.021 oz)
Classical Athens – Periclean period (~450–430 BC):
Unskilled; 1 drachma = ~4.3 g per day (0.138 oz)
Skilled; 1.5–2 drachmae (0.21–0.28 oz)
Roman Republic (Early Empire – Augustus to ~200 AD):
Legionary; 2–2.3 g net per day (0.064–0.074 oz)
Urban unskilled; 3.5 g per day (0.1125 oz)
Roman Empire – Diocletian’s Edict (301 AD):
Farm labor; 0.5-1g per day (0.016-0.032 oz)
Sassanid Persia (~500–600 AD)
1 silver drachm ≈ 4 g per day (0.129 oz)
Medieval England – Statute of Labourers (1351, post-Black Death):
2-3 pence per day; 1 penny = 1.2-1.4g silver (0.077-0.135 oz)
United States – Early Federal period (1790–1800)
Common laborer $0.50–$1.00 per day; U.S. silver dollar = 24.06 g silver (0.39-0.66 oz)
United States – Coinage Act era average wage (1790s–1830s)
Unskilled labor ~$0.75–$1.25 per day (0.58–0.97 oz)
Throughout most of monetary history when silver was actually money, one day of common or semi-skilled labor bought roughly 0.05 to 0.28 troy ounces of silver (with 0.10–0.15 oz being the most common sweet spot in stable empires).
Today (Dec 3, 2025), with silver trading at $57.50/oz, an 8-hour low-skill U.S. wage at $17–$20/hr buys ≈ 2.37–2.78 troy ounces of silver per day — 10–25× higher than almost any pre-1900 historical benchmark.
So one could interpret this historic perspective in two ways:
Silver still has enormous upside to reapproach historical labor norms; An 8-hour U.S. production worker (~$31.50/hr) currently buys ≈ 4.4 troy oz per day — that is 4–7× higher than even the richest silver-standard societies ever paid free citizens, and 200–800× higher than the worst monetary collapses. For today’s wage to buy only the historical average of 0.12 oz/day, silver would need to trade around $2,100/oz.
We no longer pay wages in silver, so the comparison is meaningless; Labor is now paid in fiat, and silver is primarily an industrial/hedge asset. Monetary demand is only a fraction of what it once was, and productivity, technology, and energy inputs have exploded. A direct 1:1 labor peg is never coming back.
Now, let's dive back into the realm of historical analysis that is most relevant.
Much sooner than 4000 years ago (11 actually) silver had a great "yeet" which saw it rise bottom to peak by +493% (the current rise is at 412%). However, the drawdown from the 2011 high was -72%
If we go back half a century ago to 1976-1982 Silver rose +919% only to fall -88%.
The takeaway should not be that the rise in Silver might end here or anywhere. We just don't have enough data but we can infer historical parallels. Volatility is often a gift to investors but in silver, a 4000 year old money, it remains a double edged sword (as it may have been used to buy them back then).
Trade wisely.

Silver To 46 Before 50?Looks like a textbook mitigation play. Looking for LSPY for refined entry. Currently on the 5min tf there's a possible intraday distribution forming pre-FOMC, so I could consider that as a target if it fully forms before FOMC.

Gold vs SilverGold approaching Oct 14 mitigation zone while Silver approaches Oct 10 mitigation zone.
Gold price action more bearish over london session but in higher timeframe, gold dropping less aggressively considering it's barely approaching Oct 14 price while Silver already well below its respective Oct 14 levels.
Will be a market execution idea based on which gets to its zone last.

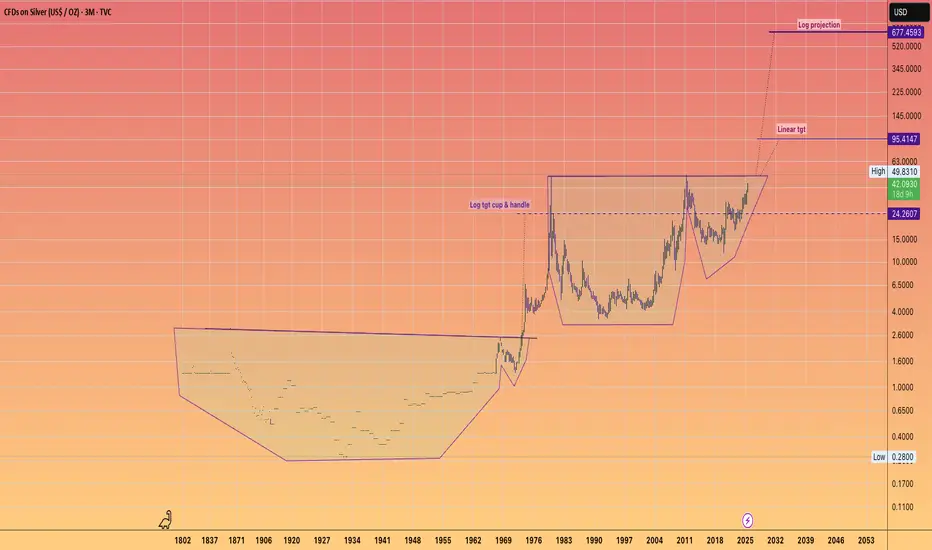
SILVER Accelerating to $95This is the full history of Silver.
With it's two GIANT Cup & Handle Patterns.
Big Patterns = Big Moves !!!
I find myself uncertain about the kind of world we would inhabit if Silver were to achieve the LOG projections in a chaotic disorderly manner.
We are undoubtedly stepping into a period of significant transformation across various sectors for global society in the coming decade or two.
Finance. Governance, Technology—let's seize the moment and take full advantage of the incredible opportunities available to us.
Silver to $38The move from March 2020 to August 2020
Was a measured move that played out to the Tee.
We have a similar structure building that projects to the High 30's
Suggesting #Gold move beyond ATH's and #Silver the beta play to move faster in an attempt to catch up, and move towards it's high's again.

PAAS – High Tight Flag with Silver TailwindsPan American Silver ( NYSE:PAAS ) is forming a high tight flag — one of the most explosive continuation patterns — just as silver starts heating up.
🔹 High Tight Flag Formation
NYSE:PAAS ripped with momentum and is now consolidating in a tight, bullish range.
This is exactly what you want to see — shallow pullback, tight candles, and holding near highs.
🔹 Sector Momentum: Silver Heating Up
AMEX:SLV and /SI are pushing toward multi-year breakout levels.
NYSE:PAAS is riding that same energy, and any continuation in silver could ignite this setup.
My Trade Plan:
1️⃣ Starter Position: Looking to enter on strength through the top of the flag.
2️⃣ Add on Confirmation: Add size on volume surge and breakout follow-through.
3️⃣ Stop Loss: Below flag base — keeping it tight and defined.
Why I Love This Setup:
High tight flags are low-risk, high-reward when paired with macro momentum.
Silver is gaining strength — NYSE:PAAS could lead the miner group if this breaks clean.
Strong structure, clean risk, macro fuel = great setup.

Metals & Miners Are About To EXPLODE HIGHER (50%-100%+)Please don't miss this opportunity.
I've been studying the metals charts, and last weekend, the SILJ chart caught my attention.
I started looking at longer intervals (Weekly and Monthly) to see what I could find.
XME and SILJ are showing excellent Inverted Excess Phase Peak patterns that may resolve as a breakaway upward price trend over the next 8 to 24+ months - sending both XME and SILJ over 40-50% higher at a minimum.
This sounds crazy, but Metals and Miners are probably the best opportunities for swing position trading right now as hedge investments and/or very long-term options play.
There is nothing else out there that has a 100-200% rally potential and the ability to hedge against global risk factors.
I believe SILJ, XME, Gold, Silver, & Platinum will likely be HUGE WINNERS over the next 12-24+ months.
Get some.
#trading #research #investing #tradingalgos #tradingsignals #cycles #fibonacci #elliotwave #modelingsystems #stocks #bitcoin #btcusd #cryptos #spy #es #nq #gold

Will Silver Close at the High This Year?In September, we discussed the potential of silver forming a 'Cup & Handle' pattern, similar to what we observed with gold at the end of 2023. We saw how gold performed in 2024.
If the Silver can settle at around here at the end of this year, establishing this formation, we should be able to see the rising trend of the Silver in 2025.
In this tutorial, we will discuss why silver may close higher towards end of the year.
Silver Futures & Options
Ticker: SI
Minimum fluctuation:
0.005 per troy ounce = $25.00
Micro Silver Futures
Ticker: SIL
Minimum fluctuation:
0.005 per troy ounce = $5.00
Disclaimer:
• What presented here is not a recommendation, please consult your licensed broker.
• Our mission is to create lateral thinking skills for every investor and trader, knowing when to take a calculated risk with market uncertainty and a bolder risk when opportunity arises.
CME Real-time Market Data help identify trading set-ups in real-time and express my market views. If you have futures in your trading portfolio, you can check out on CME Group data plans available that suit your trading needs www.tradingview.com

Can SILVER BREAKOUT above 32.50?Silver (along with every other beaten down commodity) exploded on the news of China's stimulus! Unfortunately for silver bugs "somebody" was lying in wait with a mighty big hammer when it poked its head above 32.50.
In a vacuum the fundamentals (supply/demand) are incredibly bullish. However in the macro context of China's housing and economic woes there is a bear case to be made for base and industrial metals. If Copper starts rolling over I expect Silver to follow. Raw cash injections might keep Chinese stocks afloat but I do not believe it alter the reality of the real economy and its effect on commodities.
In addition to the issues with China, the US is at serious risk of a recession. 50 basis point cut has never been bullish. If you take the time to look at the last initial 50 basis point cuts it might curb your enthusiasm. I know... this time "its different"
TECHNICALS:
Silver may retrace to the $30 breakout level.... Great re-entry... if it holds... ( ;
If Silver is able to hold above 32.50 the rally remains intact.

Natural Gas Price Forecast | Oil, Dollar, Silver, GoldNatural Gas stock Bulls PEPPERSTONE:NATGAS Support & Resistance Guide
AMEX:UNG Stock Forecast
AMEX:USO Oil Stock Forecast
TVC:DXY US dollar Stock Forecast
Gold OANDA:XAUUSD Stock Forecast
Silver OANDA:XAGUSD

SILVER SHORT via AG (WORST RUN MINER IN THE GAME) FUNDAMENTAL
- Price of Silver aside, AG is an incredibly poorly run miner. From mass share dilution to disastrous acquisitions I can not think of a more poorly run company. The stock price speaks for itself... sitting near the lows of the year despite silver at recent highs.
SILVER
- Silver has been behaving very weak in relation to Gold. Unless we break out above 31.50-32.50 I see Silver continuing to be range bound at best. There are many reasons for this. Mainly indications from strong correlations that I will not mention (secret sauce).
TECHNICALS
- The price is at a solid supply level (6.20) and has already began dramatic impulses to the downside at any hint of Silver rolling over. In addition we have divergence on the RSI.
DISCLAMER: No Neumeyers were hurt in the making of this post

The ART of sitting ON YOUR HANDSI was not always a bear... but my arms are tired of holding these Silver Bags for over a decade. I am still bullish! In the long long term ( ;
I am still holding a longterm SILJ short position ( see previous post ) but the immediate future is not clear. Will we get an explosive rally leading up to... during... or after the FOMC? I would not bet on it. The truth is however that nobody knows. As Ray Dalio says, "He who lives by the crystal ball will eat shattered glass"
The next few weeks will provide a challenge for market timers and speculators. I expect plenty of whipsaw and broken hearts before a trend is established (bullish or bearish).
I am waiting for a break of 29.83 to become a Bull and enter Long
I am waiting for a break of 26.67 to become a Bear (a big one) and enter Short
I strongly recommend waiting for a daily close over these levels before getting to comfortable unless you are prepared to keep a tight stop and run for the hills if either of these breaks turn out to be a trap.
Until then this range (in between the two levels will provide plenty of juicy scalping opportunities for cowboys like myself. I am using the .382 Fib level 28.10 (derived from the Oct 23 Low to the High in May 24) as my guiding light and BABB (Bullish above Bearish below) in the interim with TPs at my key break levels. They will be formidable resistance/support zones until broken and proven otherwise. Happy trading!

Gold Wash-out Low after Flag Apex. Need To See $2540+ On Close.Watch this video if you are trading gold. With a perfect Flag formation and a deep washout-low rotation, we need to see Gold rally back up to near $2540 to reach the Apex level again.
Any continued price weakness will show Gold may be attempting a deeper pullback after reaching $2570.
I believe Gold will settle very well into the end of the day. Possibly even reaching $2550+.
But, this is news-driven. This move is related to the geopolitical events taking place in Taiwan and other areas of the world.
Buckle up. Gold wants to move above $2602 - but it will be a struggle from now on.
Get some.
#trading #research #investing #tradingalgos #tradingsignals #cycles #fibonacci #elliotwave #modelingsystems #stocks #bitcoin #btcusd #cryptos #spy #es #nq #gold

Is the Silver to Gold Ratio due to tripleWallStSilver
Silver Bugs have had to bear many decades of no euphoric price action
Like the saying goes every dog has it's day
And in speculation a Bull market in one sector often means another sector get's neglected
Things don't move in lock step
It's just the nature of speculating/investing which we can't control but also offers us opportunity
I believe Silver should be a relative out-performer of most things (not all things)
And cheap prices
or cheap ratio's tilt the odds in your favour.

Silver is Next to Rally After Gold Whenever gold prices are trending higher, it hints at trouble ahead. Historically, silver always catches up later. During past crises, when this happens, this “silver shift” is very fast and furious. Its magnitude for silver is much greater than that of gold.
Video discussion:
1. One key reason why silver is lagging behind for the time being
2. Why Gold and Silver always move in tandem over the long-term?
3. Is there a bond crisis ahead?
Gold Futures & Options
Ticker: CG
Minimum fluctuation:
0.10 per troy ounce = $10.00
Silver Futures & Options
Ticker: SI
Minimum fluctuation:
0.005 per troy ounce = $25.00
Disclaimer:
• What presented here is not a recommendation, please consult your licensed broker.
• Our mission is to create lateral thinking skills for every investor and trader, knowing when to take a calculated risk with market uncertainty and a bolder risk when opportunity arises.
CME Real-time Market Data help identify trading set-ups in real-time and express my market views. If you have futures in your trading portfolio, you can check out on CME Group data plans available that suit your trading needs www.tradingview.com

Silvergate Capital Co "SI" Bullish BiasSI- Bottom?
Monitoring SI price and volume.
Tradingview makes me explain a bunch of other stuff before they allow for me to post this. So Im writing in here to fill up the space that it needs. Whatever it may be; Im pretty much just guessing here. hahah

QSI Quantum-Si | Why is so Bullish? Price Target ! If you haven`t bought the Double Bottom here:
Then I'll try an explanation why QSI Quantum-Si incorporated is so Bullish right now!
QSI is a protein sequencing company, which could be revolutionary, similar to the gene sequencing stocks.
Quantum-Si Incorporated is dedicated to developing a protein detection platform that enables Next Generation Protein Sequencing (NGPS). This comprehensive platform consists of the Carbon automated sample preparation instrument, the Platinum single-molecule detection and NGPS instrument with Time-Domain Sequencing chip, the Quantum-Si Cloud data analysis software, and reagent kits designed for use with its instruments.
QSI's competitor, RXRX, experienced a significant boost in its stock price after announcing a $50 million investment from NVIDIA (NASDAQ: NVDA) on July 12. The investment was part of a private investment in public equity (PIPE) arrangement. With this deal, NVIDIA gains access to Recursion Pharmaceuticals' (NASDAQ: RXRX) extensive biochemical and genetic data. NVIDIA plans to utilize this data to train machine-learning models in support of its new BioNeMo service, an artificial intelligence (AI) tool for drug discovery. Simultaneously, NVIDIA will also collaborate with Recursion to enhance their own models for drug discovery.
Apart from Quantum-Si's Platinum product, which began selling this quarter, the company also offers cloud-based proteomics data analysis software, made possible by their single-molecule detection and NGPS instrument with Time-Domain Sequencing chip.
Considering this, I believe it's only a matter of time until a major chip developer, such as NVDA, or a cloud services company with interest in the field, makes an investment similar to NVDA's investment in RXRX.
This is my growth thesis, and regarding the Price Target, I find $10 to be reasonable for now, and there's also the possibility of a potential buyout.
Looking forward to read your opinion about it!

#Litecoin Part 2 -- explosive move versus #silverWe have an upside #HVF for #LTC against #Si !!!
Watch this video to see what that ratio could be!
At some point we will see a precious metals bull market return with a fury
will investors favour the #digital #commodity instead?

SI Silvergate Capital going to $0???If you haven`t sold crypto`s favorite bank, SI Silvergate, here:
Then you should know that Silvergate Capital Corp, the parent company of Silvergate Bank, announced its closure and liquidation of assets on Wednesday.
Shortly after, New York state banking regulators closed down Signature Bank to prevent the fallout from the failure of Silicon Valley Bank.
Lawyers representing plaintiffs in a class action lawsuit by FTX customers against 18 defendants, including Signature and Silvergate, claim that these events will severely limit the amount of money they can access if they can prove the banks are responsible.
Kerry Miller of Fishman Haygood, whose firm filed the lawsuit in Miami federal court, stated that FTX customers may have to rely on insurance policies covering the banks' top executives and board members since these events impose another hurdle.
Haven`t seen any bidders for it, or other banks supporting SI SIlvergate.
Most likely to file for bankruptcy and go to $0.
Looking forward to read your opinion about it.

JPM / JP Morgan - Don't Gamble On Regional BanksI know that whenever something drops by 30 or 50 or 70 percent in one or two days it seems like you might be able to smash buy and ride the bounce back to the top, but just take a look at how well that worked out for tech stocks once the market started to correct at the end of 2021, or just take a look at how well that worked for Silicon Valley Bank dip buyers who found their shares worth $0 in a few hours.
JP Morgan and the other big American banks aren't just "big American banks," but the financial arm of the United States' military industrial complex. Moreover, they're something that's become a pillar of the entire world's financial ecosystem. The heart of the world's economy is in Manhattan, but they're also the ones responsible for providing a financial life line (a blood transfusion) to the Chinese Communist Party all of these years.
Here's some things everyone should think about:
1. Regional banks are not a buy, because they need to be eliminated for Central Bank Digital Currencies
2. SWIFT itself is expanding its CBDC platform pilot globally after a test run that involved a JP Morgan-created centralized fork of Ethereum .
3. CBDCs are required for the global implementation of the CCP's social credit credit system
4. CBDCs mean citizen and small business banking becomes centralized in Federal Reserve proxy accounts ran through the biggest banks
5. Welcome to communism. The purpose of all of this is to install communism for the purposes of attempting to change the human living condition.
Credit Suisse is probably going to implode for real and that's going to cause some chaos for the markets. This play is pretty much a mirror of the 2008 GFC with Bear Sterns, which everyone would do well to educate themselves on how that went down .
The problem with Central Bank QE isn't all the Libertarian crap you've been told. The problem is that deposits are a liability for banks because they have to pay interest on them, and so they need to seek yield. Seeking yield on a very large position is very hard, because guys like JPM and Blackrock and Vanguard happen to make the markets, and markets are a euphemism for a casino, and casinos are zero sum games where there's a small number of winners and a large number of losers.
And so when there's no interest rates, banks have to take risks to generate cashflow to pay interest to the very, very large depositors. When QE was hot that seemed to have meant long bonds, long equities. And then the Fed raised rates 5 percent while they were holding a lot of equities and bonds and now those bonds and equities aren't worth very much.
So they're red on their positions and can't HODL through it because of bank runs and go under.
It's as simple as that and it was an engineered play for smaller banks to be destroyed and then the big banks buy the liquidations.
It's the same as how whales kill sharks by holding them upside down in the water, which makes them disoriented and paralyzed, and then the whales eat their livers and leave them to die.
JPM on the monthly is not likely to have topped and gives you no reason to think there's a financial crash or any real bearishness brewing:
Yet the weekly shows you confluence between Fib levels and gaps, and that it's just too early to go long, and kind of scary to scalp short to boot:
JPM's double tops at $145 made very little sense at the time, and that's because, in my opinion, they were short their own stock under $150 in anticipation of what everyone who's running big data analysis for real knew, that SIVB and SBNY and SI would collapse, that CS was a bloated corpse in the river that the Swiss National Bank couldn't save, and that it was time to start taking down the regional banks by using the crisis as an opportunity.
Naturally, being a bank and part of the sector, this will give grounds to make JPM's shares drop, so they just sell, and then buy back, and then give themselves bonuses and go for happy hour with cocaine and strippers when the drama is over because someone buys CS and the Fed pauses hikes, and they pump their own stock back to $200.
Another thing is that the narrative is that equities are *going2themoon* because the Federal Reserve just HAS to stop hiking rates now. Look at how much damage the rate hikes caused! They just have to stop hiking now!
They probably won't. FOMC hasn't led to a dumpster fire in quite a few months and you should be concerned about that.
After Wednesday's FOMC, the next one afterwards is May 2. Expect them to pivot then, not now, and for May, June, July to become another "most hated rally" for bears.
Except this time it won't be a bear market rally, but a bump and run reversal, that pumps tech and other dumpster trash to a new ATH that makes bears blow their accounts.
Look for longs in the $110 range on JPM and expect the October bottom to hold, because it's called a pivot for a reason, sons.
It's JP Morgan. This kind of disaster in the markets today was arranged by them, and is not something they're personally subject to.
The disasters that lie ahead for the current regime because of what they've been doing to help the CCP as it persecutes Falun Gong over the last 24 years are retribution that they haven't arranged and that nobody can dodge, and something that will catch the entire market off guard.
But for now, you can get $40 a share if you buy in the $110s and sell at $150. And the time horizon is probably literally no later than the end of May, too.
Don't go long on regional banks. Go long on the big banks. And then get out and be careful, because everything in this world is about to change very quickly, and human beings are not going to be able to bear the terribleness of what happens when the regime goes to install communism worldwide.
