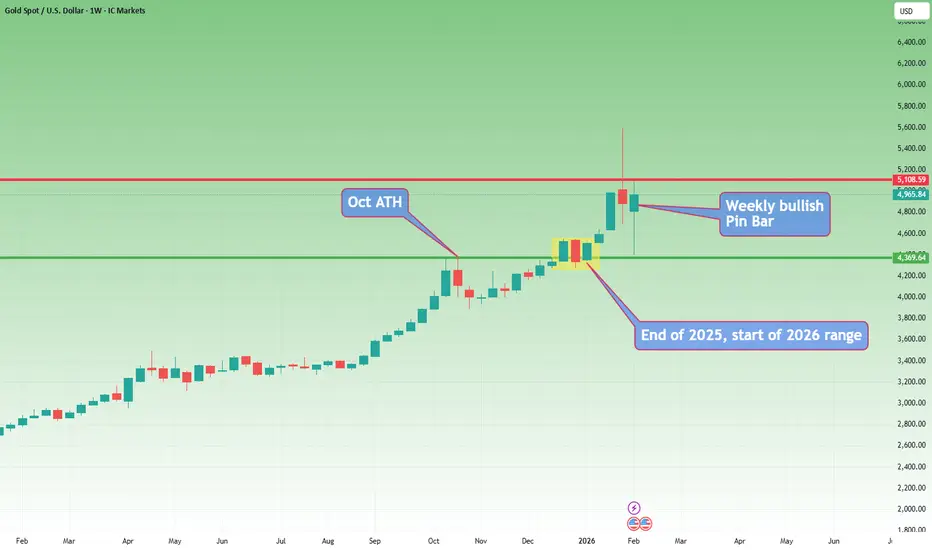
Gold- From weekly to 15m chart. Where are the trades?These days, everyone has an opinion on Gold.
Most of them are bullish.
And to be fair — so am I.
But here is what many traders either don’t understand or simply ignore:
There is a huge difference between having an opinion and having a tradable opinion.
A tradable opinion is one that can actually be executed in the market, with leverage, risk control, and realistic stops — not just a direction on a chart.
This analysis is not about saying “Gold is bullish, it will go to 6k or 7k, I’m a genius if it does.”
It’s about giving traders something they can actually work with.
🔎 Weekly Chart — Big Picture Reality
Three things stand out immediately:
1️⃣ The 5600 → 4400 drop
Yes, it was massive:
- ~12,000 pips
- large in percentage terms
- emotionally shocking
But in long-term trend terms?
👉 Just a correction.
Even if we measure only the 2025 rally, the drop didn’t even reach a 50% retracement.
2️⃣ Technical respect of structure
The decline stopped almost exactly at the October 2025 ATH, which acted as support.
Markets remember levels.
This is not random.
3️⃣ Alignment with congestion
The drop also aligned with:
- the late-December congestion zone
- the starting price of 2026
The first prices of the year often act as major S/R zones.
This is classic market behavior.
✅ Conclusion from Weekly:
Trend is bullish. No debate here.
❌ But tradable?
Not really.
Why?
Because a correct structural stop would be ~8,000 pips away.
With leverage, that’s not trading — that’s praying.
🔎 Daily Chart — Still Bullish, Still Not Tradable
On the daily:
- clean reversal from support
- first impulsive leg up
- pullback forming a higher low
- recent Piercing Line bullish pattern
Again:
✅ Bullish structure
❌ Not tradable structure
A proper stop still sits ~4,000 pips away.
That’s not risk management.
🔎 15-Minute Chart — Where Trading Actually Happens for me lately
Given current volatility, this is what matters these days
Here’s what we see:
- initial rally in a rising wedge
- rejection from resistance
- drop from 5100 → 4650 contained within a bullish flag relative to the impulse
- breakout above flag resistance
- continuation toward 5k
- NY close near highs
Structurally?
👉 Still bullish.
But even here:
❌ Buying blindly at 4965 makes no sense.
We need a dip.
We need structure.
We need asymmetric risk.
📌 The Two Buy Zones That Make Sense
If price offers them:
✅ 4900
✅ 4800
Those are the zones where risk/reward becomes logical.
⚠️ The Reality Most Traders Don’t Want to Hear
Even on a 15M chart:
- stops of 300–500 pips are normal
- targets should be well above 1,000 pips
Let’s be honest:
Bragging about a 100-pip Gold target these days is like bragging about a 2-pip win on a EURUSD trade.
simply not trading...
✅ Final Conclusion
✔️ Gold is bullish
✔️ I will look to buy dips
✔️ But only with structure and discipline
Because in this environment:
- volatility is extreme
- emotions are expensive
- precision matters more than bias
A trader’s job is not to be right.
A trader’s job is to make money.
And those are two very different things. 🚀
P.S.
And yes — if I see a clear reversal structure on the 15-minute chart, I can take a short trade, even if my overall bias on Gold remains bullish.
This does not contradict my opinion.
It simply reflects the reality that:
You can be bullish on the bigger picture and still trade short-term corrections.
Have a nice Saturday!
Mihai Iacob
Signalprovider
Gold — Wedge Played Out... Is a New Push Above 5K Next?Two days ago, I mentioned that Gold bulls should not forget last week’s events.
Even though we had a strong rebound from Monday’s 4400 low, the structure was forming a rising wedge — a pattern that often signals a downside reversal.
And the market respected that script.
🔎 The Pattern Delivered
The downside move indeed unfolded, and during the early Asian session overnight, Gold dropped into the 4650 zone, almost perfectly aligned with the projected target of the wedge.
From a technical standpoint, that was a textbook resolution.
📈 What Changed Now
The reaction from 4650 has been very strong.
Gold not only bounced, but also pushed back above the short-term downside channel that had formed over the past two days.
That kind of reclaim suggests:
👉 sellers losing control
👉 buyers regaining momentum
📌 Outlook From Here
At least for now, it is reasonable to consider that Gold may have formed a temporary bottom.
If momentum continues to build, a new test above 5000 increasingly looks likely.
✅ Trading Plan
My approach from here:
👉 Look to buy dips, while keeping risk controlled and entries structured.
✅ Conclusion
- Wedge correction: completed
- Support reaction: strong
- Momentum: rebuilding
As always, nothing's sure — but for now, the path of least resistance looks up. 🚀

Silver —Violent Swings Continue. Long-Term Still Bullish, But...Silver has clearly been the talk of the trading community at the turn of the year, and for good reason.
Price action has been nothing short of dramatic, with extreme moves in both directions.
🔥 Recap: A Historic Shakeout
Last week, after printing a 121 ATH, Silver experienced a brutal collapse of roughly 50,000 pips, dropping into the 71 zone.
That kind of move is not normal volatility — it’s liquidation and repricing.
Buyers eventually stepped in, and Monday marked a local low followed by a rebound. By yesterday, price had already recovered back above 90, reaching around 92.
Today, however, Silver dropped again and, at the time of writing, is trading back near support after only a modest rebound from it.
🔎 Bigger Picture vs. Short-Term Reality
📌 Long-term structure:
Still bullish.
On a multi-month horizon, what we are seeing can still be classified as a correction — even if it’s an aggressive one.
📌 Short-term structure:
Not bullish at all.
The rebound since Monday has a clearly corrective character, lacking impulsive strength and clean continuation.
That’s an important distinction.
⚖️ Two Different Approaches to Silver
1️⃣ Investing Approach
Buying physical Silver for long-term holding can make sense for some investors.
- You may not catch the exact bottom
- But timing matters less if the horizon is measured in years
2️⃣ Trading on Margin
This is a completely different game.
👉 Volatility here is not just “high” — it’s dramatic
👉 Stop placement becomes extremely difficult
👉 Position sizing becomes critical
In this environment:
✅ entry price matters more than bias
✅ quick adapting to market changes matters more than conviction
📌 My Personal Trading Plan
From a speculative perspective:
👉 If Silver rebounds back above 85,
I will look to sell rallies.
✅ Conclusion
Silver remains a fascinating market:
- long-term bullish
- short-term unstable
- emotionally driven
- quick and violante changes of direction
This is a market that rewards precision and punishes ego.
Trade small, plan ahead, and respect the volatility. 🚀

Extreme Volatility Remains. Structure Rebuilding After Shakeout.Yesterday, Gold extended its wild behavior with a move that, at one point, reached nearly a 10% drop, only for price to reverse the entire decline — and then fall again by roughly 5%.
This kind of price action is a clear sign of unstable, high-volatility conditions, where emotion and positioning play a bigger role than clean technical flows.
🔎 Where We Stand Now
The second sell-off of the day found support around the 4600 zone, and since then Gold has rebounded back above 4800.
At the moment, price is pressing into the median line of the ascending channel, which becomes a key technical reference.
📈 What Happens Next?
👉 If price manages a clean break back above the median line, upside continuation becomes the more probable scenario.
In that case, the next clear resistance sits around:
🎯 5150 zone
That would be the next logical magnet if bullish momentum rebuilds.
📌 Trading Plan
My approach remains cautious and tactical:
👉 look to buy dips,
but only:
- if the risk-to-reward is favorable
- and with reduced position size
✅ Conclusion
Gold is still in a high-volatility regime — which means opportunity exists, but so does HUGE risk.
No chasing, no oversized positions.
In this environment, precision entries matter more than direction. 🚀

Gold — Massive Drop After 5600 ATH. Is the Correction Ending?Last week was absolutely crazy for Gold traders. After printing a new ATH near 5600 following the FOMC, price collapsed aggressively — a reminder, once again, that markets reward humility more than confidence.
To be honest, although I expected a correction, the magnitude of the drop far exceeded my expectations.
❓ The Big Question: Is the Correction Over?
With Gold falling more than 10,000 pips in just three days, the natural question now is whether the correction is nearing completion.
My view:
👉 a reversal to the upside becomes possible after such an extreme move, especially as the market approaches key technical levels.
🔎 Technical Context
- Price is now approaching a major confluence support around 4500, reinforced by:
- previous structural reactions
- the psychological round-number effect
- oversold short-term conditions after a vertical drop
This is the type of zone where markets often attempt stabilization or at least a meaningful bounce.
📌 Trading Plan
My approach here:
👉 Look to buy dips around the 4500 area, if price shows stabilization or reversal signals.
However, realism is important.
⚠️ Risk Management First
These are extreme market conditions:
- volatility is elevated
- ranges are abnormal
- reactions are fast and unforgiving
Because of that, I will trade with reduced volume and stay flexible.
✅ Conclusion
The correction may not be fully over, but the market is entering a zone where a relief bounce or reversal attempt is reasonable.
In conditions like this, survival > prediction.
Low size, clear levels, and patience. 🚀

Gold Bullish Outlook - Buy Zone & 5200 TargetGold remains in a clear bullish market structure. Price is trading well above the rising long term trendline and has already confirmed multiple Break of Structure showing strong institutional buying interest. After the impulsive rally from the 4550-4620 base price paused briefly in consolidation and then expanded higher validating the continuation trend rather than a distribution phase.
Currently gold is undergoing a healthy corrective pullback after testing the resistance near 5094. The pullback is aligning perfectly with the premium discount zone where the 4840-4760 overlaps with previous structure support and trendline confluence. This strongly suggests the move is corrective not a trend reversal.
As long as price holds above 4760 the bullish structure remains intact and this pullback should be treated as a buy the dip opportunity. A strong bullish rejection from the buy zone or a confirmed 4H close back above 4970 would signal continuation toward higher targets.
From a fundamental perspective gold continues to be supported by persistent geopolitical risks global economic uncertainty and expectations of looser US monetary policy going forward. The market is increasingly pricing in slower US growth which keeps real yields under pressure and limits USD strength both positive for gold.
Additionally ongoing central bank gold accumulation and safe-haven demand further strengthen the upside bias. Unless we see a surprise hawkish shift from the Federal Reserve or a sharp USD rebound downside moves in gold are likely to remain corrective and short lived.
Trade Plan:
Buy Zone: 4840 – 4800
Buy Trigger: Bullish rejection from the buy zone or a strong 4H close above 4970
Targets: 5095 → 5172 → 5200
Invalidation: Sustained 4H close below 4760
Note
Please risk management in trading is a Key so use your money accordingly. If you like the idea then please like and boost. Thank you and Good Luck!

Bitcoin — Bearish Bigger Picture, But a Short-Term Reversal?When it comes to the overall outlook for BTC, I remain far from optimistic and continue to hold a bearish bias on the medium to longer term.
That said, markets move in waves — and based on last week’s price action, I’m now expecting a short-term upside reversal.
🔎 What Changed on the Chart
After breaking below the flag formation that had defined price action since late November, BTC dropped into the 86k zone, where it formed a local low.
What’s important is what happened next:
- price reversed quickly
- and moved back up to retest the broken flag structure
Under normal circumstances, a clean break from a continuation pattern like this should lead to acceleration to the downside.
The fact that this acceleration did not happen is, in itself, information.
👉 This behavior strongly suggests the possibility of a false break.
⚖️ Two Time Horizons, Two Different Biases
To be very clear:
Medium-term:
My bearish view remains unchanged, with 75k still my primary downside objective.
Short-term:
The current structure opens the door for a counter-trend long, especially if price continues to hold above the recent low.
📌 Trading Idea (Short-Term Only)
On the short-term horizon, I will look to:
👉 buy dips
The logic is simple and tactical:
- downside risk is relatively well-defined
- upside potential could extend toward the 95k zone
That gives a potential risk-to-reward of up to 1:5, which is more than acceptable for a counter-trend setup.
✅ Conclusion
BTC remains a bearish market on the bigger picture — but short-term price behavior matters.
Right now, the lack of downside follow-through after the flag break increases the probability that we are seeing a temporary upside reversal.
Trade the timeframe you’re in — and manage risk accordingly. 🚀

Gold — New ATH Above 5200. Momentum Strong, Risk Even StrongerYesterday, once again, Gold printed a new all-time high. Fortunately, despite being short earlier in the session — and having the trade running at one point with ~400 pips profit — I chose to close it at break-even after the reversal from just below 5050.
That decision was inspired...
After the sharp bounce from that local low, Gold started to consolidate below the 5100 ATH and, in its now familiar “very nice” fashion, it broke higher overnight — while I was sleeping.
That breakout triggered another acceleration leg, and at the time of writing, price is trading above 5220, marking yet another ATH.
🔎 Technical Context
From a technical perspective, yesterday was important:
Price broke above the resistance of the channel that had defined the range since mid-August and now, Gold is trading near the upper boundary / resistance of the rising channel that started in mid-January
At this moment, 5250 is the level acting as immediate resistance, and that’s where I’ll be watching closely for:
👉 price reaction
👉 loss of momentum
👉 signs of reversal or rejection
⚠️ Why I’m Not Buying Here
Missing the buy on the 5100 breakout changes everything.
From my point of view, there is no buy opportunity now, and the reason is simple and practical:
If we look at the last 10 days, there were two separate occasions where Gold dropped more than 1,000 pips in a very short time.
And since I’m speculating, not investing, I cannot afford — nor am I willing — to sit through that kind of drawdown.
✅ Conclusion
Trend: hugely bullish
Momentum: extreme
Risk: very high both on short and long trades
At these levels, chasing longs offers poor risk control, short is grossly against the trend.
I’ll wait for price behavior near 5250, and until the market gives a structured opportunity, staying flat is my approach.

Gold — Gap Up, New ATH at 5107… Then Reality Kicks InYesterday, once again, Gold opened the week with an upside gap and during the Asian session printed a new all-time high at 5107.
What followed was telling.
For almost 12 hours, price went nowhere, trapped in a tight range between 5050 and 5100 — classic behavior of a market absorbing orders after an extended move.
🔎 What Changed Near the U.S. Close
Toward the New York close, price finally broke the range to the downside.
- support gave way
- selling accelerated
- the opening gap below 5000 was filled
This wasn’t panic selling — it was clean, technical liquidation.
As expected, short-term traders stepped in quickly after the gap was closed, and at the time of writing, Gold is rebounding and trading around 5070.
❓ The Big Question: Was That the Correction?
In my Sunday analysis, I mentioned that a strong correction would eventually come.
So the natural question now is:
👉 Was this the correction… or just the beginning?
My answer: this was not the correction.
What we saw looks more like:
➡️ the first clear sign of profit-taking, not a full reset of positioning.
🔎 Going Forward: How I See It
Structurally, Gold is still bullish — and a new ATH is not out of the question.
However, the behavior is changing:
- upside start showing cracks
- ranges are forming near highs
- breaks down are followed by acceleration
That’s how tops begin to form, not how trends usually continue smoothly.
📌 Trading Stance
Personally, I will treat this rebound not as a buy, but as a potential selling opportunity, if price shows renewed weakness again.
✅ Conclusion
Structure: still bullish
Momentum: losing efficiency
Behavior: early signs of reversal starting to appear

GbpUsd is approaching important resistanceAfter an initial spike higher on the first Monday of the year, GBPUSD shifted direction and traded to the downside, with last Monday’s sell-off reaching the 1.3350 zone.
That level proved to be important.
🔎 What Changed Last Week
Last week, buyers stepped back in decisively:
- strong bullish participation
- a clean ~400-pip impulsive leg to the upside
At the moment, the short-term structure is still bullish.
⚠️ But Resistance Is Close — And It Matters
Despite the bullish momentum, price is now approaching a very strong and well-defined resistance area — one that has historically acted as a turning point.
When markets reach this kind of level after a fast recovery, 3 things often happen:
- price spikes into resistance
- momentum fades
- and the market starts to roll over
📌 Trading Plan
My focus is not on chasing the upside here.
Instead:
👉 If I see signs of exhaustion around the 1.3750 zone,
I will start looking for short setups.
✅ Conclusion
Until price proves otherwise, I treat 1.3750 as a zone where risk shifts from buyers to sellers

Nasdaq — Quiet Start to the Year, But the Structure Is Building.The first month of the year was unusually quiet for the Nasdaq, with price contained inside a tight 1,000-point range, roughly 4% of value.
That calm, however, is starting to fade.
🔎 Signs of Life Since Last Week
Since last week, the index has begun to show clear bullish intent:
- a bullish engulfing candle on Wednesday
- followed by another bullish engulfing yesterday, which pushed price directly into resistance
- This sequence suggests buyers are no longer passive — they are stepping in with intent.
📐 Bigger Picture: A Clean Technical Structure
Looking at the broader context:
After the ATH at the end of October, the correction that followed stopped almost perfectly at the August ATH
From there, price began to compress higher, forming an ascending triangle on the daily chart
This is a textbook continuation pattern:
✔️ rising lows
✔️ flat resistance
✔️ tightening price action
🌍 Macro Noise Didn’t Break the Trend
Despite ongoing geopolitical tensions, the Nasdaq structure remained intact.
In fact, rather than breaking the trend, the volatility reinforced the compression, which often precedes expansion.
🎯 Outlook & Target
With such a clear technical setup and sustained structural strength, it is reasonable to expect:
➡️ a break above resistance
➡️ followed by continuation toward new ATHs
The measured move target for the ascending triangle comes in around:
🎯 27,800
That level could represent a realistic swing target for traders aligned with the trend.
✅ Conclusion
Nasdaq spent a month consolidating
With momentum returning and structure tightening, the market is positioning itself for resolution to the upside.

Gold at 5K: The Trend Is Up… But a 3K–5K Drop Feels InevitableLately, Gold is on everyone’s lips, and for good reason: price is printing new all-time highs almost daily, and we are now trading around the 5,000 zone.
And even though I’m not blind — I’m absolutely not calling for an overall trend reversal — in my view, a correction of 3,000 to 5,000 pips is not only possible, but unavoidable at some point.
The only real problem is simple:
✅ When does that correction start?
✅ And from where exactly does it begin?
That’s what I’m trying to identify in this analysis: the timing and the location.
The Bigger Structure: Consolidation → Breakout → Channel
Looking at the chart, after reaching an ATH at the end of April 2025, Gold entered a symmetrical triangle consolidation phase that lasted until the end of August.
That consolidation acted as a continuation pattern, and once price broke out, we got a strong expansion leg that ended with the ATH from the end of October, near 4,400.
The correction that followed was strong — but honestly, also normal considering the magnitude of the move.
That pullback stabilized around the 3,900 zone, which later became the lower boundary of what turned into an ascending channel that Gold has respected since then.
The Key Detail: The Median Line Has Been the Real Resistance till January
One important detail here:
Until the beginning of 2026, the lower channel boundary offered consistent support.
However, the real resistance inside this structure has not been the upper channel line.
Instead, it has been the median line of the channel.
So rather than trading the channel “edge to edge,” Gold has spent a lot of time reacting to the median line as a decision level, behaving as resistance.
The Current Situation: Acceleration Above the Median Line
At the start of this year, price was back around 4,300, sitting directly on the channel support.
From there, Gold rallied aggressively.
In only three trading weeks, price climbed roughly 7,000 pips, and last week we saw a breakout above the median line, signaling acceleration.
That’s the key word here:
📌 Acceleration
When price breaks above the median line of an ascending channel, it often implies the market is trying to “stretch” toward the upper boundary before the next meaningful cooling phase.
So based on structure alone, it becomes reasonable to expect continuation toward the upper channel boundary, which currently sits around 5,150.
What History Inside This Channel Tells Us
Now, if we judge today’s situation using the prior behavior inside this same structure, we can see something very consistent:
Back in October, once Gold reached the upper boundary, it dropped violently — roughly 5,000 pips.
And after price touched support, every time Gold approached the median line again, it met sell pressure, and another correction followed.
This is also normal channel behavior:
✅ Median line acts as resistance when price is below it
✅ Median line can act as support when price is above it
✅ Strong moves toward the upper boundary often attract profit-taking
A New Piece of Context: JP10Y vs Gold Correlation
Now, there’s something worth mentioning here.
Even though I knew about it, I haven’t used this tool intensively before, but I believe it matters in this specific moment.
Yesterday, thanks to a TradingView Editors’ Pick , I found an article discussing the correlation between Japan 10-Year Bonds (JP10Y) and the price of Gold.
Looking at that comparison, three observations stood out:
- End of March (last year): bond interest dropped, and Gold followed
- October: bond interest was stable, and we got a correction
- March: there was a delay of around 4 days between the bonds starting to fall and Gold’s drop
Now, looking at the current JP10Y chart, we can see that interest has started to fall again.
What I Expect From This Bond Context (Without Overstating It)
I’m not expecting a strong fall like the one in March.
But I do expect something closer to what we saw in October:
➡️ a cooling / stabilization, meaning less upside pressure for Gold.
Putting Everything Together (The Full Logic)
So if we combine the structural view + the bond context + the recent volatility, we get a clean framework:
Gold is in a parabolic rise, and a correction is inevitable.
Since price broke above the channel median line last week, we can reasonably expect a test of the channel resistance around 5,150.
That would mean roughly another 1,000 pips upside, considering Gold is trading around 5,030 in off-market conditions — suggesting another potential upside gap at the Asia open.
JP10Y interest started to drop, and we could reasonably expect a stabilization scenario similar to October.
Recent corrections have been in the range of 7% to 12%, which at a 5,000 Gold price translates into:
~3,500 pips (7%)
~5,000 pips (10%)
~6,000 pips (12%)
My Conclusion
✅ Gold is bullish overall — no question about that.
✅ Gold is also bullish short-term — price can reasonably push into 5,150.
But…
📌 Besides intraday scalping, buying at these levels is not worth the risk (in my opinion).
What I Will Do
- Intraday buying can still be possible, but only with low volume
- I will pay extremely close attention to the upper channel resistance (if we reach that level)
- If I see strong reversal signs, I will sell
- And if I catch a good entry, I would genuinely want to hold a short trade for around 3,000 pips if not even more.
Have a nice Sunday!
Mihai Iacob

JPY Index — Reversal Signal Confirmed. EurJpy&GbpJpy in focusA week ago, I argued that a strong reversal could be next for JPY pairs, based on one key observation:
✅ the JPY Index was trading at an all-time low, but price action was contained inside a falling wedge — a pattern that often signals trend exhaustion and a reversal just around the corner.
And as always, the market did what it does best…
👉 it made one more new low, just to shake everyone out, before reversing.
🔥 Friday: The First Real Confirmation
Friday delivered a very important technical signal: a strong bullish engulfing candle
and even more importantly…
✅ a close above the descending trendline of the falling wedge
That’s a key detail, because wedge breaks matter only when the market accepts above the structure, not when it simply spikes and fades.
📈 Today: Gap Up and Strong Continuation
Today, the market opened with a clear gap above horizontal resistance and is trading strongly to the upside.
This is exactly how a real reversal begins:
- break the structure
- reclaim the level
- continue with momentum
✅ Going Forward: I Expect JPY Strength to Continue
From this point, I expect the JPY recovery / strength to extend further.
Which means my focus shifts to the pairs that can “pay” the best if JPY strengthens:
👉 EURJPY
👉 GBPJPY
📌 Trading Plan
My plan is simple:
✅ Sell rallies in EURJPY and GBPJPY as long as JPY strength remains the dominant theme.
If this reversal continues to develop, these crosses have the potential to deliver powerful downside corrections. 🚀

UsdJpy- Confluence Support Under PressureYesterday, I shared my view on the JPY Index, where I explained that a strong JPY recovery could be the next major move.
The first and most obvious candidate to reflect that shift is USDJPY.
🔎 What the Chart Is Telling Us
After an initial rise from support, USDJPY attempted another push higher, but the overnight spike faded completely — and price is now back into the same support area again.
What makes this level important is the fact that we are sitting on a confluence support, reinforced by:
- a key horizontal support zone
- the rising trendline drawn from mid-December
This is exactly the type of level where the market should react strongly if bulls are still in control.
⚠️ Spike & Fade = Weakness Signal
For me, the fact that USDJPY spiked up and then fully reversed back into support is not bullish.
It’s a clear sign of failed upside acceptance, and it often precedes:
➡️ a breakdown through support
If buyers were truly strong, they wouldn’t allow price to slip back so easily.
📌 Bearish Scenarios & Targets
If this confluence support breaks, the next downside path becomes realistic:
🎯 Shorter-term target: 155.75 (interim support)
🎯 Main support target: 154.50 (major floor inside the broader range)
A move into 154.50 would be fully aligned with the idea of JPY strength building across the board, as discussed in yesterday’s JPY Index post.
✅ Conclusion
USDJPY is sitting at a critical decision zone — but based on the rejection structure, I lean toward:
👉 support breaking, not holding
If price confirms the breakdown, the market could quickly accelerate lower toward 155.75, and potentially 154.50 next. 🚀

TheGrove | GBPUSD SELL | Day Trading AnalysisYou can expect a reaction in the direction of selling from the specified Breakout zone
GBPUSD moving higher as it tests the strong resistance area..
We expect a bearish move from the confluence zone.
Hello Traders, here is the full analysis.
I think we can soon see more fall from this range! GOOD LUCK! Great SELL opportunity GBPUSD
I still did my best and this is the most likely count for me at the moment.
-------------------
Traders, if you liked this idea or if you have your own opinion about it, write in the comments. I will be glad 🤝

New ATH Again. Stop Taken… and That’s Part of the GameYesterday, Gold printed yet another new all-time high and, on the way up, it also took my stop-loss.
Which sometimes happens to me… unlike some people in the comments who apparently have a 100% win rate 🙂
Joke aside, what matters far more than my stop is:
👉 what Gold is likely to do next
🔥 Yesterday’s Move Created Inefficiencies
The upside push was aggressive — 1,000+ pips in a very short time — and moves like that almost always leave technical footprints behind.
In this case, we have two inefficiencies:
1️⃣ 4850–4860 zone
2️⃣ the imbalance created on the breakout above the previous ATH
These are the types of zones that often attract price later, even if not immediately.
🔎 My Expectation: The Correction Won’t Be “Too Obvious”
Many traders will now expect a clean pullback into:
4880 zone, retest of old ATH, or
4860 zone
But in my opinion, those zones are too obvious, and the market rarely rewards so cleanly in this kind of environment.
Instead, I expect the correction to remain more shallow, likely:
➡️ holding above 4900
And if that happens, we could easily see:
✅ a strong weekly close near the highs
or even
✅ another push toward the 5,000 magnet zone
📌 Conclusion
Stop-losses are part of the game — nothing personal, nothing emotional.
From this point, my approach shifts to:
👉 buying dips
…and most likely focusing on scalping setups today, aligned with the dominant bullish momentum.
Strong trend, shallow pullbacks, and patience for clean entries. 🚀

Gold — Target Hit at 4750 zone. Is the Correction Over? In yesterday’s post, I explained that Gold was simply too extended to offer a clean buying opportunity.
Even though the trend was undeniably bullish, the market needed a moment of breathing room and rebalancing.
And that is exactly what we got.
🔥 Recap: A Violent Session, Exactly as an Overextended Market Should Behave
Yesterday’s trading session was, frankly, crazy:
- multiple spikes down
- sharp reversals
- unstable and emotional moves
…ending with a massive 1,000-pip bearish candle on H1 that pushed price directly into my downside objective around 4750.
That level wasn’t “magic”.
It was simply the first zone where the market had room to pause after a vertical rally.
❓ Now the Big Question: Is the Correction Finished?
From the recent ATH around 4888, the drop looks huge — roughly 1,300 pips.
So naturally, everyone is asking the same thing:
👉 Is the correction over and will Gold resume its strong upside trajectory?
My answer: I don’t think so.
🔎 Why I Still Expect Another Leg Down
Even if price is now showing what looks like “upside resumption”, I don’t see it as a fresh bullish impulse.
I see it as:
➡️ a corrective rebound inside the first bearish leg
In other words, the first drop likely isn’t the whole story — and once the rebound weakens, another leg lower becomes the more probable next step.
📌 Plan: Sell Rallies Again
My trading bias remains:
👉 sell rallies
And this time, the downside objective is:
🎯 4700 zone
Of course, risk has to be controlled and the key reference level remains:
✅ Conclusion
Gold is still bullish on the bigger picture — but in the short-term, I treat this as:
✅ correction mode
✅ unstable conditions
✅ opportunities for tactical shorts on rallies
Patience + structure first, always. 🚀

Silver- Gap Filled. Are New ATHs Next?Silver once again did what it often does best:
1️⃣ it was the first one to signal a reversal, and
2️⃣ it acted in a more technical and disciplined way, by filling the gap and resolving the imbalance.
That alone makes Silver cleaner to read than Gold at the moment.
Now that the gap is filled and the market is “rebalanced”, the natural question becomes:
👉 Are we going straight back to new ATHs again?
❓ My View: Not Yet
Just like in the case of Gold, I don’t think the next move is an immediate continuation higher.
In my opinion, the more probable scenario is:
➡️ a revisit toward the 90 zone
and potentially
➡️ another wave of selling just around the corner
The structure is starting to behave like a market that needs a deeper reset before it can trend again.
✅ Bigger Picture Still Bullish (But Context Matters)
To be clear:
- on the medium-to-long term, I remain more bullish Silver than Gold
- Silver’s macro trend is still strong
But we can’t ignore reality:
📌 Silver has almost doubled in value since late December last year
Moves like that rarely continue in a straight line without meaningful corrections.
✅ Conclusion
Silver is still a bullish market long-term — but short-term, I expect:
👉 more downside pressure
👉 a possible move back to 90
👉 and only after that, we can talk seriously about new ATHs again 🚀

Gold — The Move Is Too Extended to BuyYesterday I stayed out of Gold trading because, as explained in my previous post, none of my scenarios — neither for buying nor for selling — were confirmed by price action.
And that decision proved correct.
🔥 Recap: The Last 24 Hours Have Been Extreme
What we’re seeing right now is an incredible momentum run.
From yesterday, Gold has rallied roughly 2,000 pips and counting — and depending on how you measure the full extension from Monday, the move is approaching 3,000 pips.
This is not normal price behavior.
This is vertical movement, driven by momentum, emotion, and positioning.
✅ Mediun Term Bias: Very Bullish… But No Buy Entry
Even though I remain very bullish on Gold, at this stage I don’t see a realistic place to enter a long trade with:
- a logical structure
- and a manageable stop-loss
Buying at these levels feels less like trading and more like paying the market at any price just to be involved — and that’s usually expensive.
📌 My Approach: Look for a Short Setup Instead
So instead of forcing a long, my plan shifts toward looking for selling opportunities, but only if the market gives me the right structure.
For a short trade, I need two components:
1️⃣ an initial short-term correction (price must show weakness first)
2️⃣ a recovery in a corrective manner on the lower timeframes
(a weak bounce, not a new impulse)
If I get that sequence, then I will prepare for:
➡️ a new leg down
🎯 Target
If the plan confirms, my objective is at least:
✅ 1,000 pips downside, with a likely target area around 4750
✅ Conclusion
Right now, Gold is still in a very bullish environment — but the risk-to-reward for buying is non-existent.
So I’ll remain patient, wait for a correction + weak recovery, and only then look to execute a short with clear structure and controlled risk. 🚀

New ATH at 96, But Is the Market Done “ATH-ing” for Now?Yesterday, Silver pushed toward 96 and printed what has become almost normal lately: another new all-time high.
As expected, once that level was reached, volatility exploded — and fortunately, I managed to catch a quick counter-trend scalp, banking around 1,100 pips in a short amount of time.
But the real question now is not about yesterday’s spike.
👉 Is Silver done making ATHs for now?
In my opinion: yes. At least temporarily.
🔎 Context: A Huge Move, and the Market Is Starting to Change Behavior
Since the beginning of the year, Silver is up more than 30%.
But more important than the percentage gain is the price behavior since Monday:
- after the weekend gap up
- the very short-term structure shifted into a topping formation
- rallies into 95 and slightly above are consistently being sold
That is typically the first sign that the market is moving from pure momentum mode into distribution / exhaustion mode.
It doesn’t mean the long-term trend is broken.
It simply means the upside is starting to get crowded, and the risk-reward changes completely.
⚠️ Technical Confirmation Level
For me, the correction becomes “real” if we get:
👉 a clean break below 92.70
If that happens, the most logical next move is:
🎯 90 zone — mainly for filling the weekend gap
And if the breakdown accelerates, I wouldn’t be surprised to see:
➡️ 85–86 zone as an extended correction target
Markets rarely move in perfect steps — and when a parabolic run starts to unwind, it can surprise both sides.
📌 Trading Plan (Short-Term Only)
My approach going forward is straightforward:
👉 Sell rallies
✅ as long as 96 remains the ATH / ceiling
This is not a “long-term bearish call”.
This is a short-term tactical trade in a market that may finally be ready to breathe.
P.S. (For Those Who Don’t Understand but Still Comment)
1️⃣ Long term, I’m extremely bullish Silver.
I wrote about it recently and nothing has changed on the macro view.
2️⃣ Yes, this is counter-trend.
That’s the point — it’s a correction trade, not a trend reversal call.
3️⃣ If I take it, it’s short-term only.
No “marriage” with the position.
4️⃣ I know how to take a loss.
And I take it fast when the market proves me wrong.
5️⃣ If targets don’t get hit, I know how to manage exits.
Break-even, small loss, small profit — I’m not here to “hope”.
In markets like this, discipline matters more than prediction. 🚀

Gold- What Do You Do When Price Becomes Untouchable?Yesterday, Gold opened with a bullish gap above the old ATH and quickly printed a new all-time high at 4690. With the U.S. holiday reducing liquidity and participation, the market spent most of the session trading inside a range.
Overnight, the Asian session delivered once again and pushed Gold into a fresh ATH at 4717 (at the time of writing).
And in a situation like this, the big question becomes simple:
👉 What do you do now?
✅ The Most Obvious Answer: Stay Out
At these levels, both directions become dangerous.
Buying at 4710 forces an extremely wide and unrealistic stop-loss
(the nearest “clean” technical stop is easily 500+ pips lower)
Selling is even worse — because it becomes pure top-guessing and even if the market does correct, it might do so only after it squeezes you out first
This is exactly the type of market where traders lose money not because they are wrong…
…but because they refuse to accept that there is no good trade.
📌 Scenarios I Would Need to See for a Trade
Instead of forcing a decision, I’m watching for clear triggers.
1️⃣ Short Scenario (Sell Setup)
What I want to see:
- a spike higher
- clear reversal behavior
- and a drop back below 4670
✅ If price re-enters under 4670, and started to rise back in a overlapping manner, I will consider entering short.
2️⃣ Long Scenario (Buy Setup)
Here I want the opposite:
- a pullback lower
- but without breaking below 4670
✅ If price holds above 4670 and prints strong bullish candles (15-30 min), I will consider a long entry.
The advantage here is obvious:
stop-loss becomes more reasonable
➡️ around 200 pips, not 500+
✅ Conclusion
Sometimes the best position is no position.
No trade is also a trade — and at 4700+ Gold is currently offering more emotion than opportunity.
So if I’m going to “gamble” today, I’d rather do it in a casino placing 25–36 zone on the table — at least there I get a clean 1:3 risk-to-reward. 🚀

New ATL, But the Structure Hints at a Potential ReversalAfter breaking support with a strong weekend gap in early October, the JPY Index continued its decline and last week printed a new all-time low, falling even below the extreme levels seen in mid-2024.
The trend is clearly bearish — but the context matters.
🔎 Why This New Low Could Matter
If we zoom out and analyze the broader structure, we can see that the decline fron the last semester of 2025 is contained inside a falling wedge — a pattern that often signals:
✅ trend exhaustion
✅ potential reversal conditions
Even more importantly, this new all-time low in the JPY Index is largely explained by the new ATH in EURJPY.
Other major JPY pairs, while still extremely elevated, have not made fresh all-time highs — which suggests the move might be becoming imbalanced and stretched, rather than universally strong across the board.
🏦 Fundamental Angle: BoJ Pressure Increasing
Another key element here is the growing pressure on the Bank of Japan.
At these levels, the JPY becomes increasingly sensitive to:
- policy hints
- intervention risk
- shifts in yield expectations
This doesn’t mean a reversal is guaranteed — but it increases the probability of sharp corrective moves.
📌 What I’m Watching
I’m not buying a reversal blindly — but I am watching the index closely because:
👉 If the JPY Index manages to reclaim 690–700 zone, it could signal the start of a broader recovery.
✅ Conclusion: Potential JPY Strength = Opportunity on JPY Crosses
If that bullish recovery confirms, it could create strong trading opportunities in pairs like:
- EURJPY
- GBPJPY
with potential for:
➡️ 1,000+ pips downside correction (JPY strengthening move)
For now, patience is key — but the market is approaching an area where reversals become possible, not just theoretical. 🚀

ETH — Higher Lows Building Above 3K. Dip or Breakdown Signal?Since the low near 2600 in late November last year, Ethereum printed a strong initial leg higher toward 3500. More importantly, the market established a very solid floor just under the psychological 3000 level.
Since the end of last year, ETH has been gradually forming:
✅ higher lows
✅ higher highs
…a structure that supports the idea of further upside continuation.
🔎 Today’s Move: Drop, But No Technical Damage
Today’s Asian session opened with a downside move. However, this drop has not violated:
- the recent trendline support
- the key horizontal support zone
For now, this looks more like a pullback within an emerging bullish structure, not the start of a new bearish leg.
📌 Outlook & Levels
In my view, this pullback may provide a decent opportunity to position for another leg higher, potentially targeting:
➡️ 3500
➡️ and even 3700 in the next period
That said, one level must remain intact.
⚠️ Negation Level
If ETH loses the 3050–3100 zone, then the probability shifts toward:
❗ resumption of the longer-term bearish trend
✅ Conclusion
Until that breakdown happens, my idea is simple:
👉 Buy dips, as long as structure holds. 🚀
