Is This the End of the Insane Rally? (read before comment!)In my Sunday video, I argued that after Friday’s close it seemed likely that 4100 could be next for Gold — and indeed, Gold didn’t just stop there, it printed a new all-time high at 4180.
Yesterday, as usual, when I woke up Asia had already done its job — we’re used to that by now — and I found the price 400 pips higher. So, I simply watched.
However, last night, considering that after a 1500+ pip rally at least a correction could follow, I decided to take a short position — a very risky one, to be fair.
Luck (and timing) were on my side, and by the time of writing this post, the price already dipped under 4100, and my trade was closed with a +600 pip take profit.
________________________________________
The Big Question:
Is Gold done with this insane rise?
In my opinion — yes, at least temporarily.
There’s no secret that the price is overstretched, and if we look carefully at the chart, the recent 4,000-pip rise is contained within an expanding triangle.
We saw a short-lived spike above the resistance of that triangle — and also above the ascending channel — followed by a strong 1,000-pip reversal in just two hours, clearly signaling heavy profit-taking.
At this moment, the price has stopped its descent around the horizontal level below 4100, and we’re seeing a technical rebound.
I plan to use this rebound as a new selling opportunity.
While my first short targeted the 4100 area, my second trade will aim for the 4050 zone, which coincides with last week’s all-time high and now acts as a key confluence support.
________________________________________
Final Thoughts
Markets often humble us — and they do it with irony.
Although I'm very bullish on Gold overall, my last five trades have all been shorts.
And the irony? The results are more than satisfying:
✅ +550 pips
❌ -200 pips
➖ Break-even
✅ +350 pips
✅ +600 pips
That’s +1,300 pips profit from trading drops in a bullish market.
The market truly has a sense of humor. 😄
Signalprovider
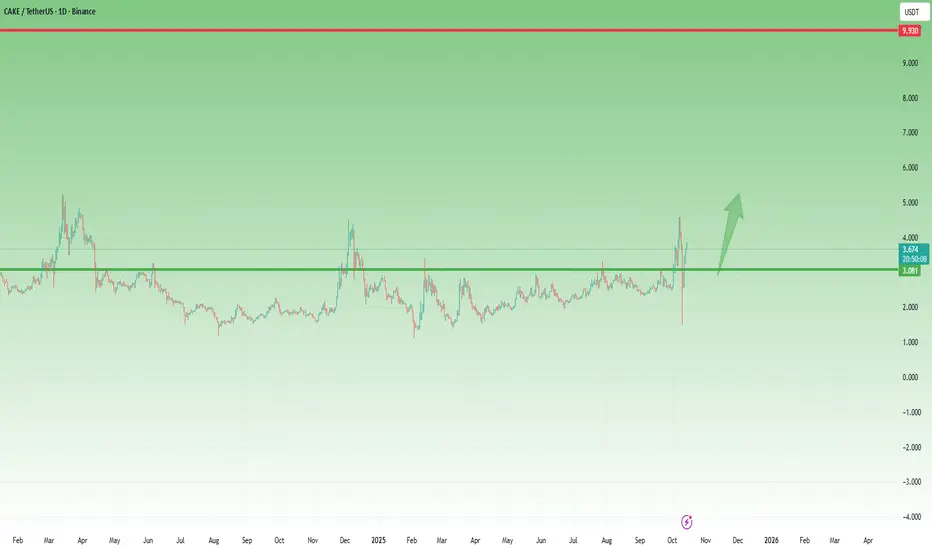
CAKE Analysis — Bulls Still in the GameIn my previous CAKE analysis, I mentioned that the coin could rise to at least 5 USD, following a breakout above the 1.5-year accumulation resistance.
That projection worked well, with CAKE reaching a high around 4.5 USD before entering what initially looked like a normal correction. However, Friday’s massive liquidation event turned that pullback into a sharp drop.
Yet, unlike many other altcoins that are still trading below their broken supports, CAKE showed an impressive recovery, quickly reclaiming the lost level. This kind of V-shaped recovery often signals strong underlying bullish pressure and confident buyers.
Technical outlook:
• Bias: Bullish again
• Key support: 3.00 USD (as long as price holds above, trend remains constructive)
• Target zone: 5.00 USD
• Strategy: Look for entry points near 3.00 USD or during healthy dips above that level
Momentum has shifted back to the bulls, and as long as 3 USD holds, the path of least resistance remains upward. 🚀
EURUSD Bears Still in Control – Rallies Are for SellingAs I explained before, my bias on EURUSD is bearish.
In yesterday’s DXY analysis, I mentioned that as long as the 98.60 zone remains intact, the U.S. Dollar Index has high chances to extend its rise toward 100.00.
That scenario is playing out perfectly so far.
Yesterday, EURUSD erased the entire Friday’s up move, falling back to its local support area. This type of reversal structure is typically seen in weak markets — when bullish attempts are quickly negated by strong selling pressure.
From a technical standpoint, this is very bearish price action. The market keeps testing the same support level without any meaningful bounce, which usually leads to a breakdown rather than a reversal.
My strategy remains unchanged:
• Bias: Bearish
• Plan: Sell rallies
• Short-term view: Pressure remains on the downside
• Medium-term target: 1.1400, with respect for the 1.1500 psychological level
As long as DXY holds above 98.60, EURUSD should remain under pressure. The pair might consolidate briefly, but the broader structure still points lower.

Everyone’s Bullish Again… But Is Bitcoin Ready?As I explained in yesterday’s post , even though I want to stay bullish — partly because I still hold a bag of altcoins — the overconfidence across the market makes me cautious.
Everyone seems convinced that “the bottom is in.” and history tells us that when sentiment becomes one-sided, it’s often premature.
________________________________________
1. Recent Price Action
Bitcoin indeed reversed from a key support zone and managed to recover part of Friday’s losses.
However, so far, this looks more like a technical rebound than a return of genuine buying power.
Momentum remains fragile, and price is still struggling.
________________________________________
2. Key Technical Levels
• Resistance: The $118K horizontal level followed by the $120K psychological barrier remain decisive.
Only a clear breakout above these zones would signal renewed bullish control.
• Support: On the downside, failure to hold above $110K would likely trigger a new leg lower, erasing the recent optimism.
________________________________________
3. Outlook
The structure is neutral-to-bearish until Bitcoin confirms strength above $118K–$120K.
Until then, this bounce should be treated as a reaction, not a reversal.
________________________________________
Bottom line:
I still want to be bullish — but I’ll follow the chart, not the crowd.
Confirmation first, conviction later. 🚀

DXY Analysis – Bullish Structure Still IntactIn my latest DXY analysis, I mentioned that the 100.00 level remains the next key target for the U.S. Dollar Index.
After an initial push higher to 99.55, the index faced some selling pressure and is now trading slightly below 99.00.
However, the constructive bullish structure remains intact as long as price holds above the 99.60 support zone.
________________________________________
1. Technical Context
• The recent pullback looks more like a healthy correction rather than a trend reversal.
• The higher-lows pattern remains valid, keeping the bullish momentum alive.
• The 99.60 area now acts as a key pivot zone — holding above it favors a renewed push toward 100.00.
________________________________________
2. Trading Implications
Given this setup, selling rallies in EUR/USD and GBP/USD remains the preferred strategy, as both pairs are likely to face renewed dollar strength once DXY resumes its upward leg.
________________________________________
In short:
The Dollar Index remains bullish.
As long as 99.60 holds, the path of least resistance stays upward — and 100 remains on the radar. 🚀

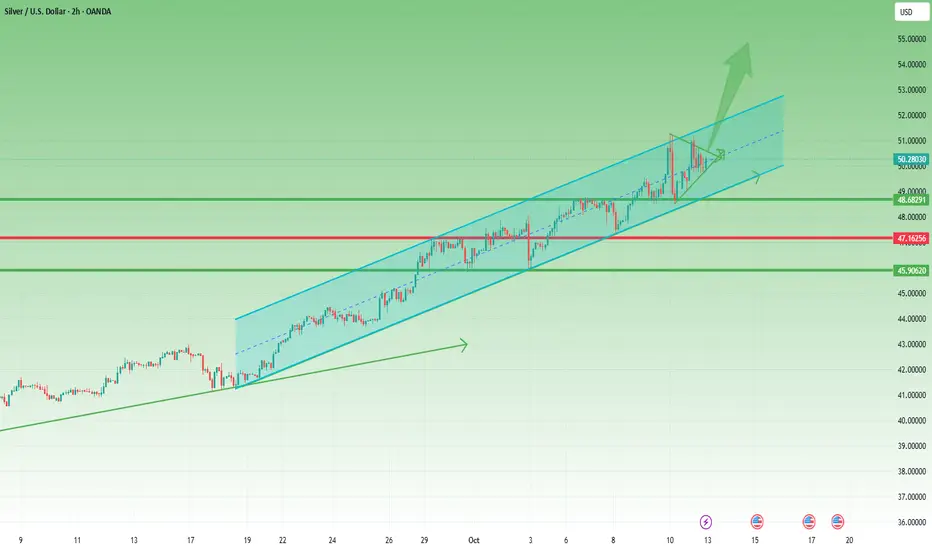
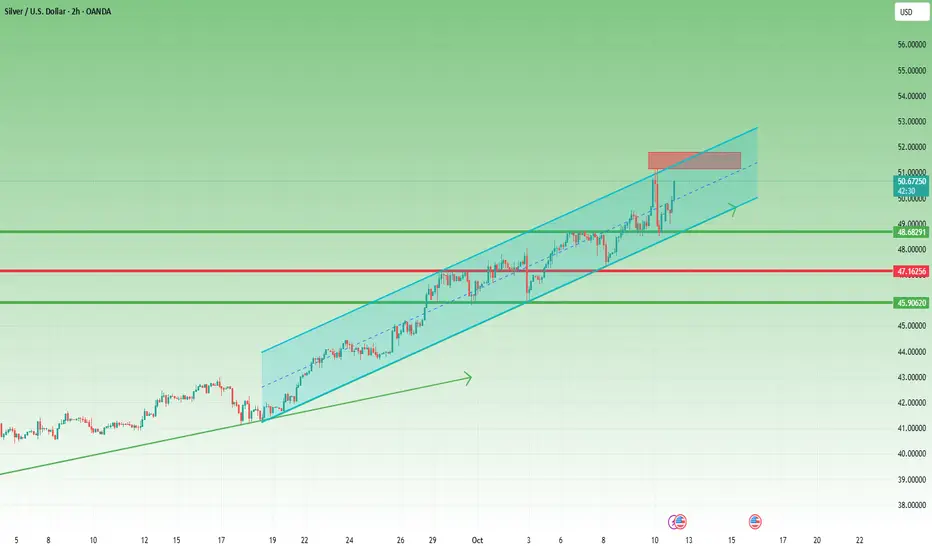
Silver: New ATH, Sharp Pullback, and What Comes NextLast week, something traders had been waiting for finally happened — Silver reached a new all-time high, touching 51.30 before a strong 3,000-pip selloff followed.
However, looking closely at the chart, we can see that this decline stopped precisely at the confluence of horizontal support and the ascending channel’s lower boundary — a technical level that often attracts renewed buying interest.
In my Friday’s analysis, I mentioned that although Silver looked very strong, traders should watch the ATH zone and the channel’s upper resistance for potential pullbacks. Indeed, XAGUSD reacted exactly from that area and corrected lower.
Now, things get very interesting:
1. Strong demand near $50 – Despite the initial drop on Friday, Silver built a solid floor just under the 50 level, suggesting that buyers remain in control and the recent ATH might just be a prelude to new highs.
2. Holding above the median line – The price is hovering around the channel’s midline without testing the lower boundary, a clear sign of underlying strength.
3. Potential pennant formation – Although not perfectly shaped, the price action since Thursday resembles a small pennant, which is typically a continuation pattern in bullish trends.
Putting these clues together, the technical picture still favors the upside, with confirmation coming if price sustains above the 50.50–50.70 zone.
If that happens, considering Silver’s recent momentum, we could easily see $55 as the next target in the coming week.
As long as $49 remains intact, my plan stays simple — buy the dips. 🚀
TAO Analysis – Strength After the DropIn my last week’s TAO analysis, I mentioned that the coin remains bullish, with the $300 zone being an excellent buy area.
Friday’s market-wide crash also hit TAO, but what followed was far more important.
________________________________________
1. Reaction After the Drop
• The decline stopped exactly at the previous support.
• Price quickly recovered the $300 level, turning it back into support.
• That support was retested and held again, confirming its strength.
• Finally, TAO broke above resistance and even made a high above Friday’s top.
________________________________________
2. Outlook
All these are bullish confirmations of strength and resilience.
If the broader market continues to stabilize, TAO could extend its move toward $500, followed by $700 as the next potential target zone.
The outlook stays strongly bullish as long as $300 remains intact.
________________________________________
Conclusion:
TAO continues to outperform and show real momentum.
Support respected, resistance broken, buyers in control. 🚀

Too Early to Buy Solana? Watch the $200–210 ZoneAs mentioned in my general crypto post yesterday, I remain bullish on the broader market and still hold some altcoins at this stage.
However, that doesn’t mean we should jump in blindly, assuming this is it.
Every setup needs confirmation — and Solana is no exception.
At the time of writing, SOL/USD is trading close to my initial entry area, but price action deserves a closer look.
1. What Happened on Friday
The general market sell-off pushed Solana below both a key horizontal support and the lower boundary of its rising channel — a clear bearish technical signal.
After that, we saw a strong recovery into the weekend, with price touching the psychological $200 level overnight before facing some resistance.
2. Current Market Structure
Despite the bounce, the structure remains bearish for now.
A clean stabilization and acceptance above the $200–210 zone would be the first technical sign of a potential trend shift to the upside.
3. Trading Plan
If you’re considering a long position on Solana, I believe it’s too early to enter.
The market looks overconfident in recovery, and when everyone assumes “the bottom is in,” that’s often when a new drop comes.
Wait for confirmation!

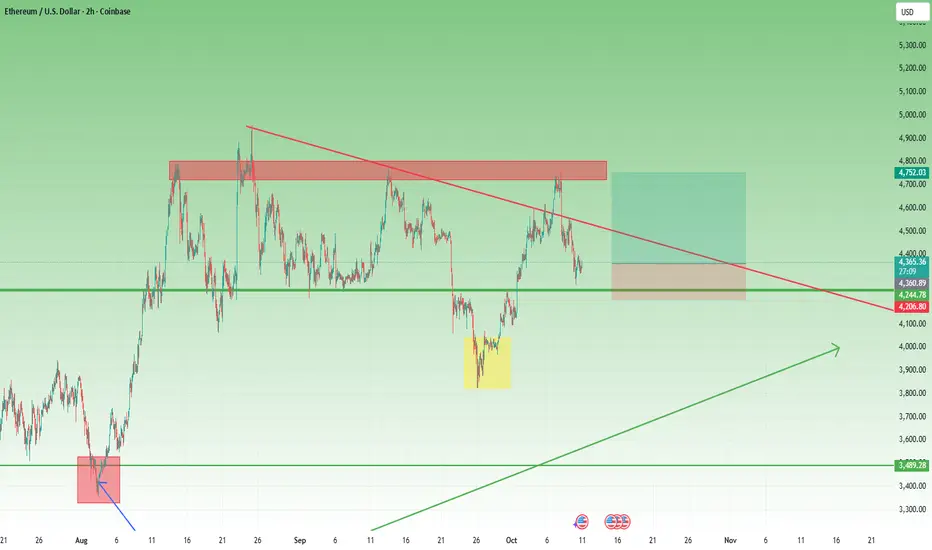
ETH— What the 3500 Support Means and How I’m Trading ItExactly on Friday, just before the big drop, I bought ETH at 4300.
Fortunately, I had a stop loss at 4150, which — of course — got triggered.
But instead of frustration or searching for someone to blame, I took it like a trader should — accepted it, moved forward, and focused on what’s next. Because in trading, maturity starts where ego ends.
Technical Picture
Looking at the chart, after breaking the 4300 support line, ETH accelerated to the downside and found buyers around 3500.
This level is not random — it’s defined by:
1. A major horizontal support
2. The ascending trendline from previous lows
3. And the psychological round number of 3500
Naturally, we saw an initial rebound from that area.
Trading Plan
If the market retests the 3500 zone, I’ll be looking for buying opportunities, targeting a potential retest of 4300.
However — and this is crucial — my trade will be low-volume and protected by a tight stop.
Why? Because while I believe this could be a turning point, so does everyone else.
And when every retail trader sees the same thing, I trade carefully — because as we’ve all learned now, there’s no such thing as free money.
Final Thought
Discipline is not about winning every trade — it’s about staying rational when emotions scream louder than logic.
Bitcoin's drop, opportunity in disguise?Yesterday’s move took me by surprise.
I’ve been bullish on BTC and many altcoins, and without looking for excuses, I didn’t expect what happened last night (mine). The new tariff threats from Trump hit the markets like a hammer, triggering a sharp crypto selloff.
So, the question is — is this the start of a more meaningful drop, or actually an opportunity in disguise?
Looking at Bitcoin’s chart, price broke below the key 118k support zone, almost touching 108k, which I consider the real line in the sand.
In my opinion, bear markets don’t start like this. This drop looks more like a liquidation event — a clean sweep that flushed out weak hands and overleveraged positions.
If BTC dips under 110k again, I’ll be watching closely for buying opportunities. In the short term, at least a recovery toward 118k seems quite probable.

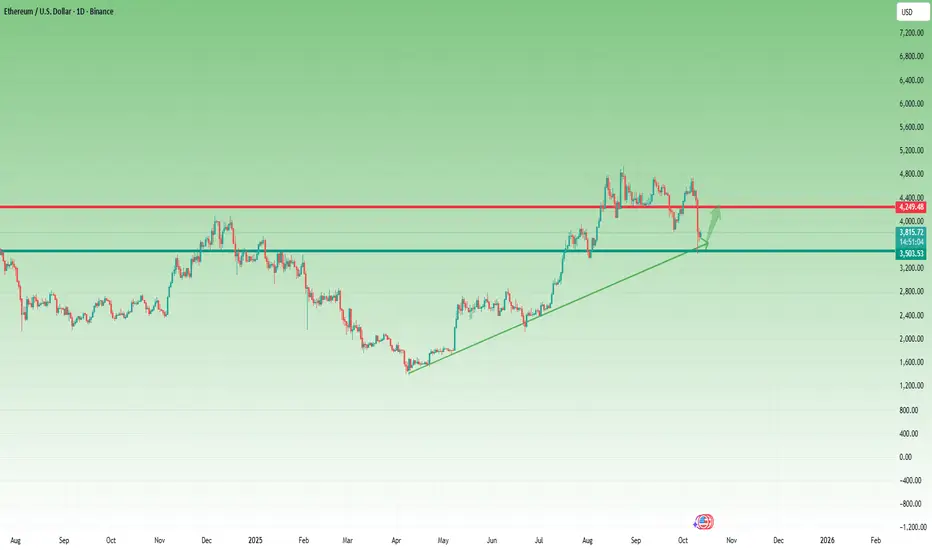
ETH Correction Complete? Bullish Setup Reemerges As I mentioned in my previous ETH analysis, while my medium-term outlook remains bullish, I was anticipating a short-term correction.
That’s exactly what unfolded. After retesting the 4750 resistance zone, Ethereum began to retrace, reaching the support area just below 4300 earlier today.
Currently, the price is rebounding, and there’s a strong probability that the corrective phase has ended.
I’m now looking to re-enter long, as even a move back to the recent highs could offer a 1:2.5 risk–reward setup — a solid short-term opportunity within the broader bullish structure.
New Silver ATH, Sharp Drop, Strong Rebound – What’s Next?Yesterday:
Silver finally made a new All-Time High, a moment that many precious metal traders have been waiting for.
After touching the 51.20 zone, price also experienced a sharp drop, similar to what we saw in Gold.
However — the situation here is notably different.
________________________________________
Key Technical Observations
1. Support Retest, Not Overlap:
The recent drop found support on a horizontal level that acted as strong resistance earlier this week.
Unlike Gold, the structure didn’t overlap — a clear technical advantage.
2. Bullish Structure Intact:
The correction remained above the ascending channel’s support line, meaning Silver never exited its bullish formation — another plus point.
3. Strong Rebound:
At the time of writing, Silver is showing a solid recovery, reclaiming both the 50.00 level and the median line of the channel — a third technical confirmation of strength.
________________________________________
Trading Bias
Unlike Gold, my bias on Silver is bullish in the short term now.
If Gold manages to rebound above 4,000, as I expect in the short term, there’s a high probability that Silver will print a new ATH.
________________________________________
Key Level to Watch
I’ll be watching closely the upper boundary of the channel and yesterday’s high.
Since I’m currently out of the market and late to join the bullish leg, I’ll wait for price action to show its hand.
If signs of weakness appear in that zone, I’ll consider short opportunities, targeting yesterday’s low.
Until then — it’s a wait-and-see approach.
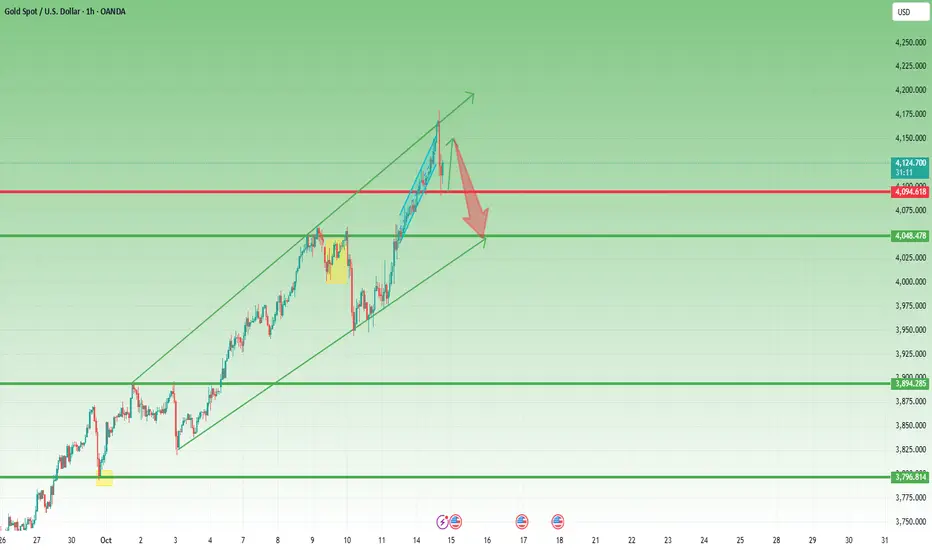
Rebound or Breakdown? Gold Faces the 4K DilemmaYesterday:
After a new test of the 4060 ATH zone, Gold dropped exactly as expected — and as I warned in my recent posts, the move was sharp and decisive, leaving no second chance for traders to reassess.
This leg down measured roughly 1200 pips, finding support around the 3940 zone.
The Key Question: Was That It?
In my opinion — no.
I believe we’re likely to see a second wave of selling soon.
What We See Now
Currently, Gold has formed a double bottom around the 3940 support
Given the still-present bullish sentiment, a short-term rebound toward the 4,000+ area is possible.
Trading Plan
If such a rebound occurs, I see it as an opportunity to sell at better prices, targeting the 3900 zone.
However, I’ll be closely watching the 3940 support, which has held twice already. This could also provide a soft 500+ pips target if I manage to sell above 4k.
P.S.:
There’s also the possibility that Gold fails to rise above 4,000.
In that case, I’ll simply sell from lower levels, following price action confirmation.

Gold: Stretched, Channel Broken, First Real Pullback Next?1️⃣ Overview
Yesterday, Gold reached a new all-time high at 4061, marking the 8th consecutive ATH in 8 days. If we also consider that the yellow metal has been rising for 8 consecutive weeks, the bullish momentum is undeniable.
However, no market can rise indefinitely without pauses. Regardless of how strong the uptrend is, corrections are necessary, and I believe we are very close to one — if not already in it.
________________________________________
2️⃣ Technical Context
After Friday’s low at 3820, Gold traded within an ascending channel, climbing around 2500 pips from bottom to top. This represents roughly a 6% increase, which is quite significant — especially coming after about a 15% rise in the previous 7 weeks.
Now, the channel has been broken, and Gold has entered a small correction toward the 4000 zone. At the time of writing, the market is rebounding, suggesting that bulls have not yet given up.
Still, this rebound looks more like the first sign of exhaustion than renewed strength. Even if bulls manage to push for another all-time high, the market structure is weakening.
________________________________________
3️⃣ Key Zones to Watch
The 4000 level is now the main psychological area and the line in the sand, followed by the 3990 zone, which acts as technical support.
A sustained break below these areas could open the way for a sharper correction toward the 3900 region, which would still only scratch the surface of the broader rally.
________________________________________
4️⃣ Market View
Of course, the bullish trend will remain intact on the medium term, but momentum is stretched, and a cooling phase looks increasingly likely.
I’m currently watching for potential selling points around yesterday’s highs, as the market starts to show its first signs of fatigue after an exceptional run.

GBPUSD – Rebound Sold, Support Under PressureIn a recent analysis, I mentioned that GBPUSD looked ready for a decline, with 1.32 as a potential swing trader’s target. That view remains unchanged — and is now reinforced by the recent price action.
After finding short-term support around 1.3420, the pair rebounded yesterday, but this rebound was quickly sold, sending price back into the support zone.
Typically, this kind of repeated testing and failure to bounce leads to a downside break. Given both the time spent consolidating above support and GBPUSD’s volatile nature, a break below 1.34 could trigger strong acceleration toward the next key level at 1.3330.
This area could provide a valuable opportunity for short-term traders , which is precisely the reason for this update.

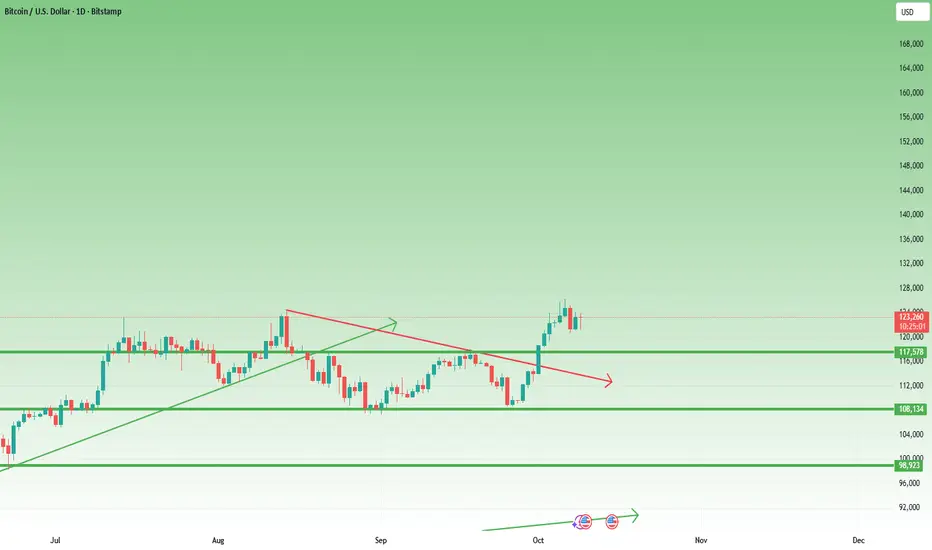
Bitcoin Outlook: Structure Intact, 140K Still on the TableIn my previous BTC analysis, I mentioned that a new all-time high was almost a certainty, with potential for a new leg up toward 140K–150K.
Indeed, BTC delivered — printing a fresh ATH, followed by a short and healthy correction.
At the time of writing, the price has reversed from just above 120K, showing strong demand.
Today’s daily candle displays a long lower tail, a clear sign of buying pressure, and could easily close as a continuation Pin Bar — signaling that bulls are still in control.
Key Zone to Watch
118K support – remains the line in the sand.
As long as this level holds, bulls have no reason for concern and the “buy the dips” strategy stays valid.
Outlook
Momentum remains bullish, structure remains intact, and the path toward 140K stays open — until proven otherwise. 🚀
EURUSD – Support Tested, More Downside ProbableIn my previous EURUSD analysis, I mentioned that there was a strong chance of a break below the 1.17 support zone, targeting 1.16 initially — and possibly even lower to 1.15.
The pair followed the plan perfectly, dropping to 1.16 as expected and currently trading just above this key level.
My outlook remains unchanged: while a short-term rebound from support is possible, it should be seen as a selling opportunity, not a trend reversal. The broader structure still favors further downside.
📊 Resistance: 1.17
📉 Bias: Bearish continuation remains likely

USDCHF – A Slow Mover Showing Big Signs of ReversalAlthough USDCHF is not the most volatile pair out there, it has been on my radar lately — especially after printing a low near 0.78, a level unseen since 2011.
Since June, the overall price action has been suggesting that we are approaching a major bottom. As shown on the daily chart, a falling wedge has developed over the past four months — a pattern that typically signals the end of a downtrend.
If we look closer, there’s even an argument for an inverted Head & Shoulders, with a descending neckline connecting the previous lower highs.
After the latest dip to 0.78, the pair bounced strongly, touched the neckline, and then consolidated for a few sessions — forming what looks like the right shoulder with a higher low structure.
Yesterday, USDCHF finally broke above the falling trendline, confirming the breakout. At this point, the odds favour a medium-term reversal.
• 🎯 First target: 0.8170 zone
• 🚀 Medium-term target: 0.83 area
That being said, my plan is simple:
→ Buy dips near 0.80 or slightly under, aiming for a 1:3 risk-to-reward setup.
The structure looks strong, the momentum shift is visible, and the timing couldn’t be better for a potential reversal.

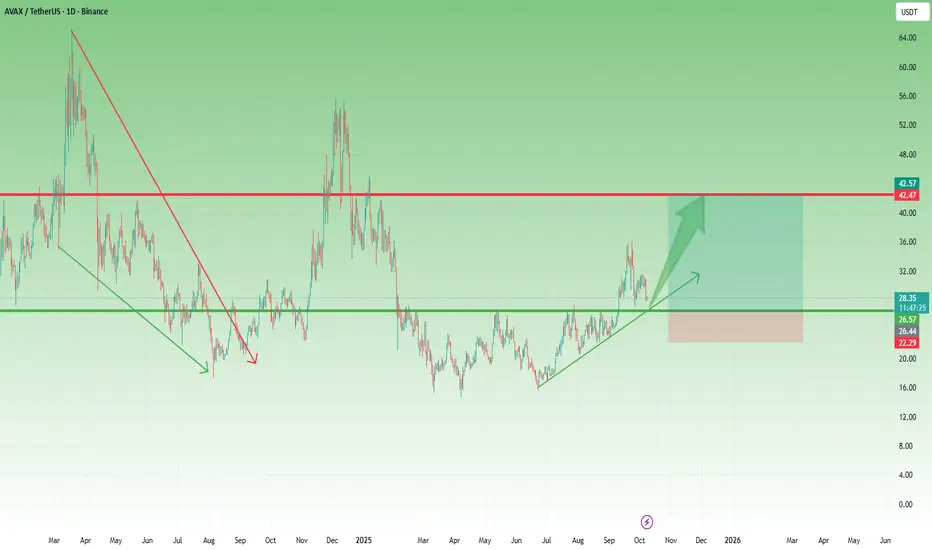
AVAX – Retest in Progress Before the Next Push UpAfter breaking the key resistance zone at $26.60, AVAX surged strongly, reaching a high of $36.60 in one decisive leg up.
Now, the price is pulling back to confirm the breakout, approaching the previous resistance, which could now act as support.
This area represents a confluence zone, aligning with the rising trendline from June, and may serve as a strong accumulation level for bulls preparing for the next upward leg.
From a risk/reward perspective, this setup is also attractive, offering an estimated 1:4 ratio — a solid structure for a technical long entry.
I’m looking to buy around this zone, with expectations for a continuation toward new highs once confirmation appears. 🚀
DXY – The Road to 100 Looks ClearIn my previous analysis on DXY, I mentioned that as long as the 97.60 zone holds, there are strong chances for an upside move and a possible test of the 100 level.
Indeed, the index reversed perfectly from that support area and has now broken above the interim resistance around 98.60, trading close to 99 at the time of writing.
Over the last three sessions, DXY has also completed an inverted Head & Shoulders pattern, with the neckline breakout confirming the bullish structure.
From here, the path toward the 100 zone appears clear and technically justified.
I maintain a bullish bias for the U.S. Dollar Index, which naturally implies a bearish outlook for EURUSD and GBPUSD in the short term.

XAUUSD – No FOMO, No ProblemSince the beginning of October, I’ve argued that a correction in Gold should be next.
However, the market had other plans — this view didn’t materialize, and my three short trades ended with one winner, one break-even, and one stop loss, a big 0 overall...
So, am I upset for missing a 2,000-pip rally? Not at all.
This was a test of acceptance and a reminder that trading correctly matters more than catching every move.
Gold will still be here tomorrow — and if I don’t truly believe in a setup, there’s no reason to enter.
Technically speaking, Gold remains extremely bullish, but every move, no matter how strong, has an end somewhere.
Whether that top comes at 4050, 4100, or even 5000, no one can say with certainty.
For me, it’s simple:
If I don’t have a trade aligned with my conviction, I don’t trade.
As long as the upward channel remains intact, the trend stays bullish.
The key support is now around $4,000, and it will be interesting to see whether this level holds or if Gold will finally enter the much-needed correction phase.
For now, I stay out.
I don’t chase moves I don’t understand, and I don’t FOMO.
Call it caution, or even stupidit y — but a rise without correction is something I simply don’t trust. 🟡

USD/CHF: Bears Defending the TrendlineUSD/CHF continues to respect the descending channel structure that has been in place since mid-August.
After a short-term recovery, the price is now retesting the upper trendline resistance and the 0.8000–0.8020 supply zone, where sellers have previously stepped in.
Technical Outlook
Structure: Descending channel – clear series of lower highs.
Resistance zone: 0.8000–0.8020 (channel top + previous rejection zone).
Support zone: 0.7870–0.7840 (recent demand area).
Moving averages: Both 50 and 100 MAs are flattening but still below the resistance, suggesting limited bullish momentum.
Bias: Bearish below 0.8020 — expecting rejection and continuation to the downside.
Fundamental Context
Recent U.S. data has shown mixed inflation numbers, while Swiss CPI remains stable, reducing expectations for any SNB intervention.
The stronger Swiss franc remains supported by safe-haven flows amid global uncertainty.
Unless the U.S. delivers a clear upside surprise in macro data, the pair is likely to remain under pressure in Q4.
Trade Setup (Not Financial Advice)
Entry zone: 0.79700–0.79800
Stop-loss: 0.8020
Targets:
TP1 → 0.7900
TP2 → 0.7845
🧭 A break below 0.7930 would confirm bearish continuation within the channel.

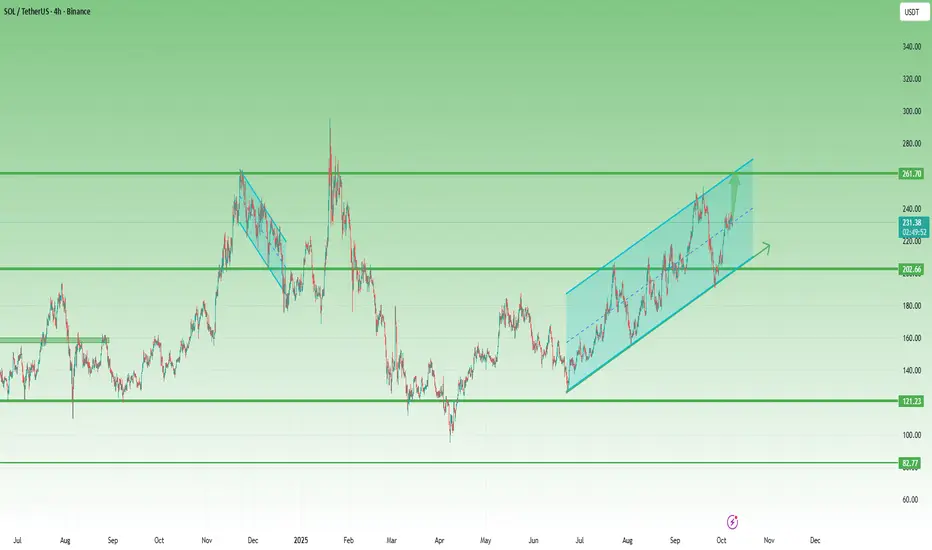
Solana in an Ascending Channel – Bulls Must Hold Above 215After the strong correction from 300 to below 100, Solana finally started to recover. Following an impressive 90% rebound, the price corrected again but managed to form a higher low just above the 120 support zone — a constructive signal for medium-term buyers.
Since then, Solana has been trading inside an ascending channel, showing consistent bullish control with well-defined higher highs and higher lows.
Recently, the market spiked slightly below 200, only to confirm the lower boundary of this channel before bouncing back.
In my previous SOLUSDT analysis, I mentioned that it was imperative for bulls to hold the 200 level to validate the ongoing reversal structure — and that’s exactly what happened. The market respected this support zone perfectly, leading to a 15% advance since then.
At the time of writing, Solana is consolidating near the midline of the ascending channel, suggesting a temporary pause before the next potential leg higher.
If this consolidation breaks to the upside, the next key target for bulls is 260, a confluence resistance formed by the upper boundary of the channel and the November 2024 swing high.
________________________________________
🔹 Summary
• Strong support: 200 (confirmed)
• Ideal bullish threshold: Above 215
• Next resistance: 260 followed by 300
• Structure: Ascending channel – continuation pattern
________________________________________
In conclusion, Solana remains bullish while holding above 200, but ideally, the price should stay above 215 to preserve upside momentum.
A breakout above 240 would likely trigger a test of 260 followed by 300, which becomes very probable— the next key resistance zone. 🚀