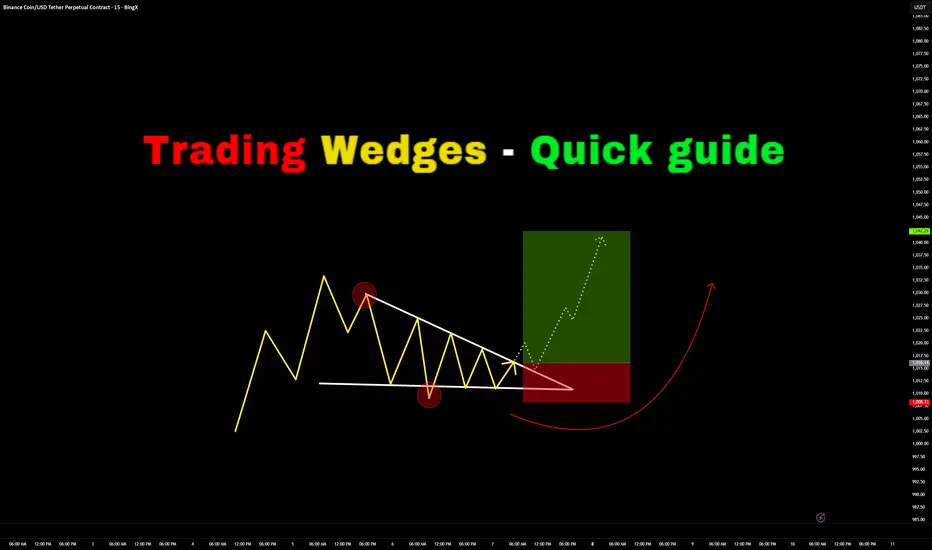
Trading Wedges - Quick Guide in 5 StepsWelcome back everyone to another guide, today we will speed run "Trading wedges" in a quick 5 step guide. Be sure to like, follow and join the community!
1) Identify the wedges:
- Falling Wedge
- Rising Wedge
- Symmetrical Wedge (Triangle)
2) Identify Breakout Direction:
- Falling Wedge > Bullish Breakout Expected
- Rising Wedge > Bearish Breakout Expected
- Symmetrical Wedge (Triangle) > Consolidation Expected
Breakout should show a candle closing outside the wedge.
3) Wait for retest to take place on previous key level or resistance (which would now be support)
If the retest holds with a strong rejection candle or consolidation - begin to long.
4) Enter Trade:
Enter on successful retest confirmation
SL for longs should be below previous low's
SL for shorts should be above previous highs.
5) TP levels:
TP 1) First high target
TP 2) Second high target
TP 3) Third high target.
RESULTS:
Price has soared up high and hit all three Take profits.
For trader who are wanting more profits you can potentially enable TP trailing afterwards - however I don't recommend this as you need to factor in your emotions of "GREED"
Thank you all so much for reading! Hopefully this is a useful guide in the future or present! If you would like me to make any simplified guides, let me know in the comments below or contact me through trading view!
Signals
AUD-CHF Free Signal! Sell!
Hello,Traders!
AUDCHF has tapped directly into a horizontal supply area after sweeping buy-side liquidity above previous highs, forming an SMC distribution setup that favors a corrective move toward the next discount level below.
--------------------
Stop Loss: 0.5374
Take Profit: 0.5331
Entry: 0.5352
Time Frame: 12H
--------------------
Sell!
Comment and subscribe to help us grow!
Check out other forecasts below too!
Disclosure: I am part of Trade Nation's Influencer program and receive a monthly fee for using their TradingView charts in my analysis.

EUR-CAD Bearish Bias! Sell!
Hello,Traders!
EURCAD has broken decisively below the horizontal supply area after sweeping buy-side liquidity and distributing at premium, forming an SMC breakout structure that favors continuation lower toward the next discount target. Time Frame 10H.
Sell!
Comment and subscribe to help us grow!
Check out other forecasts below too!
Disclosure: I am part of Trade Nation's Influencer program and receive a monthly fee for using their TradingView charts in my analysis.

Lingrid | USDJPY Potential Long on Channel BreakoutFX:USDJPY has successfully broken above the descending channel while holding a sequence of higher lows, signaling a structural shift in favor of buyers. The breakout occurred from a former consolidation zone, with price reclaiming and retesting the 155.60–155.70 area, which now acts as short-term support. This confirms acceptance above the trendline and reduces the probability of a deeper pullback.
As long as price remains supported above the rising trendline, bullish momentum remains intact. The recent rejection wicks below support suggest buyers are actively absorbing supply on dips. This sets up a continuation move toward the upper resistance zone around 156.70, where prior selling pressure and liquidity reside.
➡️ Primary scenario: hold above 155.65 → continuation toward 156.70 resistance.
⚠️ Risk scenario: sustained acceptance back below would invalidate the breakout and reopen downside toward 155.00 support.
If this idea resonates with you or you have your own opinion, traders, hit the comments. I’m excited to read your thoughts!

Lingrid | XRPUSDT Sell-Off Possible from Resistance ZoneBINANCE:XRPUSDT continues to trade within a well-defined descending structure, with each rally capped by a sequence of lower highs beneath the falling trendline. The recent upside attempt stalled again inside the 2.14 supply zone, confirming seller dominance and keeping the broader bearish market structure intact. Price action remains compressed under the downtrend resistance, suggesting distribution rather than accumulation.
The local triangle consolidation is forming directly below resistance and within the downward channel, which generally favors resolution to the downside. A rejection from the trendline increases the probability of renewed pressure toward the major support band around 1.80, where the lower channel boundary and horizontal demand align.
➡️ Primary scenario: rejection from the downtrend → continuation 1.80 support.
⚠️ Risk scenario: a clean breakout and acceptance above 2.20 would weaken the bearish structure and open room for a move back toward 2.40.
If this idea resonates with you or you have your own opinion, traders, hit the comments. I’m excited to read your thoughts!

EURNZD FREE SIGNAL|LONG|
✅EURNZD price is reacting from a higher-timeframe demand level after running sell-side liquidity beneath the zone, forming an ICT accumulation footprint that signals a potential shift back toward premium. The rejection wick suggests smart-money absorption before a corrective move higher.
—————————
Entry: 2.0106
Stop Loss: 2.0065
Take Profit: 2.0168
Time Frame: 5H
——————————
LONG🚀
✅Like and subscribe to never miss a new idea!✅

Lingrid | BTCUSDT Potential Bullish Trend Continuation SetupBINANCE:BTCUSDT is holding above the trendline after defending the higher-low zone, keeping the broader bullish structure intact. The recent pullback swept short-term liquidity before price stabilized near the 89,000 support band, where buyers stepped back in. This behavior suggests the move lower was corrective rather than the start of a reversal.
As long as price remains supported above 89,000 and respects the ascending structure, CRYPTOCAP:BTC has room to grind higher toward the upper resistance cluster around the weekly high near 96,000. A successful push through that zone would signal trend continuation, while short-term consolidations along the trendline remain constructive for further upside.
➡️ Primary scenario: higher lows hold → continuation toward 96,000 resistance area.
⚠️ Risk scenario: loss of 89,000 support invalidates the bullish setup and shifts focus back toward deeper support.
If this idea resonates with you or you have your own opinion, traders, hit the comments. I’m excited to read your thoughts!

Lingrid | ZECUSDT Critical $300 Level Test After CorrectionBINANCE:ZECUSDT is stabilizing near the critical psychological $300 area after completing a sharp corrective move from the upper resistance zone. Price has reacted from long-term structural support aligned with the lower channel boundary, suggesting sellers are losing momentum after the extended sell-off. The current rebound signals early demand interest, although the market has not yet confirmed a full trend reversal.
As long as $300 continues to hold, the structure favors a gradual recovery or sideways consolidation before a larger move. A sustained bounce from this zone could push price back toward the broken range and descending trendline, turning the move into a corrective upside leg. However, bulls must reclaim key resistance levels to confirm strength beyond a relief rally.
➡️ Primary scenario: support holds above ~$300 → recovery toward mid-range resistance.
⚠️ Risk scenario: decisive breakdown below $300 invalidates the bullish setup and opens the path to deeper support.
If this idea resonates with you or you have your own opinion, traders, hit the comments. I’m excited to read your thoughts!

BITCOIN Why nobody talks about this??That was the last indicator standing and now it is as clear as it can get. With last month's candle close, Bitcoin (BTCUSD) has confirmed that it has already started a new Bear Cycle.
The reason is simple and it is one of the most basic trading indicators out there. The 1M MACD was already on a Bearish Cross since October, and November's closing widened the gap to such extent that it is not recoverable anymore.
This has happened every time during a BTC Bear Cycle and in two of the past three cases, it took place while already on the Bear Cycle. History has shown that there is no coming back from this and BTC should start looking for the 1M MA50 (blue trend-line) - 1M MA100 (green trend-line) Zone. If all the Bear Cycle indicators we've shown on analyses since September were early signs, the MACD is conclusive and as mentioned, has confirmed it.
But what do you think? Has the MACD Bearish Cross confirmed the new Bear Cycle beyond any doubt? Feel free to let us know in the comments section below!
---
** Please LIKE 👍, FOLLOW ✅, SHARE 🙌 and COMMENT ✍ if you enjoy this idea! Also share your ideas and charts in the comments section below! This is best way to keep it relevant, support us, keep the content here free and allow the idea to reach as many people as possible. **
---
💸💸💸💸💸💸
👇 👇 👇 👇 👇 👇

EUR-USD Wide Demand Area Below! Buy!
Hello,Traders!
EURUSD is retracing into a horizontal demand area after sweeping sell-side liquidity beneath short-term lows, forming an SMC accumulation setup that favors a bounce toward the next buy-side target above. Time Frame 3H.
Buy!
Comment and subscribe to help us grow!
Check out other forecasts below too!
Disclosure: I am part of Trade Nation's Influencer program and receive a monthly fee for using their TradingView charts in my analysis.

AMAZON 's new Bear Cycle targets $125. And it can make you rich.Amazon Inc. (AMZN) has been trading within a massive 24-year Channel Up ever since its October 2001 bottom of the Dotcom crash. This pattern, as you can see, has been following a very distinct structure with its 1M MA100 (green trend-line) being the major Support level (and providing the most efficient buy opportunities) since November 2006.
What stands out here is the period from late 2020 until today and how it resembles the one from late 2003 to late 2007. Both traded under multi-year Higher Highs trend-lines and in October 2007 that formed a Top, causing a 2nd correction within that time-frame that bottomed once it hit the 1M MA100 within the Support Zone of the previous consolidation phase.
Today's fractal has already made the 1st correction in 2022, which not surprisingly also bottomed on the 1M MA100 and kick-started the rally towards the Higher Highs trend-line again. We are now at the point where there are high probabilities that the 2nd correction will take place.
If the market continues to follow the past pattern, we expect Amazon to bottom below the 1M MA100 this time and at the bottom of the Support Zone within the $130.00 - $125.00 range. This will make an ideal Higher Low right at the bottom of the 24-year Channel Up.
So what can make you rich on this? Making a long-term buy of course and keeping it until 2030 - 2032 as the new Bullish Leg that will start, will effectively be the new Bull Cycle. And as this chart shows, these Cycles have had similar rises, with the 'weakest' one being +1037%.
---
** Please LIKE 👍, FOLLOW ✅, SHARE 🙌 and COMMENT ✍ if you enjoy this idea! Also share your ideas and charts in the comments section below! This is best way to keep it relevant, support us, keep the content here free and allow the idea to reach as many people as possible. **
---
💸💸💸💸💸💸
👇 👇 👇 👇 👇 👇

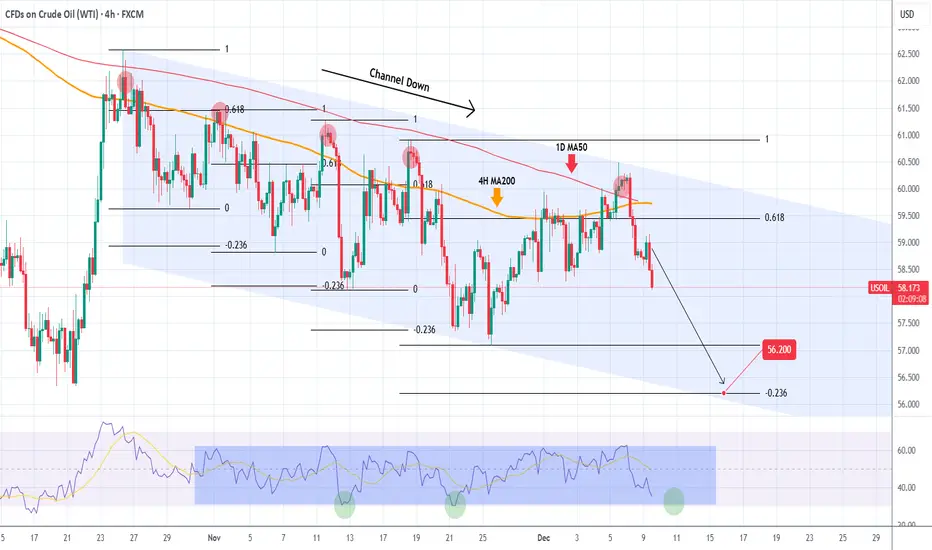
WTI OIL 1.5 month Channel Down started new Bearish Leg.WTI Oil (USOIL) has been trading within a 1.5-month Channel Down (since the October 4 High), that priced last Friday its latest Lower High, this time above the 1D MA50 (red trend-line).
That initiated the new Bearish Leg (also confirmed by the 4H RSI rejection at the top of its range). All 4 previous Bearish Legs bottomed just when the hit the -0.236 Fibonacci extension.
Based on that, we are expecting WTI to make a new Lower Low at 56.200.
---
** Please LIKE 👍, FOLLOW ✅, SHARE 🙌 and COMMENT ✍ if you enjoy this idea! Also share your ideas and charts in the comments section below! This is best way to keep it relevant, support us, keep the content here free and allow the idea to reach as many people as possible. **
---
💸💸💸💸💸💸
👇 👇 👇 👇 👇 👇
GOLD ANALYSIS 12/09/20251. Fundamental Analysis:
a) Economy:
USD:
The USD is moving in a narrow range without strong breakout momentum. Investors expect the Fed to cut rates in upcoming quarters, which weakens the USD’s ability to pressure gold downward. However, when SPDR sells, the supportive effect of a weaker USD on gold diminishes significantly.
U.S. Stocks:
U.S. equities remain in a risk-on state, rising on expectations of tax policy changes and speculative capital rotating back into stocks. This creates short-term downward pressure on gold and opens room for deeper corrective waves.
FED:
The Fed maintains a “data-dependent” stance but leans toward rate cuts if inflation continues to ease. This supports gold in the mid-term, though in the short term, it’s not strong enough to prevent price declines when ETFs are selling.
TRUMP Administration:
Trump’s administration prioritizes tax cuts and support for businesses → bullish for equities.
Conversely, this pressures gold unless geopolitical risks emerge.
Trade-war-style tensions with China still form a background long-term risk that can support gold.
Gold ETF – SPDR:
SPDR has sold lightly for two consecutive sessions, weakening institutional demand.
→ This is an important signal that makes gold more vulnerable and increases the probability of scenario 02 on the chart.
b) Geopolitics:
Tensions in the Red Sea, the Middle East, and Ukraine remain unresolved. While not causing major market shocks, these risks maintain a latent risk-off environment where gold can spike sharply on any negative headline.
c) Market Sentiment:
Market sentiment is currently neutral-to-bearish, making gold more likely to follow a corrective pattern. Traders are waiting for clearer signals from economic data and geopolitics.
2. Technical Analysis:
15-minute timeframe:
Price is hugging the ascending trendline, but selling pressure is dominant.
RSI is in a short-term neutral zone → potential for a minor pullback.
Market structure leans toward breaking support at 4,174 – 4,163 if selling continues.
Two main scenarios:
01 – Technical pullback then continuation down toward 4,193 and a rebound if this level holds.
02 – Deep decline into major accumulation zone (if risk-on strengthens):
• A break below 4,174 opens the path to:
4,147
4,120
→ This is the strongest BUY zone of the day.
RESISTANCE: 4,219 – 4,239 – 4,263
SUPPORT: 4,174 – 4,163 – 4,120
3. Yesterday’s Market (8/12/25):
Gold moved in a narrow sideways range as expected.
No strong bullish momentum due to lack of catalysts.
SPDR’s light selling allowed gold to maintain its upward structure.
Low volume → price action prone to noise and false breaks.
4. Trading Strategy for Today (8/12/25):
🪙 SELL XAUUSD | 4221 – 4219
SL: 4225
TP1: 4213
TP2: 4207
🪙 BUY XAUUSD | 4160 – 4162
SL: 4156
TP1: 4168
TP2: 4174

GBP/USD | Get Ready for a Huge Fall ! (Bearish Move Ahead)By analyzing the #GBPUSD chart on the 4 hour timeframe, we can see that price followed the previous analysis perfectly and rallied more than 200 pips, reaching the 1.338 zone. After that strong move, GBPUSD pulled back and is now trading around 1.33080.
If price breaks below the 1.33050 zone, I expect a much deeper bearish move to follow.
This analysis will be updated soon.
Please support me with your likes and comments to motivate me to share more analysis with you and share your opinion about the possible trend of this chart with me !
Best Regards , Arman Shaban

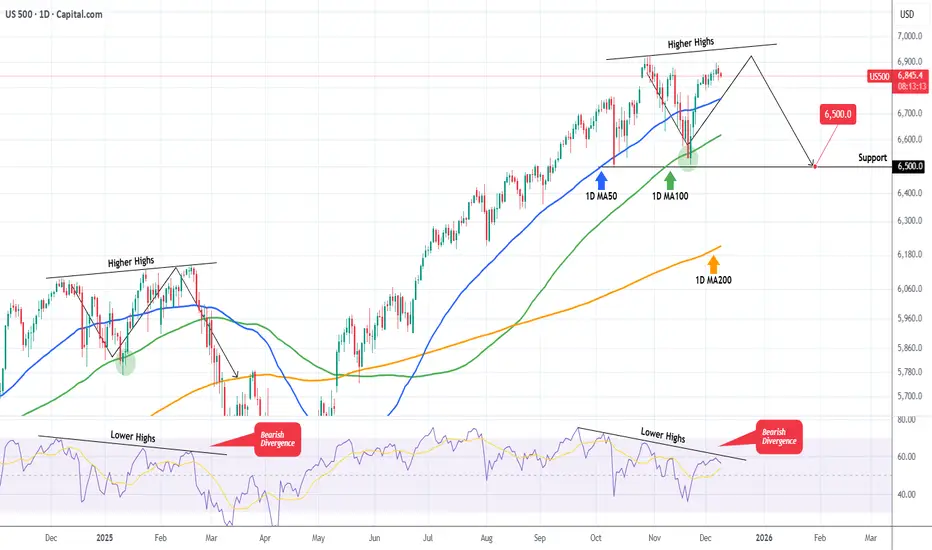
S&P500 The Bearish Divergence that may spoil the party.S&P500 (SPX) is extending a strong rally following the rebound on its 1D MA100 (green trend-line) almost 3 weeks ago. As we pointed out in a previous analysis, the price action of the past 2 months has been identical to the pattern after November 19 2024.
We are currently on the same 1D MA100 rebound towards the Higher Highs trend-line but the key development is that the 1D RSI on both fractals shows a huge Bearish Divergence, being on Lower Highs.
In February 2025 that led to the start of a strong correction in the stock markets. So as long as the 1D RSI Bearish Divergence holds, the S&P500 currently risks a technical correction towards at least the first Support level of 6500.
---
** Please LIKE 👍, FOLLOW ✅, SHARE 🙌 and COMMENT ✍ if you enjoy this idea! Also share your ideas and charts in the comments section below! This is best way to keep it relevant, support us, keep the content here free and allow the idea to reach as many people as possible. **
---
💸💸💸💸💸💸
👇 👇 👇 👇 👇 👇
AUDNZD Will Fall! Short!
Take a look at our analysis for AUDNZD.
Time Frame: 2h
Current Trend: Bearish
Sentiment: Overbought (based on 7-period RSI)
Forecast: Bearish
The market is on a crucial zone of supply 1.149.
The above-mentioned technicals clearly indicate the dominance of sellers on the market. I recommend shorting the instrument, aiming at 1.146 level.
P.S
We determine oversold/overbought condition with RSI indicator.
When it drops below 30 - the market is considered to be oversold.
When it bounces above 70 - the market is considered to be overbought.
Like and subscribe and comment my ideas if you enjoy them!

SILVER Is Very Bearish! Sell!
Please, check our technical outlook for SILVER.
Time Frame: 1h
Current Trend: Bearish
Sentiment: Overbought (based on 7-period RSI)
Forecast: Bearish
The price is testing a key resistance 5,871.4.
Taking into consideration the current market trend & overbought RSI, chances will be high to see a bearish movement to the downside at least to 5,754.1 level.
P.S
Overbought describes a period of time where there has been a significant and consistent upward move in price over a period of time without much pullback.
Like and subscribe and comment my ideas if you enjoy them!

XAUUSD (30m) – Breakdown | Supply Mitigation & Liquidity OutXAUUSD – Bearish Retracement Into Supply (30m)
Price has swept downside liquidity and is now retracing into a premium supply zone. Structure remains bearish, and this move looks corrective rather than impulsive. Watching how price reacts inside the unmitigated supply to confirm continuation.

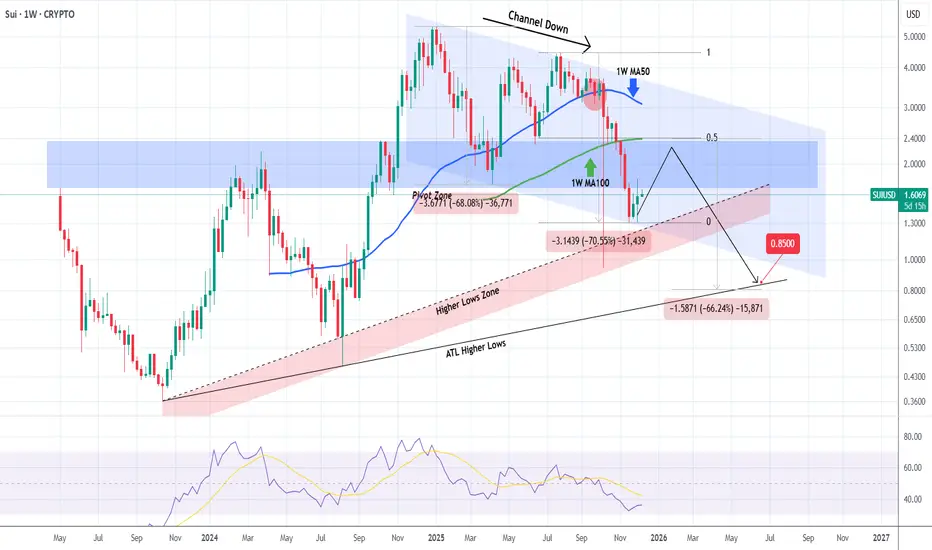
SUIUSD can target $0.85 after this dead-cat bounce is over.A month ago (November 05, see chart below) we gave a strong sell signal on Sui (SUIUSD), targeting 1.4320 right at the bottom of its 1-year Channel Down:
The price made direct contact with the pattern's bottom (thus hitting our Target) and rebounded, pricing a Lower Low. Right now the market is in the process of forming the Bullish Leg of the Channel Up (1W RSI almost got oversold also), which we don't expect to be completed like the previous one as this is a dead-cat bounce at the time, limited by the 1W MA50 (blue trend-line), which is technically the Resistance during Bear Cycles.
The 0.5 Fibonacci retracement level is also at a cluster level were the 1W MA50 could reject this bounce along with the 1W MA100 (green trend-line). We believe that the next Bearish Leg will likely break below the Channel Down and target the All Time Low Higher Lows trend-line around 0.8500, which will be a -66.00% decline from the top, similar to the previous two selling sequences.
---
** Please LIKE 👍, FOLLOW ✅, SHARE 🙌 and COMMENT ✍ if you enjoy this idea! Also share your ideas and charts in the comments section below! This is best way to keep it relevant, support us, keep the content here free and allow the idea to reach as many people as possible. **
---
💸💸💸💸💸💸
👇 👇 👇 👇 👇 👇
XAUUSD (2H) – Structure, Liquidity & Key Zones | SMC BreakdownMarket Structure:
XAUUSD remains in a short-term bearish structure, with repeated BOS and CHoCH points confirming controlled downside. Recent candles show consistent displacement favoring sellers.
Liquidity Grab:
Price has just taken sell-side liquidity beneath the previous swing lows. This sweep pushes the market into a discount region, a typical reaction for smart-money rebalancing.
Key Demand Zone (Reaction Area):
Price is currently testing the 4,153 – 4,182 demand zone, characterized by:
Prior accumulation block
Imbalance fill
Multiple wick rejections signaling buyer sensitivity
How price reacts here will determine the next structural leg.
Upside Imbalances & Supply Zones:
If bullish confirmation forms inside this demand, the next logical price objectives are:
4,210 – 4,230 intraday supply
4,250 – 4,260 higher-timeframe supply
These zones hold unmitigated inefficiencies from previous impulsive moves.
Outlook (Neutral / Analytical):
Although the short-term trend remains bearish, the price is positioned inside a high-value discount zone where reversals often originate. A confirmed CHoCH upward would indicate potential mitigation.
Failure of this zone, however, may lead to continued bearish expansion.

CHFJPY Is Going Down! Short!
Here is our detailed technical review for CHFJPY.
Time Frame: 4h
Current Trend: Bearish
Sentiment: Overbought (based on 7-period RSI)
Forecast: Bearish
The market is trading around a solid horizontal structure 193.700.
The above observations make me that the market will inevitably achieve 192.279 level.
P.S
Please, note that an oversold/overbought condition can last for a long time, and therefore being oversold/overbought doesn't mean a price rally will come soon, or at all.
Like and subscribe and comment my ideas if you enjoy them!

GBPCAD Will Fall! Sell!
Take a look at our analysis for GBPCAD.
Time Frame: 1h
Current Trend: Bearish
Sentiment: Overbought (based on 7-period RSI)
Forecast: Bearish
The market is testing a major horizontal structure 1.846.
Taking into consideration the structure & trend analysis, I believe that the market will reach 1.837 level soon.
P.S
The term oversold refers to a condition where an asset has traded lower in price and has the potential for a price bounce.
Overbought refers to market scenarios where the instrument is traded considerably higher than its fair value. Overvaluation is caused by market sentiments when there is positive news.
Like and subscribe and comment my ideas if you enjoy them!

Lingrid | GOLD Ranging Market Remains in PlayOANDA:XAUUSD continues to rotate between well-defined resistance near 4260–4270 and demand around 4160–4170, confirming a sustained sideways environment. Repeated rejections from the upper boundary and controlled pullbacks suggest neither side has full control yet. The recent A-B-C decline fits a corrective move inside the broader consolidation rather than a trend reversal.
Price is now pressing into the lower range support, aligned with channel border and historical reaction zone. A structural hold here could trigger another rotation higher toward 4,212, while sellers are likely to re-engage near the upper band. Until a decisive breakout occurs, fading the range edges offers the higher-probability setups.
➡️ Primary scenario: hold above 4160 → bounce toward 4,212
⚠️ Risk scenario: clean loss of 4160 shifts focus to deeper downside and range breakdown potential
If this idea resonates with you or you have your own opinion, traders, hit the comments. I’m excited to read your thoughts!
