XAUUSD: Buy low and sell high within the 4230-4160 rangeToday is Wednesday, and whether gold can extend its upward move will depend on a key speech as well as the upcoming ADP employment report. With the absence of the NFP release this month, the ADP report has gained additional importance and is expected to exert a stronger-than-usual market impact.
Yesterday, gold broke below the $4,200 level twice but ultimately closed back above it. During the Asian session today, prices attempted another rally, but encountered resistance near $4,230, suggesting technical pressure at that level. Bullish momentum is weakening, and previously elevated sentiment has become more cautious.
Gold’s current two-way volatility is mainly driven by two factors:
The expected Fed rate cut:
Markets believe the upcoming rate cut may be a hawkish cut, which would offer limited support for gold.
The nomination of the next Federal Reserve Chair:
Trump hinted that Kevin Hassett may be the nominee. Given Hassett’s dovish stance and support for rate cuts, his appointment would be positive for gold and U.S. equities.
However, based on today’s market reaction so far, investors appear unconvinced.
If Trump explicitly confirms Hassett as the nominee, gold could receive stronger upside support.
In my view, before the ADP release and any formal confirmation of the next Fed Chair, gold is likely to remain range-bound between $4,230 and $4,160.
Short positions can be considered near the $4,230 resistance zone
Long positions can be considered near the $4,160 support zone
Once gold breaks out of this range, we will formulate a new trading plan accordingly.
Signals

$TELA, Long, TP>40%NASDAQ:TELA , Long, TP>40%
This stock is interesting.
Choose an entry point and do not forget about a protective order if you are trading with leverage.
Don't risk it if you're not sure.
Good luck to everyone.

DXY is making perhaps the final pull-back before a massive rallyThe U.S. Dollar index (DXY) has been trading within a Channel Up since the March 2008 bottom during the U.S. Housing Crisis. This is not the first time we use this pattern to identify key macro trend shifts, in fact we revisited it a little over 2 months ago.
The incredible symmetry it's been showing, with clear correction phases (red Channels) followed by bullish phases, eventually lead to price rallies to the 1.618 Fibonacci extension.
Right now the price is past a 1W Death Cross, which has always been a bottom signal on this multi-year Channel Up, and is pulling back on perhaps the final mini drop before the new 2-year Bullish Leg begins.
This has always happened at the end of the Bear Cycles (red correction phase) with the Arc pattern showing a final pull-back before the decisive rebound the breaks above the 1W MA50 (blue trend-line). That break-out is the confirmation of the Bull Cycle start (Bullish Leg).
With the 1M RSI having already touched its 16-year Support Zone, which has provided the most optimal Buy Signals throughout this pattern, we expect the Dollar Index to start rising aggressively in the long-term, targeting the 120.000 - 128.000 Zone on its way to the 1.618 Fib ext, which has been where the previous Higher Highs (Cycle Tops) were priced.
Notice also that a solid peak indicator (Sell signal) is when the 1M RSI hits 80.00, indicating that the market is massively overbought (overheated trend).
---
** Please LIKE 👍, FOLLOW ✅, SHARE 🙌 and COMMENT ✍ if you enjoy this idea! Also share your ideas and charts in the comments section below! This is best way to keep it relevant, support us, keep the content here free and allow the idea to reach as many people as possible. **
---
💸💸💸💸💸💸
👇 👇 👇 👇 👇 👇

Lingrid | EURJPY Expecting Retest of Previous Monthly PeakFX:EURJPY perfectly played out my previous trading idea . Price continues to climb along the upward trendline, with the latest higher low confirming that buyers remain in control despite repeated fake breaks within the range. Price is now pressing into the 181.250 resistance band, an area that previously triggered sharp rejections but is now being approached with stronger momentum. The clean respect of trendline support signals sustained bullish intent, and compression beneath resistance often precedes an upside extension.
If buyers maintain pressure, OANDA:EURJPY may break above and extend toward the next resistance near 181.800. A pullback into the 181.000 zone before continuation would be a healthy retest and could offer fresh entry opportunities.
➡️ Primary scenario: continuation from 181.000 → breakout toward 181.800.
⚠️ Risk scenario: a drop below 180.900 weakens bullish structure and exposes deeper retracement toward support.
If this idea resonates with you or you have your own opinion, traders, hit the comments. I’m excited to read your thoughts!

Lingrid | EURUSD Range Breakout Follow ThroughFX:EURUSD is stabilizing above the 1.1590 support after retesting the broken downward trendline, showing that buyers continue to defend the structure. The market remains inside the upward channel, forming another higher low near the trendline intersection, which reinforces the bullish bias. Current price action is compressing under minor intraday resistance, often a signal of energy building for the next leg higher.
If the bullish structure remains intact, FX:EURUSD may attempt a continuation move toward the 1.1640 resistance area, aligned with the upper trendline and key supply zone.
➡️ Primary scenario: continuation toward → 1.1640.
⚠️ Risk scenario: a drop below invalidates the setup and exposes 1.1560 support.
If this idea resonates with you or you have your own opinion, traders, hit the comments. I’m excited to read your thoughts!

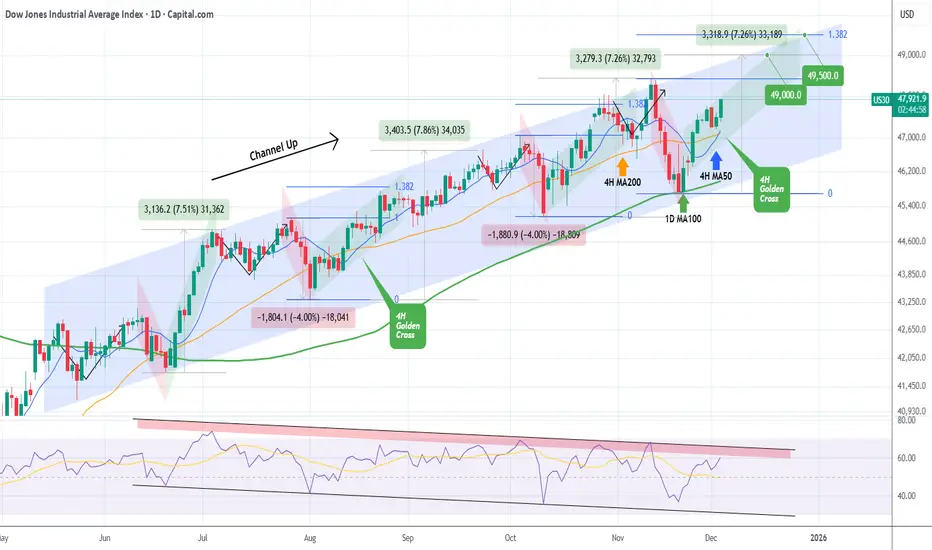
DOW JONES formed its first 4H Golden Cross since August. BullishDow Jones (DJI) has been trading within a 6-month Channel Up and today it formed its first 4H Golden Cross since August 15. Coming off a Higher Low bottom 2 weeks ago on the 1D MA100 (green trend-line), we are currently on the new Bullish Leg of the pattern.
The last one rose by +7.26%, roughly the % amount of the previous two as well, so our immediate Target remains 49000 as we've shown on last weeks analysis.
This time we also see an over-extended Target if the end-of-year rally lasts a bit longer, on the 1.382 Fibonacci extension at 49500, as this level has been hit on every Bullish Leg of this pattern.
If the 1D RSI though hits its Lower Highs Zone (red) earlier, it might be a good idea technically to book profits before those Targets are reached.
---
** Please LIKE 👍, FOLLOW ✅, SHARE 🙌 and COMMENT ✍ if you enjoy this idea! Also share your ideas and charts in the comments section below! This is best way to keep it relevant, support us, keep the content here free and allow the idea to reach as many people as possible. **
---
💸💸💸💸💸💸
👇 👇 👇 👇 👇 👇
GBPCAD RISKY SHORT|
✅GBPCAD price is tapping into a premium supply pocket after a displacement leg, with algorithmic orderflow hinting at a corrective retrace. A clean retest of the imbalance window is likely before any expansion lower toward target liquidity. Time Frame 2H.
SHORT🔥
✅Like and subscribe to never miss a new idea!✅

GBPJPY LOCAL SHORT|
✅GBPJPY is extending into a premium pocket after displacing above the short-term high, and a corrective swing is likely to draw back toward the inefficiency below. I expect a clean retest of the supply rejection before the next leg into the target zone.Time Frame 4H
LONG🚀
✅Like and subscribe to never miss a new idea!✅

GBP-USD Correction Ahead! Sell!
Hello,Traders!
GBPUSD made a nice strong bullish move up and is now pulling back into the mitigation area, where I expect a retest before a correction lower toward the new liquidity pocket.
Sell!
Comment and subscribe to help us grow!
Check out other forecasts below too!
Disclosure: I am part of Trade Nation's Influencer program and receive a monthly fee for using their TradingView charts in my analysis.

BTCUSDT.P - December 4, 2025Bitcoin is in a short‑term uptrend on the 15‑minute chart, respecting a rising trendline from the recent swing low and currently pausing in a shallow pullback after an impulsive advance. Price is trading just above a key support band around 90,500–91,000, with a higher consolidation zone projected near 96,000–97,000 and major resistance and upside target identified in the 113,000 area. A clean bounce from the trendline and a sustained move above 92,000–93,000 would confirm continuation momentum toward the 96,000–97,000 range, while a decisive break below the trendline and 90,500 would invalidate the immediate bullish structure and open room for a deeper retracement toward 88,500–86,500 before any new long setups are considered.

$CAPR, Long, TP>45%NASDAQ:CAPR , Long, TP>45%
For short-term trading, this stock is interesting.
Choose an entry point and do not forget about a protective order if you are trading with leverage.
Don't risk it if you're not sure.
Good luck to everyone.

AUD-USD Bullish Breakout! Buy!
Hello,Traders!
AUDUSD has broken structure above the demand area, clearing nearby liquidity and opening a path for pro-trend continuation toward premium levels. Expect a corrective dip before expansion resumes.Time Frame 4H.
Buy!
Comment and subscribe to help us grow!
Check out other forecasts below too!
Disclosure: I am part of Trade Nation's Influencer program and receive a monthly fee for using their TradingView charts in my analysis.

STRATEGY Mirror crash with 2022 to $60 has started.Michael Saylor won't like this. But the chart is what it is and that's an objective dynamic.
** The 5-year Channel Up and Bear Cycle **
Strategy (MSTR) has been trading within almost a 5-year Channel Up since the February 2021 Top of its previous Cycle. Within this lines, it has had its latest top (Higher High) on the week of November 18 2024 and since then it has been on a structured strong decline.
This decline has gotten even stronger once the price broke below its 1W MA50 (blue trend-line). So far, the 2025 correction is mirroring the 2021 one, which was the start of a 2-year (2021/21) Bear Cycle.
** The three Stages **
Based on that, we have valid reasons to expect that 2026 will also mirror the past Bear Cycle. What stands out on this analysis is that we have classified the whole Bear Cycle into three Stages. Based on that, we have now already entered Stage 2 as the price has broken below its 1W MA50 (and should stay as the Resistance for the remainder of the Cycle) and almost touched its 1W MA200 (orange trend-line). When that happened in January 2022, the market rebounded towards the 1W MA50 where it was rejected and when it broke below the 1W MA200 as well, Stage 3 started. This Stage made the Bear Cycle bottom on the 1M MA250 (red trend-line) after a -90% decline in total. It was completed when the price broke above the 1W MA50 again, essentially confirming the start of the new Bull Cycle.
** Where is the bottom now? **
As a result, we may now see a short-term rebound, limited by the 1W MA50, which after it gets rejected and breaks below the 1W MA200, Stage 3 may start. If this Bear Cycle also crashes by -90%, we should then be expecting a bottom at $60 (at least), supported by the 1M MA250 again.
Notice also the striking symmetry among the 1W RSI patterns of the two Cycle fractals. The 1W RSI has currently hit the 30.00 oversold barrier (similar to Jan 2022) and it was a second break and then a Higher Lows Bullish Divergence that confirmed the bottom of the Bear Cycle, essentially turning Strategy Inc. into a long-term buy opportunity again.
---
** Please LIKE 👍, FOLLOW ✅, SHARE 🙌 and COMMENT ✍ if you enjoy this idea! Also share your ideas and charts in the comments section below! This is best way to keep it relevant, support us, keep the content here free and allow the idea to reach as many people as possible. **
---
💸💸💸💸💸💸
👇 👇 👇 👇 👇 👇

SILVER Will Go Lower From Resistance! Sell!
Please, check our technical outlook for SILVER.
Time Frame: 4h
Current Trend: Bearish
Sentiment: Overbought (based on 7-period RSI)
Forecast: Bearish
The market is testing a major horizontal structure 5,852.3.
Taking into consideration the structure & trend analysis, I believe that the market will reach 5,592.7 level soon.
P.S
Overbought describes a period of time where there has been a significant and consistent upward move in price over a period of time without much pullback.
Like and subscribe and comment my ideas if you enjoy them!

USDCAD Will Go Higher! Buy!
Here is our detailed technical review for USDCAD.
Time Frame: 1h
Current Trend: Bullish
Sentiment: Oversold (based on 7-period RSI)
Forecast: Bullish
The market is approaching a key horizontal level 1.394.
Considering the today's price action, probabilities will be high to see a movement to 1.399.
P.S
Please, note that an oversold/overbought condition can last for a long time, and therefore being oversold/overbought doesn't mean a price rally will come soon, or at all.
Like and subscribe and comment my ideas if you enjoy them!

XLMUSD can drop another -50% before it bottoms.Stellar (XLMUSD) is in the middle of its Bear Cycle and currently consolidating within its 1W MA50 (blue trend-line) - 1W MA200 (orange trend-line) in anticipating of Phase 2 of the Cycle's structure.
As you can see, the dominant pattern since the January 2018 High has been a Triangle, with the recent Cycle Top making direct contact with the Lower Highs trend-line and the bottom with the Higher Lows trend-line.
There is a very high degree of symmetry among those Cycles. Fine example is the 1W RSI, which every time it hit 38.50, the price had always tested the 1W MA200 while on its Bear Cycle and always after breaking below the initial (dashed) Triangle, which is the first pattern post the Bull Cycle Top.
As far as the bottom is concerned, there is obviously the Higher Lows trend-line to consider but at the same time, the 0.786 Fibonacci retracement level can also assist as the previous two Cycle bottoms were priced just above it.
As a result we estimate that this Bear Cycle may bottom around 0.13000 before XLM turns into a long-term buy opportunity again.
---
** Please LIKE 👍, FOLLOW ✅, SHARE 🙌 and COMMENT ✍ if you enjoy this idea! Also share your ideas and charts in the comments section below! This is best way to keep it relevant, support us, keep the content here free and allow the idea to reach as many people as possible. **
---
💸💸💸💸💸💸
👇 👇 👇 👇 👇 👇

GOLD ANALYSIS 13/02/2025Fundamental Analysis:
a) Economy:
• USD:
The USD slightly rebounded after a deep decline due to profit-taking flows during the week, but the broader trend remains weakening as the market expects the FED to keep or cut rates in upcoming meetings, supporting gold.
• US Stock Market:
Wall Street rose slightly; capital is leaning toward risk assets but not strongly. This prevents gold from being heavily sold and helps maintain stable buying momentum.
• FED:
FED officials signal maintaining a stable policy stance, with no signs of rate hikes returning. This continues to support gold in the medium term.
• TRUMP:
The Trump administration is applying trade pressure in multiple regions, creating a certain degree of uncertainty → gold benefits from geopolitical risks.
• Gold ETF (SPDR):
SPDR sold 1.72 tons as a probing move yesterday, showing institutional profit-taking. A negative signal for gold.
b) Politics:
• Geopolitical tensions in the Middle East and several hotspots remain unstable.
• New tensions in Europe regarding energy and borders.
→ These factors support gold in maintaining its upward bias.
c) Market Sentiment:
• The market is in a mild risk-off state, with defensive flows returning after yesterday’s sharp 70-dollar drop.
• Strong dip-buying appeared densely around the support area, causing price to rebound quickly.
• Gold demand in Asia rises during the year-end season, supporting gold.
→ Current sentiment leans toward buying when price corrects.
Technical Analysis:
M15 timeframe:
• Gold sharply flushed 70 dollars down to the support zone at 4,164 and bounced back.
• The bullish structure remains intact, not yet broken.
• MA20 – MA50 are converging, preparing to restore upward momentum.
• RSI bounced from the 30 zone → showing a clear counterattack from buyers.
• The neckline around 4,186 is being retested.
• If it breaks above 4,231 → next targets: 4,274 → 4,320 → 4,380.
→ Overall, the model still signals a continuing uptrend; yesterday’s drop was only a market reset.
→ When gold flushes, do not catch the falling knife, do not chase sells (Sell orders are dangerous because selling comes from panic, buying comes from greed). Wait for price to hit strong support and show bullish signals, then buy strongly. Still captures the move but safely.
RESISTANCE: 4,231 - 4,274 - 4,320
SUPPORT: 4,200 - 4,186 - 4,164
Market Recap (Dec 2):
• Gold dropped sharply by 70 dollars due to profit-taking and thin liquidity in the US session.
• Then it rebounded strongly, proving the uptrend has not been broken.
• SPDR’s probing sell indicates gradual profit-taking near ATH.
Strategy for Today (Dec 3):
🪙 SELL XAUUSD | 4277 – 4275
SL: 4281
TP1: 4269
TP2: 4263
🪙 BUY XAUUSD | 4191 – 4193
SL: 4187
TP1: 4199
TP2: 4205

GOLD breaks out of accumulation phaseOANDA:XAUUSD has moved from a consolidation phase to an active bull run: spot is trading around ~$4,200/oz, supported by expectations of Fed easing (markets are pricing in ~89% probability of a 25bp cut in December), central bank buying and a still uncertain geopolitical backdrop. In this context, a $5,000/oz target is no longer a pipe dream but a conceivable scenario, but only if a number of technical and fundamental conditions align.
Analysis (fundamentals — geopolitics)
1. Fundamentals: Central banks’ net buying (WGC: strong net buying), a weaker USD and falling real Treasury yields are the three fundamentals supporting gold. Recent weak US economic data (weak manufacturing PMI, ADP and PCE potentials reinforce cooling sentiment) push the market to price in higher interest rate cuts, reducing the opportunity cost of holding gold.
2. Geopolitics: Russia-Ukraine negotiations remain uncertain; regional tensions (Middle East, US-Venezuela relations…) maintain safe-haven demand. External shocks could spur rapid and strong demand for gold.
Conditions for the $5,000 scenario (necessary & sufficient)
• Necessary: The Fed makes at least one 25 bps cut in the near term (December) or the market is certain of a rate cut cycle; real yields continue to fall; the USD remains weak; the central bank continues to buy net.
• Sufficient: Price breaks the $4,216–$4,226 resistance zone on higher than average volume, accompanied by a sustained decline in real yields (-real basket) and no sharp reversal in the USD. When all three factors (technical break, real yield decline, sustained official demand) are present, the $5,000 target becomes a trackable possibility in the medium-long term.
Risks
Bear case risks include: the Fed unexpectedly takes a hard/clear stance without cutting, the USD strengthens again (e.g. due to better employment data), or market liquidity declines leading to massive profit-taking by funds. These factors could push gold back below $4,000 and break the short-term bullish structure.
In summary, the journey to $5,000 is a structurally plausible scenario: the macro fundamentals and the official demand flow are tilted to the upside, but that scenario will only be triggered by a volume-driven technical breakout combined with a sustained decline in real yields. I maintain a cautiously positive stance, closely monitoring the underlying geopolitical developments and yield developments to assess the sustainability of this rally.
Technical analysis and recommendations OANDA:XAUUSD
Gold price is maintaining a clear bullish structure as it continues to follow the medium-term rising channel and holds the important support zone around 4,128 – 4,130 USD/ounce (Fibo 0.236). The price continuously making higher lows and bouncing back above the short-term MA shows that active buying power is still dominant. The most recent candlestick pattern shows strong absorption at the support zone, implying that money flow is protecting the uptrend.
With no break below 3,973 USD/ounce (Fibo 0.382), the bullish structure continues to be consolidated. The next target of the current cycle is 4,300 – 4,380 USD/ounce, corresponding to the top of the rising channel and the extended Fibo zone. RSI is recovering from the neutral zone, showing that the upside momentum still has room to grow.
SELL XAUUSD PRICE 4277 - 4275⚡️
↠↠ Stop Loss 4281
→Take Profit 1 4269
↨
→Take Profit 2 4263
BUY XAUUSD PRICE 4191 - 4193⚡️
↠↠ Stop Loss 4187
→Take Profit 1 4199
↨
→Take Profit 2 4205

ZakopiecFX GOLD XAUUSD TodayXAU/USD Gold Analysis - December 3, 2024
Current Price: Around $2,626-2,630
Intraday Range: $2,606 - $2,656
Technical Analysis
Bearish Signals:
Technical patterns show an Evening Star reversal formation near the resistance level around $2,655, along with a Hanging Man pattern around $2,630, both suggesting a potential price reversal. The MACD indicator has crossed below the signal line and is declining in negative territory, indicating fading bullish momentum. The RSI is also declining around 57, suggesting potential downward movement.
Key Support Levels:
$2,602
$2,557
$2,514
$2,460
$2,406
$2,352
$2,294
$2,220
Key Resistance Levels:
$2,645-$2,650 represents a strong barrier
Further resistance at $2,664-$2,665
$2,677-$2,678
Trading Scenarios
Base Scenario (Bearish):
Short positions below $2,602 with targets at $2,557, $2,514, and lower levels. Stop loss should be placed around $2,630.
Alternative Scenario (Bullish):
Long positions above $2,655 on increased volume, targeting $2,714, $2,774, $2,841, and higher levels. Stop loss around $2,630.
Fundamental Factors
Market Drivers:
Growing expectations of a Federal Reserve interest rate cut in December are supporting gold prices
Markets are pricing in approximately 64% chance of a December Fed rate cut
Geopolitical uncertainties and central bank demand continue supporting the precious metal
Upcoming Events:
Today: November services PMI data
Dec 4: Initial jobless claims
Dec 10: US CPI data and Fed interest rate decision
Market Sentiment
Gold is consolidating near current levels with mixed signals. While technical indicators suggest potential downside pressure in the short term, strong fundamental support from Fed rate cut expectations and safe-haven demand could limit significant declines. The market is showing uncertainty, with key moving averages near current price levels suggesting a decision point is approaching.
Trading Recommendation: Wait for a clear break above $2,655 for bullish continuation or below $2,602 for bearish movement before entering positions. Given the mixed signals, risk management is crucial.
DISCLAIMER: This analysis is for informational purposes only and should not be considered financial advice. Trading in financial instruments involves significant risk, including the potential loss of principal. Past performance does not guarantee future results. Market conditions can change rapidly, and the information provided may not reflect real-time market movements. Always conduct your own research and consider consulting with a qualified financial advisor before making any investment decisions. The author is not a financial advisor and assumes no responsibility for any investment decisions made based on this analysis.

USDCHF Will Go Up! Long!
Take a look at our analysis for USDCHF.
Time Frame: 4h
Current Trend: Bullish
Sentiment: Oversold (based on 7-period RSI)
Forecast: Bullish
The market is approaching a significant support area 0.801.
The underlined horizontal cluster clearly indicates a highly probable bullish movement with target 0.805 level.
P.S
The term oversold refers to a condition where an asset has traded lower in price and has the potential for a price bounce.
Overbought refers to market scenarios where the instrument is traded considerably higher than its fair value. Overvaluation is caused by market sentiments when there is positive news.
Like and subscribe and comment my ideas if you enjoy them!

AUDUSD Will Move Lower! Short!
Please, check our technical outlook for AUDUSD.
Time Frame: 1h
Current Trend: Bearish
Sentiment: Overbought (based on 7-period RSI)
Forecast: Bearish
The market is on a crucial zone of supply 0.657.
Taking into consideration the current market trend & overbought RSI, chances will be high to see a bearish movement to the downside at least to 0.656 level.
P.S
We determine oversold/overbought condition with RSI indicator.
When it drops below 30 - the market is considered to be oversold.
When it bounces above 70 - the market is considered to be overbought.
Like and subscribe and comment my ideas if you enjoy them!

Lingrid | GOLD Pullback Trading Opportunity from Support ZoneOANDA:XAUUSD is retracing into the 4,190–4,200 support band after an extended bullish run within the upward channel. The broader structure remains firmly bullish, with higher lows and higher highs forming along the rising trendline and each dip being absorbed by buyers. Price is now testing zone below the previous-day low, creating a classic buy pullback setup inside a continuation trend.
If TVC:GOLD stabilizes above the trendline and reclaims intraday momentum, the next upside rotation could drive the metal toward the 4,290 resistance shelf, aligned with the higher boundary of the channel. Maintaining support above 4,190 keeps the bullish sequence intact and favors further acceleration.
➡️ Primary scenario: pullback holds above 4,190 → continuation toward 4,290.
⚠️ Risk scenario: a clean break below channel exposes 4,100 and delays bullish continuation.
If this idea resonates with you or you have your own opinion, traders, hit the comments. I’m excited to read your thoughts!

Lingrid | SOLUSDT Initial Major Resistance Zone After Price DropBINANCE:SOLUSDT is climbing toward the 150–155 resistance cluster, where the downward channel’s trendline, horizontal supply, and the local upward trendline all converge. Despite the recent bounce, the broader structure remains bearish, with multiple lower highs and no confirmed reversal—suggesting the move up is more corrective than structural. The compression seen before the breakout and the sharp recovery both reflect liquidity-driven retracements rather than a trend change.
If price stalls at this confluence zone, sellers may regain control and drive the market back toward 133, followed by the deeper support pocket, which aligns with the mid-channel and the established buying area. Until CRYPTOCAP:SOL breaks and sustains above the channel, bullish continuation remains unconfirmed.
➡️ Primary scenario: rejection from 150–155 → continuation toward 133.
⚠️ Risk scenario: a clean break and close above 155 invalidates the short thesis.
If this idea resonates with you or you have your own opinion, traders, hit the comments. I’m excited to read your thoughts!
