Big Moves Ahead? DXY, EUR/USD & Gold at Crucial LevelsLadies and gentlemen, there was a time when forex was full of trading opportunities... to the point where most people struggled with overtrading. But these days, you need a solid watchlist to even find positions, and that's where Skeptic Lab comes in—it's a great spot for spotting good opportunities. So without further ado, let's dive into the analysis of DXY , or the dollar index.
💲 In the daily timeframe , after the drop it had, it's entered a consolidation box, and it looks like we're nearing the end of that box. The main long trigger is a break of 100.262 from a technical standpoint, but personally, after the break of 99.850, I'm already positioned on one of the USD symbols. In lower timeframes, plus the fact that breaking the ceiling of consolidations is usually not straightforward and comes with a lot of volatility, so it's better to have a pre-breakout position.
💶Let's head over to EURX in the 4H timeframe —we've had a good reaction at the 1085.9 support. Breaking it would be a great trigger if you want a EURUSD position.
Speaking of EURUSD , it's already entered a secondary bearish trend after breaking its daily trend line. If the DXY consolidation box breaks, EURUSD will officially change its HWC trend to bearish. The position I mentioned at the start of the analysis—I opened it with the break of that same daily EURUSD trend line. The key level for profit-taking will be 1.14640. I'll wait to see what reaction DXY gives—if it fakes the box break, I'll close the position; if not, I'll leave it open for now.
🪙But let's move on to gold —the commodity I'm eyeing today for opening a position. From a technical perspective, it's at a spot that gives both short and long triggers... let me explain.
In the daily timeframe, we had a strong uptrend rally that, after reaching 4377.67 , entered its secondary corrective trend. In the 4H timeframe, what's interesting is the formation of these range boxes we're seeing. So our long and short triggers are clear: break of the box ceiling = long / break of the box floor = short.
But the thing is, the targets are the same... see, opening a short here basically means going along with the secondary trend, so? Your expectations should be relative to this leg, not the weekly one... so it's better to take your targets quicker, like 3896.31 (the 0.38 fib intersection), which could be a good target. Plus, each bearish leg is weaker than the previous one, so the point I mentioned makes sense for the target.
For longs, though, you can proceed with partial profits and not close too early. Alright, that's it. Now get outta here.
Signals

SILVER Will Go Higher! Long!
Take a look at our analysis for SILVER.
Time Frame: 1D
Current Trend: Bullish
Sentiment: Oversold (based on 7-period RSI)
Forecast: Bullish
The market is approaching a key horizontal level 4,796.6.
Considering the today's price action, probabilities will be high to see a movement to 5,274.4.
P.S
Overbought describes a period of time where there has been a significant and consistent upward move in price over a period of time without much pullback.
Like and subscribe and comment my ideas if you enjoy them!

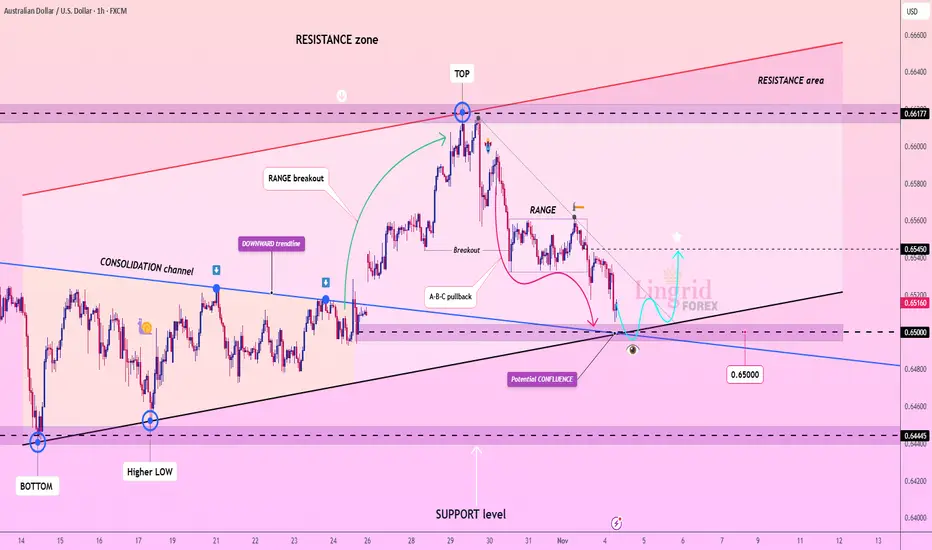
AUDUSD Will Go Up! Buy!
Please, check our technical outlook for AUDUSD.
Time Frame: 3h
Current Trend: Bullish
Sentiment: Oversold (based on 7-period RSI)
Forecast: Bullish
The market is approaching a significant support area 0.650.
The underlined horizontal cluster clearly indicates a highly probable bullish movement with target 0.654 level.
P.S
Please, note that an oversold/overbought condition can last for a long time, and therefore being oversold/overbought doesn't mean a price rally will come soon, or at all.
Like and subscribe and comment my ideas if you enjoy them!

GBPCHF Is Bullish! Long!
Take a look at our analysis for GBPCHF.
Time Frame: 3h
Current Trend: Bullish
Sentiment: Oversold (based on 7-period RSI)
Forecast: Bullish
The price is testing a key support 1.056.
Current market trend & oversold RSI makes me think that buyers will push the price. I will anticipate a bullish movement at least to 1.059 level.
P.S
We determine oversold/overbought condition with RSI indicator.
When it drops below 30 - the market is considered to be oversold.
When it bounces above 70 - the market is considered to be overbought.
Like and subscribe and comment my ideas if you enjoy them!

Silver Turns Bearish Again – Watch 47.50 Support CloselyPretty similar to Gold, Silver also failed to break above resistance yesterday and started to roll back down.
A few hours ago, the price touched short-term support and is now seeing a minor rebound.
However, the structure has clearly turned bearish, with lower highs confirming momentum exhaustion.
If 47.50 support breaks, a visit to 45.50 becomes highly probable — and even a test of the psychological 45.00 level shouldn’t be ruled out.
My strategy is to sell rallies, ideally near intraday resistance, following the medium-term bearish bias.

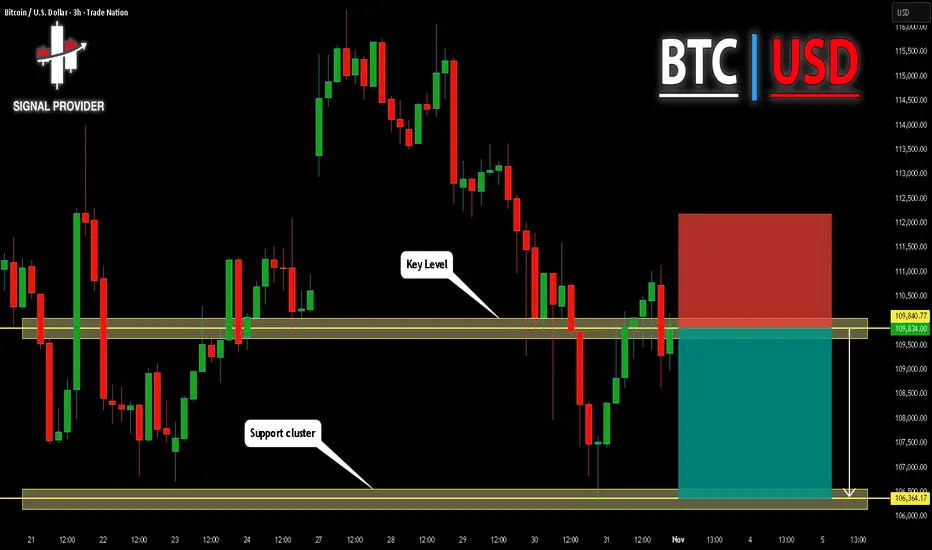
BITCOIN Will Go Down! Sell!
Please, check our technical outlook for BITCOIN.
Time Frame: 3h
Current Trend: Bearish
Sentiment: Overbought (based on 7-period RSI)
Forecast: Bearish
The market is trading around a solid horizontal structure 109,840.77.
The above observations make me that the market will inevitably achieve 106,364.17 level.
P.S
The term oversold refers to a condition where an asset has traded lower in price and has the potential for a price bounce.
Overbought refers to market scenarios where the instrument is traded considerably higher than its fair value. Overvaluation is caused by market sentiments when there is positive news.
Like and subscribe and comment my ideas if you enjoy them!
Lingrid | AUDUSD Psychological Support Long OpportunityThe price perfectly fulfilled my previous idea . FX:AUDUSD is testing the confluence support near 0.6500 after retracing from the 0.6617 resistance zone. Price action forms an A-B-C pullback pattern within a consolidation channel, suggesting the potential for a short-term rebound. Holding above 0.6500 could attract buyers aiming for 0.6545 resistance. Broader momentum supports a mild bullish recovery as long as this level remains intact.
⚠️ Risks:
Unexpected hawkish tone from the Federal Reserve could strengthen USD and cap recovery.
Weak Australian trade or employment data may renew downside pressure.
A sharp drop in commodity prices could undermine AUD sentiment.
If this idea resonates with you or you have your own opinion, traders, hit the comments. I’m excited to read your thoughts!
DASHUSDT.P - November 4, 2025DASHUSDT.P is exhibiting a strong corrective rebound within a prolonged downtrend, with price approaching the $207.29–$407.47 zone marked for short entries. The setup anticipates a potential rejection from this resistance area, targeting $48.40 for partial profit and $21.22 as the final objective. The stop loss is positioned above $603.93, defining the invalidation level. A sustained move below $48.40 would confirm renewed bearish momentum, while a breakout above $603.93 would negate the short setup.
Risk Assessment: High risk — the trade relies on rejection from major resistance after an aggressive upside move, but the wide stop zone provides flexibility against volatility.

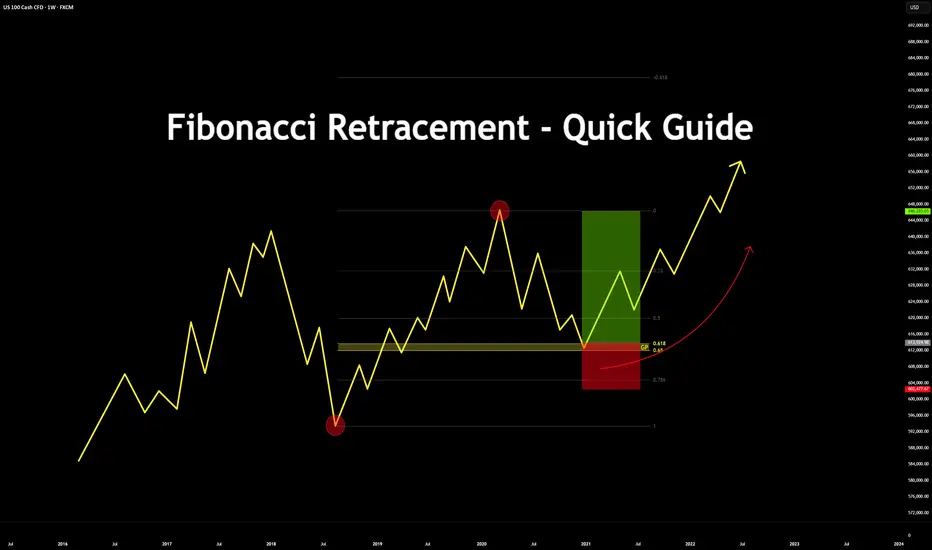
Fibonacci Retracement - Quick Guide in 5 StepsTrading the Fibonacci Retracement - Quick Guide in 5 Steps.
What is the Fibonacci tool?
The Fib Retracement Tool is a tool used widely across many charts. From crypto to stocks.
It assists in identifying the Golden Pocket, along with any potential Support and Resistance zones based on the sequence in Fibonacci.
Investors & Traders draw it from a previous high/low or low/high.
On a chart, each key level shows where price might pause or reverse during a pull back, before it continues the trend.
In this guide you will learn how to use the Fibonacci tool in 5 steps.
1. Configurations
Open up your Fib Retracement Tool's settings, apply the below configurations.
(You can change the color to your choice)
2. Identify High/Low's
Identify, recent highs and lows of your current chart/pair.
3. Applying Fib Retracement
Select your Fib Retracement tool. Place it on your chart starting from the swing low to the swing high.
4. Once completed
Highlight the Golden Pocket Field in the zone (0.65-0.618)
5. Review Entry
Price will eventually make it's way back down to the Golden Pocket to retest and reverse.
SL Placement would be on a previous low or key level, TP placement would be at a previous high or key level.
Bonus:
See the real time example below:
Please like, comment and follow if this guide was useful to you.
If you have any requests on analysis or tutorial requests, let me know and I'll be happy to make one!
EUR/USD-Nov 3, 2025Latest performance of the EUR/USD currency pair:
It remains under pressure, down for the fourth consecutive day, and it is hovering near the key support level of around 1.1500.
If that level breaks, there could be further downside toward 1.1400 or even lower levels.
The US Dollar is strong, supported by rising US Treasury yields and reduced expectations of Fed rate cuts.
Technical indicators like the RSI and ADX suggest further downside risks and a strengthening trend.
The overall sentiment is bearish for EUR/USD.

ETHEREUM BEARISH BREAKOUT|SHORT|
✅ETHUSD after a clean breakout below the supply level, ETH shows bearish order flow with potential continuation toward 3520$. Price may retest imbalance before expansion to downside. Time Frame 2H.
SHORT🔥
✅Like and subscribe to never miss a new idea!✅

NATGAS Will Keep Growing! Buy!
Hello,Traders!
NATGAS Price has broken out above the horizontal demand area with strong momentum, confirming bullish order flow. A clean displacement shows potential continuation toward the 4.50$ target zone. Time Frame 5H.
Buy!
Comment and subscribe to help us grow!
Check out other forecasts below too!
Disclosure: I am part of Trade Nation's Influencer program and receive a monthly fee for using their TradingView charts in my analysis.

GOLD LOCAL SHORT|
✅XAUUSD Price has tapped into a strong supply level and is expected to retest it soon before continuing lower. Liquidity above recent highs has been taken, suggesting bearish delivery toward 3980$. Time Frame 2H.
SHORT🔥
✅Like and subscribe to never miss a new idea!✅

AUD-JPY Free Signal! Sell!
Hello,Traders!
AUDJPY recent break below structure and rejection from double-top premium zone confirms bearish order flow. Retrace into broken trendline acts as mitigation before expansion lower toward discount levels.
-------------------
Stop Loss: 101.230
Take Profit: 100.406
Entry: 100.830
Time Frame: 3H
-------------------
Sell!
Comment and subscribe to help us grow!
Check out other forecasts below too!
Disclosure: I am part of Trade Nation's Influencer program and receive a monthly fee for using their TradingView charts in my analysis.

APPLE First correction signals in 7 months start to emerge.Almost 1.5 month ago (September 19, see chart below), we gave a buy signal on Apple Inc. (AAPL), which recently hit our $273 Target:
This time we go back to our long-term perspective and view Apple on the 1W time-frame, as the Bullish Leg (green) since the April 07 bottom, is approaching the top (Higher Highs trend-line) of the 4-year Channel Up.
The previous Bullish Leg peaked just below the 1.236 Fibonacci extension, so we can't rule out one final push to round $285 but on the long-term, a technical pull-back is favored.
The 2023 Bullish Leg eventually corrected on the 1W MA50 (blue trend-line), hitting its 0.382 Fibonacci retracement level at the same time. Even the smaller April - July 2024 Leg pulled-back to he 0.5 Fib.
All of those Channel Up tops have been also met with a 1W RSI break above the 70.00 oversold level, which is something that hasn't taken place yet. Similarly the 1W MACD hasn't started to reverse on the levels of most of previous tops.
In any case, we expect to see Apple hitting $236 at least on the long-term, which is its 0.382 Fib and marginally below the 1W MA50.
-------------------------------------------------------------------------------
** Please LIKE 👍, FOLLOW ✅, SHARE 🙌 and COMMENT ✍ if you enjoy this idea! Also share your ideas and charts in the comments section below! This is best way to keep it relevant, support us, keep the content here free and allow the idea to reach as many people as possible. **
-------------------------------------------------------------------------------
💸💸💸💸💸💸
👇 👇 👇 👇 👇 👇

XAUUSD Bear Cycle has started and this is why according to VIX.Gold (XAUUSD) closed 2 straight red weeks, which last did on June 23. Despite this pull-back, it remains within a Channel Up since the October 31 2022 Low, which was essentially when the Bear Cycle ended and the new Bull Cycle (Channel Up) started.
The previous Bull Cycle topped around 4.5 months after the Volatility Index (VIX) shown in blue, peaked during the March 2020 COVID flash crash.
We are now on a similar situation as VIX topped on the week of March 31 2025 during the Trade War and has since started to decline aggressively. Gold's current top was 6.5 months after VIX's top. Even the 1W RSI sequences between the two Bull Cycles are similar, further raising the degree of their high symmetry.
According to this correlation, Gold may has already formed its Bull Cycle Top 3 weeks ago and could be starting a new +2 year Bear Cycle.
As far as a Target and Bottom is concerned, the previous Bear Cycle almost hit its 0.382 Fibonacci retracement level three times throughout the Cycle, until it broke below it marginally for its September - October 2022 bottom.
As a result, we are looking for the 0.382 Fib yet again as our focal point which is currently around $3000.
-------------------------------------------------------------------------------
** Please LIKE 👍, FOLLOW ✅, SHARE 🙌 and COMMENT ✍ if you enjoy this idea! Also share your ideas and charts in the comments section below! This is best way to keep it relevant, support us, keep the content here free and allow the idea to reach as many people as possible. **
-------------------------------------------------------------------------------
💸💸💸💸💸💸
👇 👇 👇 👇 👇 👇

CHFJPY FREE SIGNAL|LONG|
✅CHFJPY Price has tapped into a clean demand level, suggesting bullish order flow resuming to fill imbalance toward the upper target. A push above internal liquidity is expected soon.
———————————
Entry: 190.942
Stop Loss: 190.496
Take Profit: 191.500
Time Frame: 2H
———————————
LONG🚀
✅Like and subscribe to never miss a new idea!✅

EUR-CAD Local Short! Sell!
Hello,Traders!
EURCAD Price is reacting from a horizontal supply area after a corrective push upward. Smart money may seek liquidity below the previous lows before the next structural decision. Time Frame 2H.
Sell!
Comment and subscribe to help us grow!
Check out other forecasts below too!
Disclosure: I am part of Trade Nation's Influencer program and receive a monthly fee for using their TradingView charts in my analysis.

EURAUD WILL GO UP|LONG|
✅EURAUD Price reacted strongly from the demand zone, forming a clean displacement structure. Bulls may aim for short-term liquidity above minor highs before any potential retracement. Time Frame 4H.
LONG🚀
✅Like and subscribe to never miss a new idea!✅

GBP-USD Bearish Bias! Sell!
Hello,Traders!
GBPUSD Price continues its bearish structure after rejecting from the horizontal supply area. Smart money is targeting the liquidity resting below the recent swing lows. Time Frame 5H.
Sell!
Comment and subscribe to help us grow!
Check out other forecasts below too!
Disclosure: I am part of Trade Nation's Influencer program and receive a monthly fee for using their TradingView charts in my analysis.

NASDAQ Channel Up still stands buy needs a pull-back.Nasdaq (NDX) reached the top of its 5-month Channel Up and got rejected. It completed a +9.59% rise from the last 1D MA50 (red trend-line) bottom (Higher Low for the pattern), similar to the previous Bullish Leg.
The maximum a Bullish Leg has increased by inside this pattern is +10.87%. As a result, either now or just above it, the pattern would require a technical pull-back. The most usual buy signal is on its 4H MA200 (orange trend-line) and the most effective when the 4H RSI breaks below its oversold (30.00) barrier.
Our next Buy Zone is within the 0.382 - 0.5 Fibonacci retracement range.
-------------------------------------------------------------------------------
** Please LIKE 👍, FOLLOW ✅, SHARE 🙌 and COMMENT ✍ if you enjoy this idea! Also share your ideas and charts in the comments section below! This is best way to keep it relevant, support us, keep the content here free and allow the idea to reach as many people as possible. **
-------------------------------------------------------------------------------
💸💸💸💸💸💸
👇 👇 👇 👇 👇 👇

USOIL Is Very Bullish! Buy!
Please, check our technical outlook for USOIL.
Time Frame: 6h
Current Trend: Bullish
Sentiment: Oversold (based on 7-period RSI)
Forecast: Bullish
The market is trading around a solid horizontal structure 60.808.
The above observations make me that the market will inevitably achieve 62.277 level.
P.S
Overbought describes a period of time where there has been a significant and consistent upward move in price over a period of time without much pullback.
Like and subscribe and comment my ideas if you enjoy them!

USDCHF Is Going Down! Short!
Here is our detailed technical review for USDCHF.
Time Frame: 1D
Current Trend: Bearish
Sentiment: Overbought (based on 7-period RSI)
Forecast: Bearish
The market is testing a major horizontal structure 0.807.
Taking into consideration the structure & trend analysis, I believe that the market will reach 0.797 level soon.
P.S
Please, note that an oversold/overbought condition can last for a long time, and therefore being oversold/overbought doesn't mean a price rally will come soon, or at all.
Like and subscribe and comment my ideas if you enjoy them!
