BITCOIN Will Go Higher! Long!
Please, check our technical outlook for BITCOIN.
Time Frame: 1D
Current Trend: Bullish
Sentiment: Oversold (based on 7-period RSI)
Forecast: Bullish
The market is approaching a significant support area 116,693.38.
The underlined horizontal cluster clearly indicates a highly probable bullish movement with target 123,791.64 level.
P.S
Please, note that an oversold/overbought condition can last for a long time, and therefore being oversold/overbought doesn't mean a price rally will come soon, or at all.
Like and subscribe and comment my ideas if you enjoy them!
Signals

EURJPY Will Go Down! Short!
Here is our detailed technical review for EURJPY.
Time Frame: 9h
Current Trend: Bearish
Sentiment: Overbought (based on 7-period RSI)
Forecast: Bearish
The market is on a crucial zone of supply 175.665.
The above-mentioned technicals clearly indicate the dominance of sellers on the market. I recommend shorting the instrument, aiming at 174.179 level.
P.S
The term oversold refers to a condition where an asset has traded lower in price and has the potential for a price bounce.
Overbought refers to market scenarios where the instrument is traded considerably higher than its fair value. Overvaluation is caused by market sentiments when there is positive news.
Like and subscribe and comment my ideas if you enjoy them!

EURCAD Will Move Lower! Sell!
Take a look at our analysis for EURCAD.
Time Frame: 1D
Current Trend: Bearish
Sentiment: Overbought (based on 7-period RSI)
Forecast: Bearish
The price is testing a key resistance 1.627.
Taking into consideration the current market trend & overbought RSI, chances will be high to see a bearish movement to the downside at least to 1.608 level.
P.S
We determine oversold/overbought condition with RSI indicator.
When it drops below 30 - the market is considered to be oversold.
When it bounces above 70 - the market is considered to be overbought.
Like and subscribe and comment my ideas if you enjoy them!

GBPJPY Will Move Lower! Short!
Here is our detailed technical review for GBPJPY.
Time Frame: 8h
Current Trend: Bearish
Sentiment: Overbought (based on 7-period RSI)
Forecast: Bearish
The market is testing a major horizontal structure 204.181.
Taking into consideration the structure & trend analysis, I believe that the market will reach 202.632 level soon.
P.S
We determine oversold/overbought condition with RSI indicator.
When it drops below 30 - the market is considered to be oversold.
When it bounces above 70 - the market is considered to be overbought.
Like and subscribe and comment my ideas if you enjoy them!

Bitcoin's drop, opportunity in disguise?Yesterday’s move took me by surprise.
I’ve been bullish on BTC and many altcoins, and without looking for excuses, I didn’t expect what happened last night (mine). The new tariff threats from Trump hit the markets like a hammer, triggering a sharp crypto selloff.
So, the question is — is this the start of a more meaningful drop, or actually an opportunity in disguise?
Looking at Bitcoin’s chart, price broke below the key 118k support zone, almost touching 108k, which I consider the real line in the sand.
In my opinion, bear markets don’t start like this. This drop looks more like a liquidation event — a clean sweep that flushed out weak hands and overleveraged positions.
If BTC dips under 110k again, I’ll be watching closely for buying opportunities. In the short term, at least a recovery toward 118k seems quite probable.

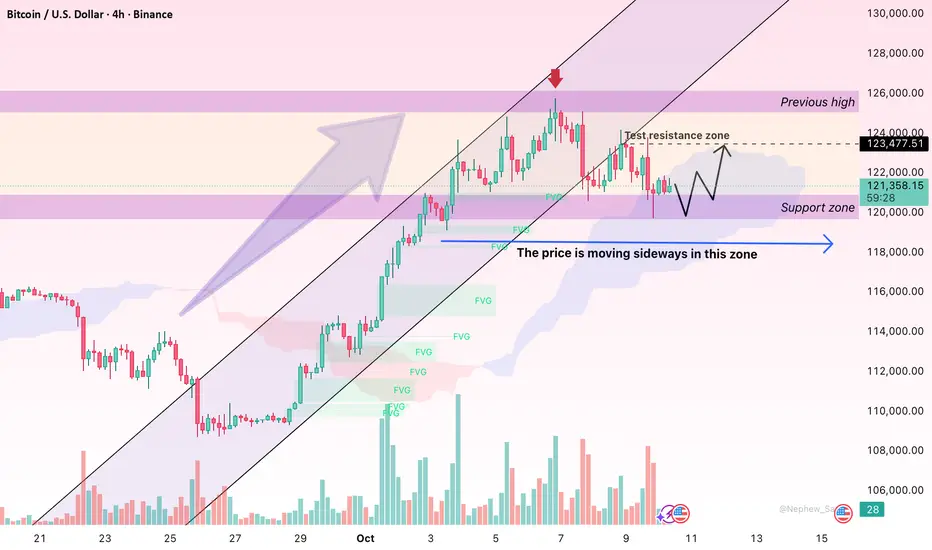
Bitcoin Pauses at $121K: Consolidation Before the Next Big Move?Hello everyone, after reaching a peak of $121,759, Bitcoin (BTC/USDT) is entering a clear sideways phase. The market seems to be taking a breather after a strong rally — as if gathering strength before deciding its next direction. With the US dollar strengthening, investor sentiment turning cautious, and new global regulations emerging, Bitcoin appears to be consolidating rather than weakening.
The recent strength of the USD is the main factor putting pressure on risk assets, including Bitcoin. Following upbeat economic data from the US and hawkish comments from the Fed, the greenback has recovered further, prompting short-term capital to flow out of the crypto market. Historically, when the dollar rises, Bitcoin tends to move sideways or correct slightly — and that pattern has been clearly reflected over the past few sessions.
Market sentiment remains neutral for now. Investors are cautious as the Fed has yet to provide clear guidance on future rate cuts, while several Asian countries — particularly Japan and South Korea — have introduced new regulatory measures for crypto trading. These factors are limiting large inflows, leaving the market lacking fresh upward momentum.
Technically, the 4-hour chart shows Bitcoin fluctuating within a narrow range, facing resistance near $121,760 and support around $120,000. The Fair Value Gaps (FVGs) from the previous rally are gradually being filled, suggesting a possible retest of support before any breakout. The price remains above the Ichimoku cloud, which still signals a medium-term bullish structure, even though the short-term pace has slowed.
Overall, Bitcoin is being held back by three main forces: the strong USD, absence of bullish catalysts, and regulatory caution. However, if the $120,000 support continues to hold, the probability of a rebound remains high — with the next targets around $124,000 to $125,000.
What do you think — is Bitcoin just catching its breath, or preparing for another explosive move?
HYPEUSDT.P - September 24, 2025Price has retraced from recent highs and is currently hovering near support around 42.787–39.796 after a sharp pullback. Structure remains bullish overall, with a strong accumulation zone forming above 39.796, suggesting potential for a rebound. Entry is set at 39.796, looking for continuation.
Entry Price: 39.796
Profit Level: 65.025
Stop Level: 29.980
This setup carries low risk and high probability, supported by a clean support base, bullish market structure, and a favorable risk-to-reward ratio.
This is not financial advice. Trading involves risk, and you should always do your own research before making any investment decisions. Manage your risk properly and never trade with money you cannot afford to lose.

$Solana $250+ or DOWN 216?In our recent post, we perfectly predicted the touch of 250 and 190.
Price has now reversed off the supply zone and is making its way back up, lets see what the potential out come for the next two weeks are!
Solana (SOL/USDT) 1H Chart Analysis
Current Price: ~$232
Trend : Price is was inside a clear ascending channel, respecting support and resistance lines - however has now breached resistance.
Key Levels
Support Zones:
$225 → Psychological support + 4H FVG.
$216 → Deeper 4H FVG and strong volume node. ( + 4 Hour Fib GP )
$200 → Major psychological level + prior supply zone flip.
Resistance Zones:
$250 → Psychological resistance + demand zone.
$275 → Next major resistance if $250 breaks.
Bullish Scenario
If SOL holds above $225 and consolidates within the trend channel, price could retest $250.
Break and close above $250 may extend rally toward $275.
Bearish Scenario
Failure to hold $225 could drag SOL to the $216 FVG or even $208.
A breakdown of $208 increases risk of revisiting $200.
Summary
Market structure remains bullish as long as price respects the rising trendline.
$225 is the key short-term pivot: holding above favors $250+, losing it opens downside risk toward $216–200.
Let me know what you think!

Solana and Bitcoin Update ! Whats Next Quick update covering BTC and Solana .
I had done videos previously anticipating this move to the downside and wanted to cover the current price action and add a little clarity to the situation .
We have had a great reaction off of BTC so far and thus some alts have also followed suit .
Bitcoin holds the fate for the alts so we want to see btc hold the current range 113K .
Take it level by level and dont panic . This is a great opportunity but we want to see a sign of strength in SOL before taking positions .

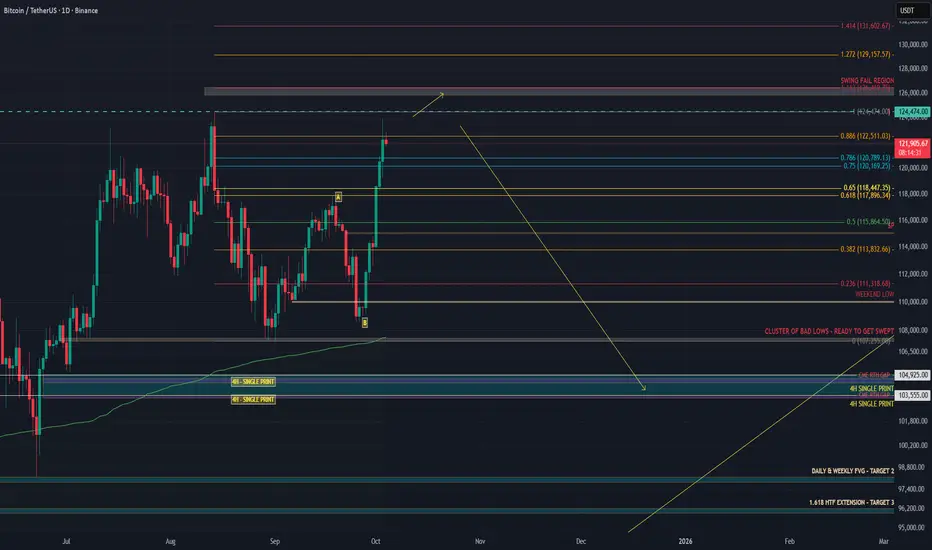
BITCOIN’S FINAL TRAP – THE SENTIMENT SWITCH IS COMING FASTIn my last BTC post I said a dump was likely based on data, and that thesis still stands. If anything, it’s even stronger now. .
On 13 August, CME made a high at 123,590.
That high was weak, no excess, flat TPO top, unfinished auction.
Binance topped at 124,474, Coinbase at 124,522.
CME opened with a gap down, leaving that poor high unrepaired with unfinished business and clean liquidity sitting above.
From 26 September, BTC started grinding up.
I expected a run of the 18 September high and a reversal around 118–119K, but price extended the move to the 1.618 extension. See my last analysis.
Structure was weak, spot CVD flat, futures CVD ripping, open interest climbing.
That shows perps were driving it, not real spot demand.
This week CME finally cleaned it up.
CME ripped through 125,025, taking out the August high at 123,590.
That level matched the old highs on Binance and Coinbase almost perfectly.
CME swept the old poor high left behind by spot and perps, completing the auction.
This is typical CME behavior, it hunts untested reference points during RTH and often reverses right after.
Flow data confirms the setup:
Spot CVD down means real buyers not following.
Stablecoin CVD pushing up means overleveraged longs chasing.
Coin-margined CVD rolling means profit taking or hedge flow.
Open interest flat at the top means trapped longs with no squeeze left.
The move looks like a leveraged markup driven by perps, cleaned up by CME liquidity, and now hanging on air.
CME repaired the August inefficiency, swept the prior spot high, and left another weak high with no excess, a textbook sign of distribution.
There’s still a chance we see one more SFP around 126K before momentum flips, but unless spot demand picks up aggressively, that should be the final liquidity grab.
My targets are 104K and 99K if 104K fails to hold, with potential for an even deeper drop beyond that level.
BITCOIN Are you worried about this?Bitcoin (BTCUSD) is pulling back aggressively today following Trump's China-tariffs related news and this weekly rejection is far from ideal technically as well.
In recent years it's been unusual to look at the market on anything but a logarithmic scale, which is natural as it offers a fair representation of BTC's remarkable gains and parabolic Cycles.
On today's analysis however we present the long-term price action on the 1W time-frame without being on the log scale. And as you can see what stands out is a Higher Highs trend-line that dates back to the December 11 2017 Cycle Top, almost 8 years ago.
This trend-line is anything but comforting at the moment as it has caused numerous rejections with the strongest being the April 12 2021 High. More recently it has formed the July 14 2025 High, the August 11 2025 High, last week's (September 29 2025) High and so far the current one (October 06 2025).
This is far from ideal and it gets worse seeing that since the March 04 2024 High, the 1W RSI has been under Lower Highs, which is of course a Bearish Divergence against the markets Higher Highs, similar to the Lower Highs of the previous Cycle that formed the November 08 2021 Top.
This time is indeed a little different though as the RSI's current 3rd Lower High is still a Higher High for BTC while on the previous Cycle it was (March 21 2022) already a Lower High for the price as well inside a Bear Cycle that has already started.
Still, do you believe this 8-year Higher Highs trend-line rejection is alarming or not? Feel free to let us know in the comments section below!
-------------------------------------------------------------------------------
** Please LIKE 👍, FOLLOW ✅, SHARE 🙌 and COMMENT ✍ if you enjoy this idea! Also share your ideas and charts in the comments section below! This is best way to keep it relevant, support us, keep the content here free and allow the idea to reach as many people as possible. **
-------------------------------------------------------------------------------
💸💸💸💸💸💸
👇 👇 👇 👇 👇 👇

CADJPY FREE SIGNAL|LONG|
✅CADJPY forms a bullish structure after reclaiming the demand level, signaling Smart Money interest in premium buys. Liquidity sweep below 108.800 confirms accumulation before a move toward 109.460 target.
—————————
Entry: 109.051
Stop Loss: 108.664
Take Profit: 109.460
Time Frame: 7H
—————————
LONG🚀
✅Like and subscribe to never miss a new idea!✅

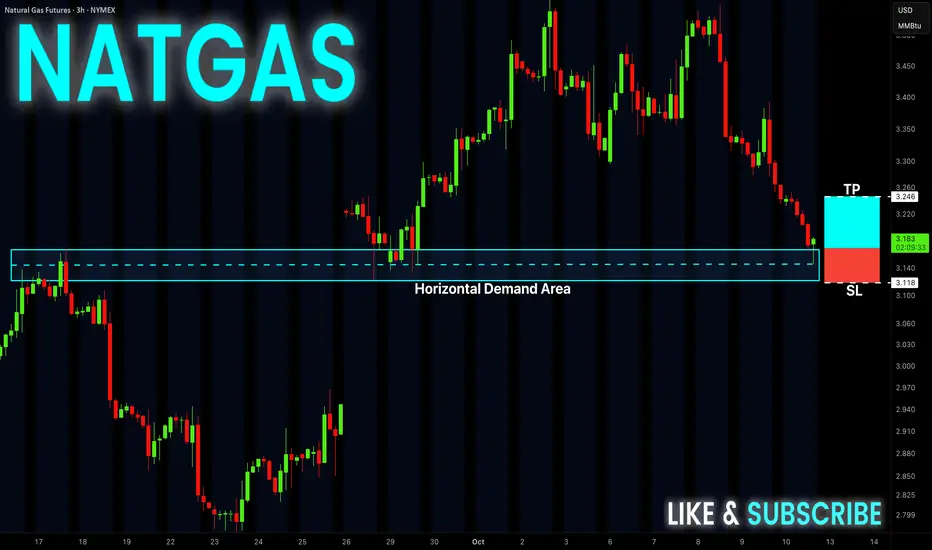
NATGAS Free Signal! Buy!
Hello,Traders!
NATGAS tapped into the horizontal demand area, showing clear signs of Smart Money accumulation. A bullish reaction is expected toward 3.246$, with liquidity resting above recent highs.
-------------------
Stop Loss: 3.118$
Take Profit: 3.246$
Entry: 3.183$
Time Frame: 3H
-------------------
Buy!
Comment and subscribe to help us grow!
Check out other forecasts below too!
Disclosure: I am part of Trade Nation's Influencer program and receive a monthly fee for using their TradingView charts in my analysis.
CADCHF WILL GROW|LONG|
✅CADCHF is consolidating above the demand level, signaling accumulation within a bullish structure. Smart Money likely aims to engineer liquidity before driving price toward the 0.5770 target zone, continuing the uptrend. Time Frame 3H.
LONG🚀
✅Like and subscribe to never miss a new idea!✅

GBPCAD Risky Long! Buy!
Hello,Traders!
GBPCAD is reacting from the horizontal demand area after a deep push into discount pricing. Smart Money shows signs of accumulation, suggesting potential bullish recovery toward 1.8600 to rebalance inefficiency. Time Frame 3H.
Buy!
Comment and subscribe to help us grow!
Check out other forecasts below too!
Disclosure: I am part of Trade Nation's Influencer program and receive a monthly fee for using their TradingView charts in my analysis.

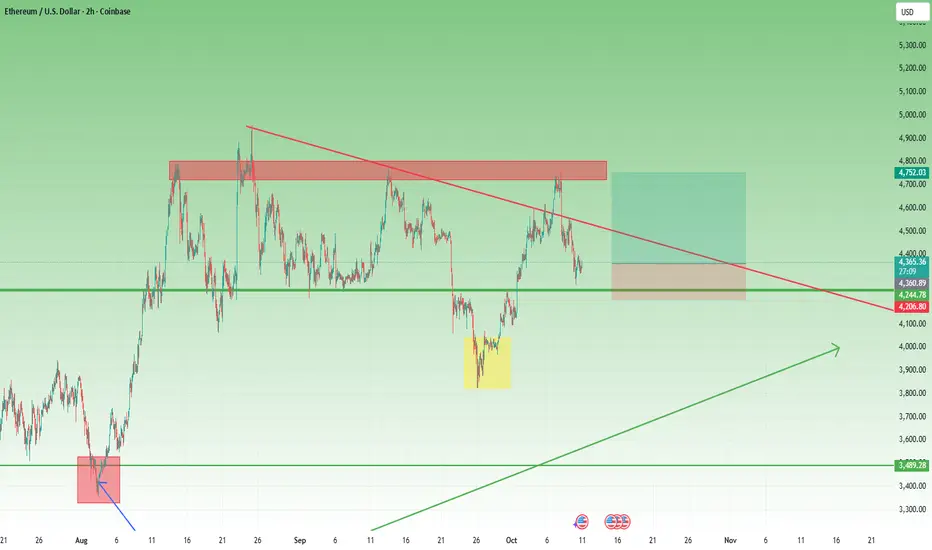
ETH Correction Complete? Bullish Setup Reemerges As I mentioned in my previous ETH analysis, while my medium-term outlook remains bullish, I was anticipating a short-term correction.
That’s exactly what unfolded. After retesting the 4750 resistance zone, Ethereum began to retrace, reaching the support area just below 4300 earlier today.
Currently, the price is rebounding, and there’s a strong probability that the corrective phase has ended.
I’m now looking to re-enter long, as even a move back to the recent highs could offer a 1:2.5 risk–reward setup — a solid short-term opportunity within the broader bullish structure.
US30: Absolute Price Collapse Ahead! Short!
My dear friends,
Today we will analyse US30 together☺️
The recent price action suggests a shift in mid-term momentum. A break below the current local range around 46,434.34 will confirm the new direction downwards with the target being the next key level of 46,322.75 and a reconvened placement of a stop-loss beyond the range.
❤️Sending you lots of Love and Hugs❤️
GOLD: Will Go Up! Long!
My dear friends,
Today we will analyse GOLD together☺️
The in-trend continuation seems likely as the current long-term trend appears to be strong, and price is holding above a key level of 3,983.49 So a bullish continuation seems plausible, targeting the next high. We should enter on confirmation, and place a stop-loss beyond the recent swing level.
❤️Sending you lots of Love and Hugs❤️

SILVER: The Market Is Looking Down! Short!
My dear friends,
Today we will analyse SILVER together☺️
The market is at an inflection zone and price has now reached an area around 49.885 where previous reversals or breakouts have occurred.And a price reaction that we are seeing on multiple timeframes here could signal the next move down so we can enter on confirmation, and target the next key level of 49.478.Stop-loss is recommended beyond the inflection zone.
❤️Sending you lots of Love and Hugs❤️

EURUSD: Strong Bullish Sentiment! Long!
My dear friends,
Today we will analyse EURUSD together☺️
The price is near a wide key level
and the pair is approaching a significant decision level of 1.15720 Therefore, a strong bullish reaction here could determine the next move up.We will watch for a confirmation candle, and then target the next key level of1.15950.Recommend Stop-loss is beyond the current level.
❤️Sending you lots of Love and Hugs❤️

EURGBP Shifting to long-term Bearish.The EURGBP pair gave us a very efficient Channel Up buy signal last time (July 11, see chart below) that quickly hit our 0.87400 Target:
That pattern then broke and now we shift back to the longer term dynamics of the market as the trend is shifting from bullish to bearish. The strongest bearish indicator at the moment is the 1D RSI which has been on a Lower Highs Bearish Divergence for months, in contrast to the pair's Higher Highs.
The build up pattern to this (Channel Up into Channel Down following a 1D RSI Bearish Divergence) is similar to the 2022 - 2023 sequence. That fractal turned into a Channel Down following the first Lower High that initially formed a (temporary) Low marginally above the 0.618 Fibonacci retracement level.
As a result, we shift to long-term bearish on the EURGBP pair, targeting 0.84500.
-------------------------------------------------------------------------------
** Please LIKE 👍, FOLLOW ✅, SHARE 🙌 and COMMENT ✍ if you enjoy this idea! Also share your ideas and charts in the comments section below! This is best way to keep it relevant, support us, keep the content here free and allow the idea to reach as many people as possible. **
-------------------------------------------------------------------------------
💸💸💸💸💸💸
👇 👇 👇 👇 👇 👇

CRUDE OIL REBOUND AHEAD|LONG|
✅WTI OIL has tapped into the demand level after a sharp decline, showing signs of accumulation. A reaction from this discount area could drive price higher toward 61.10$, where liquidity above minor highs is resting. Time Frame 2H.
LONG🚀
✅Like and subscribe to never miss a new idea!✅

EUR-USD Bearish Bias! Sell!
Hello,Traders!
EURUSD breaks below the horizontal supply area and is now retesting it as new resistance. Smart Money distribution is evident, and bearish continuation toward the 1.1540 target is expected as inefficiency gets filled. Time Frame 6H.
Sell!
Comment and subscribe to help us grow!
Check out other forecasts below too!
Disclosure: I am part of Trade Nation's Influencer program and receive a monthly fee for using their TradingView charts in my analysis.
