EURUSD: The Market Is Looking Down! Short!
My dear friends,
Today we will analyse EURUSD together☺️
The in-trend continuation seems likely as the current long-term trend appears to be strong, and price is holding below a key level of 1.16224 So a bearish continuation seems plausible, targeting the next low. We should enter on confirmation, and place a stop-loss beyond the recent swing level.
❤️Sending you lots of Love and Hugs❤️
Signals

SILVER: Strong Bullish Sentiment! Long!
My dear friends,
Today we will analyse SILVER together☺️
The market is at an inflection zone and price has now reached an area around 52.802 where previous reversals or breakouts have occurred.And a price reaction that we are seeing on multiple timeframes here could signal the next move up so we can enter on confirmation, and target the next key level of 53.558.Stop-loss is recommended beyond the inflection zone.
❤️Sending you lots of Love and Hugs❤️

GOLD: Bears Are Winning! Short!
My dear friends,
Today we will analyse GOLD together☺️
The price is near a wide key level
and the pair is approaching a significant decision level of 4,204.23 Therefore, a strong bearish reaction here could determine the next move down.We will watch for a confirmation candle, and then target the next key level of 4,182.91.Recommend Stop-loss is beyond the current level.
❤️Sending you lots of Love and Hugs❤️

AUDUSD FREE SIGNAL|SHORT|
✅AUDUSD retraced into a premium supply zone, aligning with bearish order flow and imbalance fill. Liquidity above 0.6530$ has been collected — price likely targets 0.6490$.
—————————
Entry: 0.6512$
Stop Loss: 0.6530$
Take Profit: 0.6490$
Time Frame: 3H
—————————
SHORT🔥
✅Like and subscribe to never miss a new idea!✅

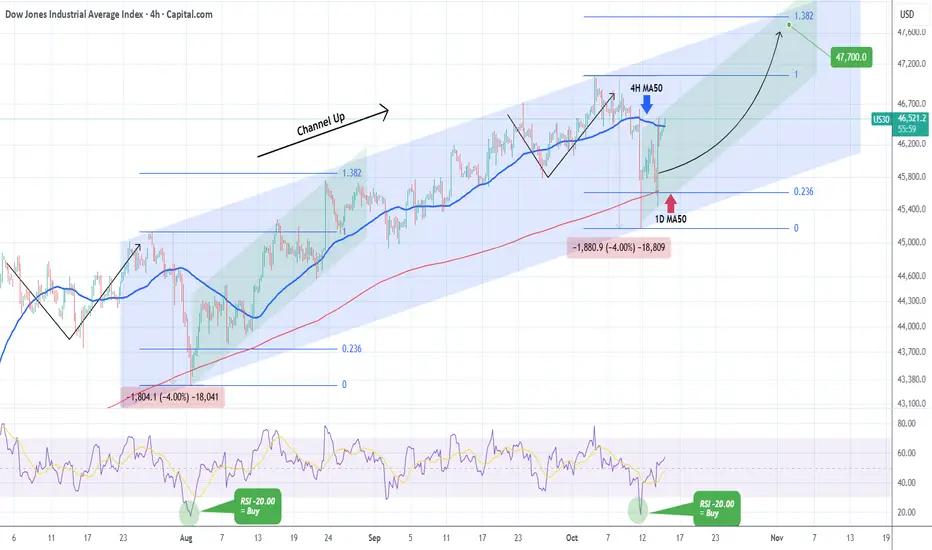
DOW JONES bounced at the bottom of the Channel Up. Buy signal.Dow Jones (DJI) has been trading within a 3-month Channel Up, with last Friday's flash crash breaching marginally below its 1D MA50 (red trend-line). That touched the bottom of the pattern and is technically a Higher Low, identical to the what the previous Bearish Leg did on the August 01 Low.
As you can see both Legs declined by -4.00% with their 4H RSIs touching the -20.00 level and rebounded. That is a technical Buy Signal, the strongest you can get within this Channel Up, and as long as the pattern's bottom holds, we expect another rise to the 1.382 Fibonacci extension (Our Target is 47700), similar to August's Bullish Leg.
-------------------------------------------------------------------------------
** Please LIKE 👍, FOLLOW ✅, SHARE 🙌 and COMMENT ✍ if you enjoy this idea! Also share your ideas and charts in the comments section below! This is best way to keep it relevant, support us, keep the content here free and allow the idea to reach as many people as possible. **
-------------------------------------------------------------------------------
💸💸💸💸💸💸
👇 👇 👇 👇 👇 👇
AUD-CAD Will Fall! Sell!
Hello,Traders!
AUDCAD reacts to the horizontal supply area, showing clear signs of Smart Money distribution. A bearish move is expected toward the next liquidity pool near 0.9130$. Time Frame 4H.
Sell!
Comment and subscribe to help us grow!
Check out other forecasts below too!
Disclosure: I am part of Trade Nation's Influencer program and receive a monthly fee for using their TradingView charts in my analysis.

NZDUSD FREE SIGNAL|SHORT|
✅NZDCAD retraced into a premium supply zone, where ICT confluences align with bearish order flow. Price may draw toward the sell-side liquidity below 0.8025.
—————————
Entry: 0.8037
Stop Loss: 0.8045
Take Profit: 0.8025
Time Frame: 2H
—————————
SHORT🔥
✅Like and subscribe to never miss a new idea!✅

NZD-USD Free Signal! Sell!
Hello,Traders!
NZDUSD is expected to retest the horizontal supply area before Smart Money resumes bearish momentum. Liquidity buildup below 0.5711$ suggests potential continuation once rejection confirms.
-------------------
Stop Loss: 0.5746$
Take Profit: 0.5711$
Entry: 0.5731$
Time Frame: 1H
-------------------
Sell!
Comment and subscribe to help us grow!
Check out other forecasts below too!
Disclosure: I am part of Trade Nation's Influencer program and receive a monthly fee for using their TradingView charts in my analysis.

EURUSD Is Very Bearish! Sell!
Take a look at our analysis for EURUSD.
Time Frame: 4h
Current Trend: Bearish
Sentiment: Overbought (based on 7-period RSI)
Forecast: Bearish
The market is approaching a key horizontal level 1.162.
Considering the today's price action, probabilities will be high to see a movement to 1.158.
P.S
Overbought describes a period of time where there has been a significant and consistent upward move in price over a period of time without much pullback.
Like and subscribe and comment my ideas if you enjoy them!

USDCHF Is Going Up! Long!
Please, check our technical outlook for USDCHF.
Time Frame: 9h
Current Trend: Bullish
Sentiment: Oversold (based on 7-period RSI)
Forecast: Bullish
The market is approaching a significant support area 0.800.
The underlined horizontal cluster clearly indicates a highly probable bullish movement with target 0.809 level.
P.S
Please, note that an oversold/overbought condition can last for a long time, and therefore being oversold/overbought doesn't mean a price rally will come soon, or at all.
Like and subscribe and comment my ideas if you enjoy them!

EURGBP Will Grow! Buy!
Here is our detailed technical review for EURGBP.
Time Frame: 1h
Current Trend: Bullish
Sentiment: Oversold (based on 7-period RSI)
Forecast: Bullish
The market is on a crucial zone of demand 0.870.
The oversold market condition in a combination with key structure gives us a relatively strong bullish signal with goal 0.871 level.
P.S
The term oversold refers to a condition where an asset has traded lower in price and has the potential for a price bounce.
Overbought refers to market scenarios where the instrument is traded considerably higher than its fair value. Overvaluation is caused by market sentiments when there is positive news.
Like and subscribe and comment my ideas if you enjoy them!

USDJPY Is Very Bearish! Sell!
Take a look at our analysis for USDJPY.
Time Frame: 1h
Current Trend: Bearish
Sentiment: Overbought (based on 7-period RSI)
Forecast: Bearish
The price is testing a key resistance 152.178.
Taking into consideration the current market trend & overbought RSI, chances will be high to see a bearish movement to the downside at least to 151.305 level.
P.S
Please, note that an oversold/overbought condition can last for a long time, and therefore being oversold/overbought doesn't mean a price rally will come soon, or at all.
Like and subscribe and comment my ideas if you enjoy them!

GOLD Will Move Higher! Buy!
Please, check our technical outlook for GOLD.
Time Frame: 8h
Current Trend: Bullish
Sentiment: Oversold (based on 7-period RSI)
Forecast: Bullish
The market is approaching a significant support area 4,069.35.
The underlined horizontal cluster clearly indicates a highly probable bullish movement with target 4,202.88 level.
P.S
We determine oversold/overbought condition with RSI indicator.
When it drops below 30 - the market is considered to be oversold.
When it bounces above 70 - the market is considered to be overbought.
Like and subscribe and comment my ideas if you enjoy them!

GBPUSD Will Go Up From Support! Long!
Please, check our technical outlook for GBPUSD.
Time Frame: 4h
Current Trend: Bullish
Sentiment: Oversold (based on 7-period RSI)
Forecast: Bullish
The market is trading around a solid horizontal structure 1.327.
The above observations make me that the market will inevitably achieve 1.334 level.
P.S
Overbought describes a period of time where there has been a significant and consistent upward move in price over a period of time without much pullback.
Like and subscribe and comment my ideas if you enjoy them!

DOTUSD Can this Channel save it from complete obsolescence?Polkadot (DOTUSD) has been trading within a Channel Down since the December 26 2022 Low and it only broke momentarily during last Friday's flash crash. Having recovered instantly above it and closing the 1W candle inside the pattern, it technically counts as a Lower Low.
The last two Lower Lows (both inside 2025), delivered rebound that hit tested the 1W MA50 (blue trend-line). As a result, the obvious technical Target on the medium-term is the 1W MA50 and our (a but more conservative) estimation is $4.600, which is right on the 0.382 Fibonacci Channel level. Of course that's assuming the market doesn't close any 1W candles below the Channel Down. The current price levels offer an excellent Risk/ Reward ratio on this.
If the 1W MA50 breaks, we can see an even more aggressive extension towards the top (Lower Highs trend-line) of the Channel Down. The best indicator for a Sell Signal in that scenario is the 1W RSI Resistance Zone. It has priced the last three major Highs since 2023. Naturally the 1W MA200 (orange trend-line) is the obvious long-term Resistance and potential Target in that scenario but can go even as high as 9.5000 if we repeat the previous +225.10% Bullish Leg.
-------------------------------------------------------------------------------
** Please LIKE 👍, FOLLOW ✅, SHARE 🙌 and COMMENT ✍ if you enjoy this idea! Also share your ideas and charts in the comments section below! This is best way to keep it relevant, support us, keep the content here free and allow the idea to reach as many people as possible. **
-------------------------------------------------------------------------------
💸💸💸💸💸💸
👇 👇 👇 👇 👇 👇

GAMMA SQUEEZE: Why Gold Prices will hit 5 000 + USDBottom line
If 1% of Treasuries ($278B) rotates into gold, $5,000/oz is not only plausible—it sits inside the low end of what flow math + today’s market microstructure can deliver. The path (and whether we print $8k+ spikes) hinges on how much of that flow shows up as short-dated calls—because that is what turns steady demand into a self-feeding gamma loop.
________________________________________
Executive summary
• A 1% rotation out of U.S. Treasuries is roughly $278B of new gold demand (using SIFMA’s latest estimate that Treasuries outstanding ≈ $27.8T).
• At today’s context (gold ~$3.53k/oz on Sep 2–5, 2025), $278B buys ~79.4M oz ≈ 2,471 tonnes; at $5k/oz it buys ~55.6M oz ≈ 1,729 tonnes. For scale, annual mine supply ≈ 3,661 t and total above-ground stocks ≈ 216,265 t (bars/coins+ETFs ≈ 48,634 t).
• That flow is huge relative to both quarterly demand value (Q2’25 ≈ $132B) and typical daily trading turnover (~$290B/day across OTC, futures & ETFs). Even spread out, it materially tilts the tape; if concentrated and routed via options, it can produce dealer hedging feedback—i.e., a gamma squeeze.
• Price targets (framework, not prophecy):
o Conservative flow-only: +40–60% → $4,900–$5,600/oz
o Base case (flow + some options reflexivity): +70–110% → $6,000–$7,500/oz
o Squeeze/overshoot window (short-dated calls heavy): episodic spikes >$8,000/oz possible, but hard to sustain without continued flow.
These bands come from scaling prior ETF-driven episodes (notably ~877 t ETF inflow in 2020 alongside a ~+36% price run) and sizing against current market depth, while layering a realistic options-hedging multiplier (details below).
________________________________________
1) What a “gamma squeeze” in gold means (and why it can happen)
Definition (in one line): When call buying concentrates near-dated, near-the-money strikes, dealers short gamma must buy futures as price rises (and sell if it falls) to keep neutral—this feedback accelerates upside (“gamma squeeze”).
Why it’s plausible in gold right now:
• The listed derivatives stack is large. As of Fri, Sep 5, 2025, CME’s daily bulletin shows COMEX gold options open interest ~0.80M contracts (calls ~0.49–0.69M; puts ~0.30–0.38M depending on line item), each on 100 oz—i.e., option OI notionally ties to ~2,400–2,800 t of gold. That is the powder keg a call-wave can act on.
• Implied vol is moderate (GVZ ~18 for 30-day GLD options), so vega is “affordable,” gamma is punchy in the front end.
• CME’s CVOL framework and open-interest tools confirm where strikes/expiries cluster; when OI stacks close to spot and near expiry, market-wide gamma becomes most sensitive.
Back-of-envelope hedging math (illustrative):
For a 30-day, at-the-money option with σ≈18%, the Black-Scholes gamma is about
Γ≈ϕ(0)SσT≈0.399S⋅0.18⋅30/365\Gamma \approx \frac{\phi(0)}{S\sigma\sqrt{T}} \approx \frac{0.399}{S\cdot 0.18 \cdot \sqrt{30/365}}.
At S=$3,500/oz, that’s ~0.0022 per $. A +1% move (+$35) bumps delta by ~0.077 per option. If just 150k near-ATM front-tenor calls are held by customers (dealers short gamma), hedge buying ≈ 150,000 × 100 oz × 0.077 ≈ 1.16M oz ≈ 36 t—per 1% price pop. That’s only a slice of total OI; a broader crowding raises this number. Compare with ~2,500 t/day of global turnover and you can see how concentrated dealer hedging can move price intraday.
________________________________________
2) Sizing a 1% Treasury → gold rotation
Treasury base: latest SIFMA comment put U.S. Treasuries outstanding ≈ $27.8T (Q1’25). 1% → $278B.
Gold the rotation would buy:
• At $3,500/oz: $278B → ~79.4M oz → ~2,471 t
• At $5,000/oz: $278B → ~55.6M oz → ~1,729 t
For scale:
• Annual mine supply (2024): ~3,661 t; total supply (incl. recycling): ~4,974 t. A $278B buy ticket equals 47–67% of a year’s mine output (depending on price), or ~35–50% of total annual supply.
• ETF precedent: In 2020, ~877 t net ETF inflow (~$48B) coincided with a ~+36% move from Jan→Aug 2020. Today’s $278B is ~5–6× that dollar size (and ~2–3× the tonnes, depending on price), hinting at large flow-driven upside even before any options reflexivity.
• Turnover lens: WGC puts average daily trading across OTC/futures/ETFs at roughly $290B/day recently. A $278B program is ~one day’s global turnover. Pushed quickly (or skewed to options), that’s impactful; stretched over months, the price impact softens but still accumulates.
Futures-only lens (capacity check):
At $3,500/oz, one COMEX GC contract notionally = $350k (100 oz). $278B equals ~794k GC contracts. Current futures OI is ~0.49M contracts, so this exceeds all COMEX OI—you cannot push that much via futures quickly without major repricing. Even at $5,000/oz (~$500k/contract), it’s ~556k contracts, still comparable to the entire OI.
________________________________________
3) Price-target framework (with the math that gets you there)
Think of the price in layers: (A) base flow impact + (B) options-gamma reflexivity + (C) second-round effects (short-covering, momentum, FX, central banks).
A) Flow-only impact (calibrated to 2020)
• 2020 anchor: 877 t ETF inflow ↔ ~+36% price. Using a simple proportionality, 1,729–2,471 t (your $278B) maps to ~+71% to +101%.
• Apply to spot ≈ $3,532/oz (early Sep 2025):
o +71% → ~$6,050/oz
o +101% → ~$7,100/oz
Caveat: 2020 had unique macro tailwinds, so I treat this as upper-middle of base range.
B) Options reflexivity / gamma squeeze overlay
If 20–30% of the $278B rotation expresses via short-dated calls (common for levered macro expressions), dealer hedging can amplify flow impact:
• From the OI math earlier, a mere 1% up-move can demand ~20–40 t of dealer hedge buying if near-ATM OI is thick. A 3–5% multi-day grind can easily cascade into 100–200 t of incremental buying from hedgers alone. That’s non-trivial vs. mine supply pace, and it pulls forward upside.
• Result: add another +10–20% to the flow-only levels during a squeeze while it lasts.
C) Second-round effects
• Central banks: still persistent net buyers (>1,000 t/yr pace in recent years), tending to fade dips rather than rallies—a structural bid.
• FX & rates: the GVZ ~18 regime means bursts of vol aren’t “expensive”; a weakening USD or policy shocks can tilt the target higher.
Putting it together—scenario bands
Scenario Assumptions Implied move Target
Conservative $278B spread over 6–9 months, mostly physical/ETFs; limited options +40–60% $4,900–$5,600
Base case 50–70% to physical/ETFs, 30–50% to futures/options; moderate dealer short-gamma +70–110% $6,000–$7,500
Squeeze / overshoot Short-dated call concentration, dealers persistently short gamma; flow bunches in weeks +120–>150% (episodic) >$8,000 (brief spikes)
$5,000 target is well within the conservative band if any meaningful fraction of the $278B pushes through quickly, even without a full-blown gamma loop.
________________________________________
4) Why the market could mechanically gap higher
• Market size vs. flow: Q2’25 total demand value = $132B. Dropping $278B into this ecosystem is a 2× quarterly shock.
• Trading capacity: $278B ≈ one full day of global turnover; price impact is convex when the risk-absorption (dealers, miners, recyclers) cannot scale linearly day-by-day.
• Derivatives gearing: With ~0.8M options contracts OI outstanding and futures OI ~0.49M, even a partial shift into calls forces hedge-buys on the way up, the hallmark of a squeeze.
________________________________________
5) Key risks / reality checks
• Time profile of the rotation matters. A slow, programmatic shift spreads impact; a front-loaded move can overshoot then mean-revert as gamma decays.
• Elasticity is asymmetric. Jewelry/fabrication falls at high prices (demand destruction), recycling rises, both cushioning extremes. That moderates how long >$7k can persist without continued flow.
• Volatility regimes change. If GVZ spikes to high-20s/30s, option premia jump, slowing new call demand; conversely, put demand can flip net gamma long for dealers, dampening squeezes.
________________________________________
References (most load-bearing)
• Treasury base: SIFMA—Treasuries outstanding $27.8T (Feb 2025).
• Gold supply & stocks: WGC—Above-ground stock 216,265 t (end-2024); bars/coins+ETFs 48,634 t; mine supply 2024 ≈ 3,661 t.
• Trading turnover: WGC—gold trading ≈ $290B/day.
• ETF precedent: WGC—2020 ETF inflows 877 t (~$47.9B) alongside major price rise.
• Current price context: Reuters—record highs $3,532/oz set in early Sep 2025. (
• Options/hedging plumbing: CME daily bulletin (Sep 5, 2025) showing gold options OI ~0.8M contracts; CME CVOL/tools; Cboe GVZ ~18 as 30-day IV.
________________________________________

AUD-USD Short From Supply Area! Sell!
Hello,Traders!
AUDUSD has rebounded into a horizontal supply area, showing rejection at premium levels. Smart Money Concepts indicate potential redistribution before targeting 0.6510$.
-------------------
Stop Loss: 0.6532$
Take Profit: 0.6510$
Entry: 0.6517$
Time Frame: 3H
-------------------
Sell!
Comment and subscribe to help us grow!
Check out other forecasts below too!
Disclosure: I am part of Trade Nation's Influencer program and receive a monthly fee for using their TradingView charts in my analysis.

EURUSD FREE SIGNAL|SHORT|
✅EURUSD returned to a premium supply level after breaking structure, where ICT traders anticipate distribution. Liquidity above recent highs has been cleared, signaling potential downside.
—————————
Entry: 1.1636
Stop Loss: 1.1650
Take Profit: 1.1619
Time Frame: 2H
—————————
SHORT🔥
✅Like and subscribe to never miss a new idea!✅

Lingrid | AUDCAD Key Swap Level Shorting OpportunityFX:AUDCAD recovered from its double-bottom formation near 0.9063, pushing back into the swap zone around 0.9160 after breaking the short-term resistance. The structure reveals a retest of the upward trendline under a descending resistance channel, suggesting a possible corrective pullback before resuming downside pressure. If price fails to sustain above 0.9160, a decline toward 0.9111 or lower remains likely. Market structure favors a bearish continuation as long as the pair trades below the descending red trendline.
⚠️ Risks:
A sustained breakout above 0.9160 could invalidate the bearish outlook.
Stronger Australian employment or CPI data may fuel short-term upside volatility.
Broad CAD weakness tied to oil price drops could trigger unexpected rallies .
If this idea resonates with you or you have your own opinion, traders, hit the comments. I’m excited to read your thoughts!

Lingrid | SOLUSDT Consolidation Break Expansion SetupBINANCE:SOLUSDT rebounded sharply from the $170 support after a flash crash and is now consolidating near the $200 level within a mid-range structure. The chart shows a sequence of impulse and correction leg price action patterns, with buyers attempting to establish momentum. A stable close above $10 may confirm renewed bullish activity toward the $230 resistance zone. The overall structure suggests range accumulation, with a potential upward breakout forming if momentum persists.
⚠️ Risks:
Failure to hold above $190 could lead to renewed selling pressure.
Broader crypto market weakness may cap any upside recovery.
A stronger dollar or macro risk-off sentiment could stall bullish continuation.
If this idea resonates with you or you have your own opinion, traders, hit the comments. I’m excited to read your thoughts!

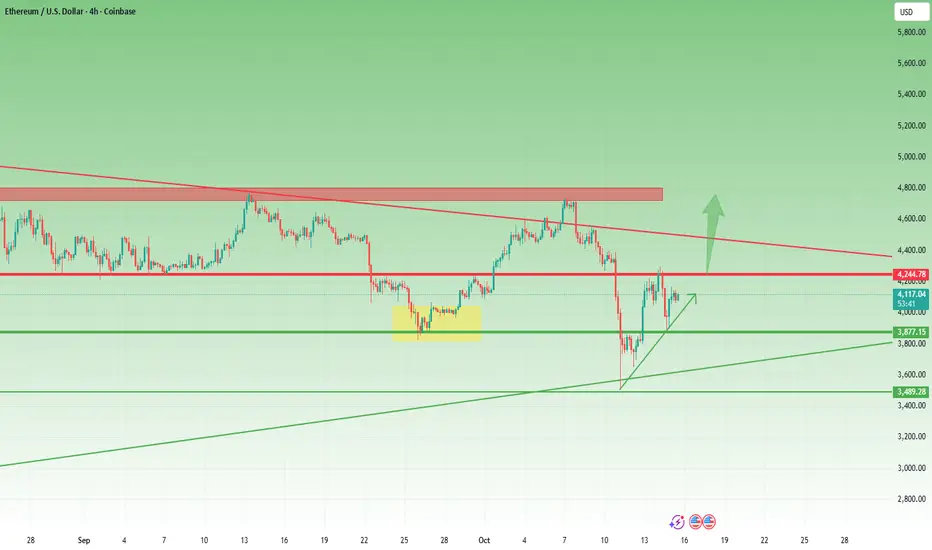
ETH: Technical Precision Amid the CrashIn spite of the crypto market crash, Ethereum actually moved very technically.
The break below the $4,300 support led to a drop toward the important $3,500 zone.
Although the price also broke below $3,850, a quick reversal followed — the rebound brought the price back above the $3,850 support and up to the $4,300 resistance.
A new wave of selling came next, but this time, the price stopped around the $3,850 support zone, confirming it as an important level.
A quick rebound followed, and now ETH is back above $4,000, trading around $4,100.
Also very important — the price of ETH is forming an ascending triangle, with resistance at $4,300.
A break above $4,300 will most likely accelerate gains toward the $4,900–$5,000 area, which is both a technical resistance and the target of the triangle.
I’m looking to buy on dips, preferably below $4,000, and considering the mentioned target, such a setup offers around a 1:3 or even 1:4 risk-reward ratio.
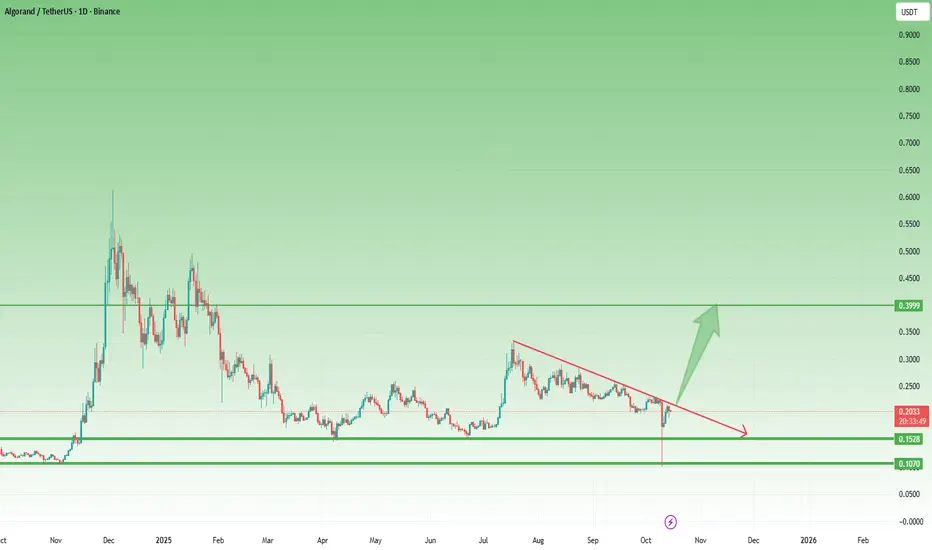
ALGO – Reversal from the Final Support ZoneLike most altcoins, Algorand also ended Friday’s crash by touching its final support zone, then strongly reversed.
After dropping to 0.10, the coin rebounded sharply and reclaimed the next key level at 0.15.
Currently trading around 0.20, ALGO is showing early signs of stabilization. If the overall crypto recovery continues, this setup could develop into a solid bullish signal.
The confirmation comes with a break above 0.2250, which would mark the end of the correction that started in December last year — opening the way toward the 0.40 zone.
Let’s see if the market confirms it. 🚀
LINK – Back Inside the Bullish FlagOn Friday night, Chainlink lost its confluence support from the 18.50 zone and dropped sharply to just under $10.
However, looking at the chart, we can clearly see the importance of this area, marked by both the 2022–2023 accumulation resistance and the 2024 lows.
From there, the coin rebounded fast, managing to reclaim the 18.50 support and re-enter the bullish flag that started forming at the end of August.
This recovery shows strong buying interest — but no clear buy signal has yet appeared.
For now, LINK remains a coin to watch closely.
A confirmed breakout above 21.50 would open the door for a new bullish leg, with 30 USD as the next technical target.
