Lingrid | AUDCAD Key Swap Level Shorting OpportunityFX:AUDCAD recovered from its double-bottom formation near 0.9063, pushing back into the swap zone around 0.9160 after breaking the short-term resistance. The structure reveals a retest of the upward trendline under a descending resistance channel, suggesting a possible corrective pullback before resuming downside pressure. If price fails to sustain above 0.9160, a decline toward 0.9111 or lower remains likely. Market structure favors a bearish continuation as long as the pair trades below the descending red trendline.
⚠️ Risks:
A sustained breakout above 0.9160 could invalidate the bearish outlook.
Stronger Australian employment or CPI data may fuel short-term upside volatility.
Broad CAD weakness tied to oil price drops could trigger unexpected rallies .
If this idea resonates with you or you have your own opinion, traders, hit the comments. I’m excited to read your thoughts!
Signals

Lingrid | SOLUSDT Consolidation Break Expansion SetupBINANCE:SOLUSDT rebounded sharply from the $170 support after a flash crash and is now consolidating near the $200 level within a mid-range structure. The chart shows a sequence of impulse and correction leg price action patterns, with buyers attempting to establish momentum. A stable close above $10 may confirm renewed bullish activity toward the $230 resistance zone. The overall structure suggests range accumulation, with a potential upward breakout forming if momentum persists.
⚠️ Risks:
Failure to hold above $190 could lead to renewed selling pressure.
Broader crypto market weakness may cap any upside recovery.
A stronger dollar or macro risk-off sentiment could stall bullish continuation.
If this idea resonates with you or you have your own opinion, traders, hit the comments. I’m excited to read your thoughts!

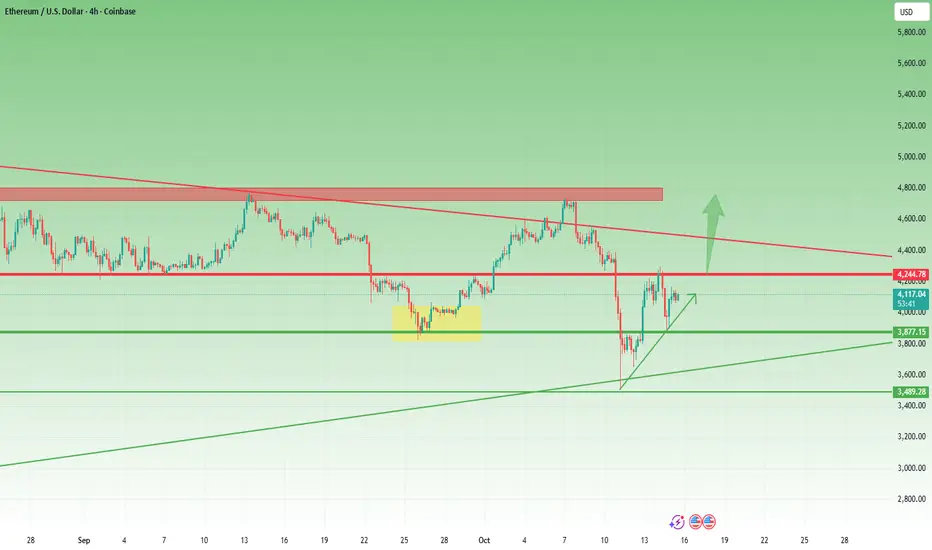
ETH: Technical Precision Amid the CrashIn spite of the crypto market crash, Ethereum actually moved very technically.
The break below the $4,300 support led to a drop toward the important $3,500 zone.
Although the price also broke below $3,850, a quick reversal followed — the rebound brought the price back above the $3,850 support and up to the $4,300 resistance.
A new wave of selling came next, but this time, the price stopped around the $3,850 support zone, confirming it as an important level.
A quick rebound followed, and now ETH is back above $4,000, trading around $4,100.
Also very important — the price of ETH is forming an ascending triangle, with resistance at $4,300.
A break above $4,300 will most likely accelerate gains toward the $4,900–$5,000 area, which is both a technical resistance and the target of the triangle.
I’m looking to buy on dips, preferably below $4,000, and considering the mentioned target, such a setup offers around a 1:3 or even 1:4 risk-reward ratio.
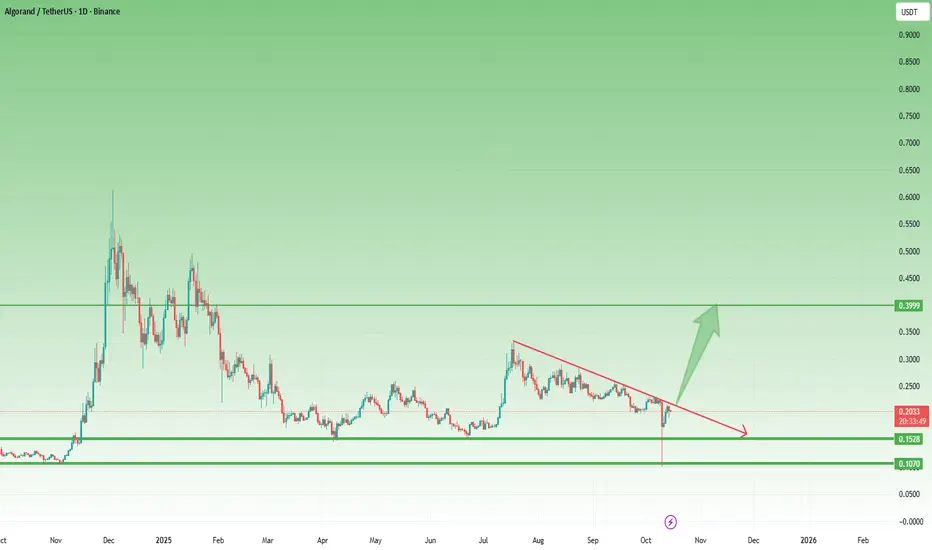
ALGO – Reversal from the Final Support ZoneLike most altcoins, Algorand also ended Friday’s crash by touching its final support zone, then strongly reversed.
After dropping to 0.10, the coin rebounded sharply and reclaimed the next key level at 0.15.
Currently trading around 0.20, ALGO is showing early signs of stabilization. If the overall crypto recovery continues, this setup could develop into a solid bullish signal.
The confirmation comes with a break above 0.2250, which would mark the end of the correction that started in December last year — opening the way toward the 0.40 zone.
Let’s see if the market confirms it. 🚀
LINK – Back Inside the Bullish FlagOn Friday night, Chainlink lost its confluence support from the 18.50 zone and dropped sharply to just under $10.
However, looking at the chart, we can clearly see the importance of this area, marked by both the 2022–2023 accumulation resistance and the 2024 lows.
From there, the coin rebounded fast, managing to reclaim the 18.50 support and re-enter the bullish flag that started forming at the end of August.
This recovery shows strong buying interest — but no clear buy signal has yet appeared.
For now, LINK remains a coin to watch closely.
A confirmed breakout above 21.50 would open the door for a new bullish leg, with 30 USD as the next technical target.

GBP-USD Free Signal! Sell!
Hello,Traders!
GBPUSD tapped into a horizontal supply area after grabbing buy-side liquidity, confirming bearish intent. Smart Money likely aims for imbalance fill toward 1.3302$ before any rebound.
-------------------
Stop Loss: 1.3335$
Take Profit: 1.3302$
Entry: 1.3322$
Time Frame: 3H
Setup Risk: High
-------------------
Sell!
Comment and subscribe to help us grow!
Check out other forecasts below too!
Disclosure: I am part of Trade Nation's Influencer program and receive a monthly fee for using their TradingView charts in my analysis.

BITCOIN Risky Short! Sell!
Hello,Traders!
BITCOIN is reacting from a horizontal supply area after a strong impulsive move down. Smart Money may engineer a retracement before continuing to target 111,300$ liquidity. Time Frame 2H.
Sell!
Comment and subscribe to help us grow!
Check out other forecasts below too!
Disclosure: I am part of Trade Nation's Influencer program and receive a monthly fee for using their TradingView charts in my analysis.

EURJPY WILL GROW|LONG|
✅EURJPY retraced perfectly into the demand level after clearing liquidity below previous lows. Price shows bullish intent, with upside imbalance toward 177.00 likely to be filled. Time Frame 4H.
LONG🚀
✅Like and subscribe to never miss a new idea!✅

EURAUD BEARISH BIAS|SHORT|
✅EURAUD retraced into a clear supply level after a sharp displacement move. ICT traders anticipate distribution, targeting inefficiency around 1.7830 as price seeks sell-side liquidity. Time Frame 3H.
SHORT🔥
✅Like and subscribe to never miss a new idea!✅

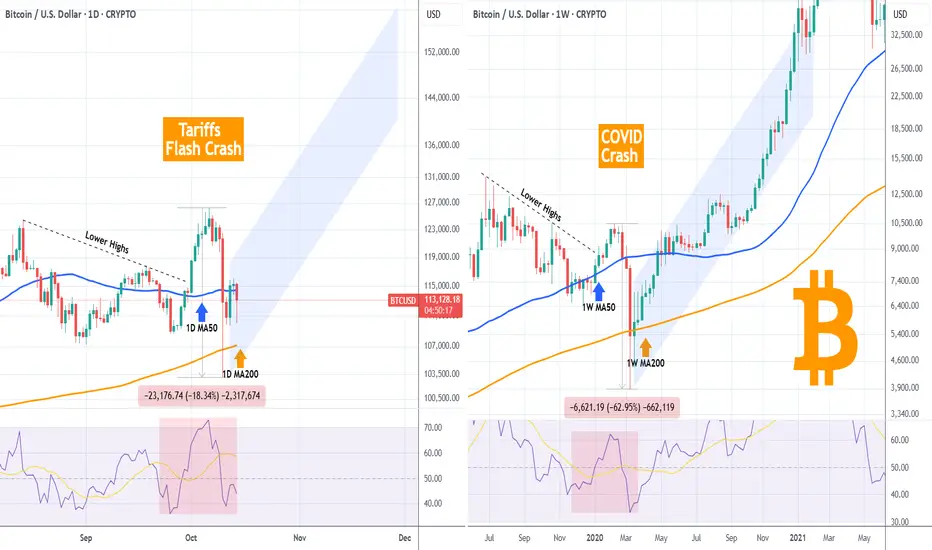
BITCOIN Is last Friday's flash crash similar to COVID's?Bitcoin (BTCUSD) made a strong flash crash last Friday following President Trump's tariff threats to China. That brought back memories of the March 2020 COVID crash. But are those that similar??
Quick answer: strength/ aggression wise no. Last Friday's crash marked 'just' a -18.34% decline from its top on a week basis. COVID's crash, which was longer admittedly, pulled the price down by -62.95% from February's 2020 High. Massive difference in market psychology and dynamics (even though we may have not seen the last of the current Tariff Crash). And that is the reason one chart is on the 1D time-frame and the other on the 1W time-frame.
However this is the exact reason that they look so similar in technical structure. As you can see both started on a Lower Highs downtrend, which broke to the upside that led to the eventual crash that broke below both the MA50 and MA200 (blue and orange trend-lines respectively). Even their RSI structures are similar.
The COVID crash taught us that as long as the MA200 closed the candles above it, a massive rally was sustained to new Highs. If the same structure is followed on the current fractal, we may see BTC rising by as high as $150k.
So what do you think? Do those two crashes share similarities that can justify a market recovery now? Feel free to let us know in the comments section below!
-------------------------------------------------------------------------------
** Please LIKE 👍, FOLLOW ✅, SHARE 🙌 and COMMENT ✍ if you enjoy this idea! Also share your ideas and charts in the comments section below! This is best way to keep it relevant, support us, keep the content here free and allow the idea to reach as many people as possible. **
-------------------------------------------------------------------------------
💸💸💸💸💸💸
👇 👇 👇 👇 👇 👇
USD-CHF Local Long! Buy!
Hello,Traders!
USDCHF is approaching a horizontal demand area, where Smart Money accumulation could trigger a bullish reversal. Expect price to tap into 0.8025$ liquidity before redistribution. Time Frame 2H.
Buy!
Comment and subscribe to help us grow!
Check out other forecasts below too!
Disclosure: I am part of Trade Nation's Influencer program and receive a monthly fee for using their TradingView charts in my analysis.

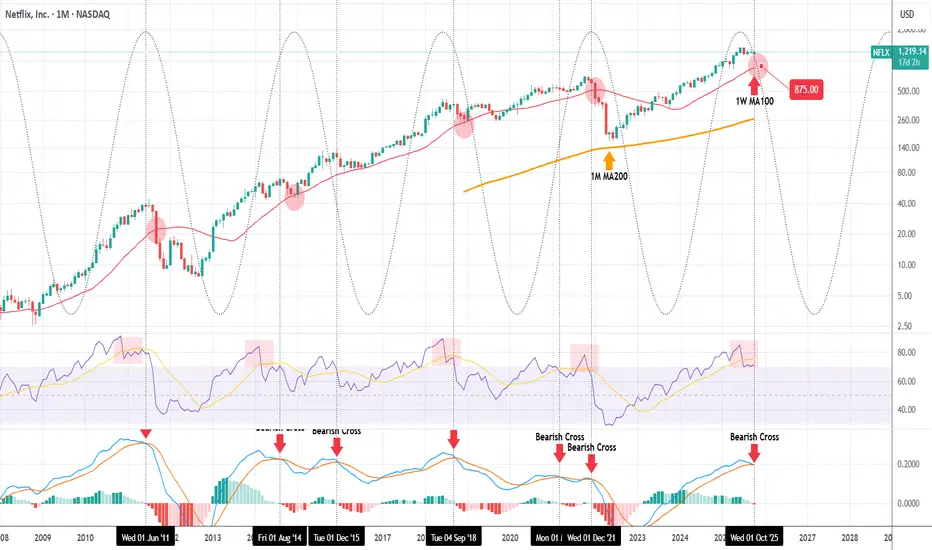
NETFLIX has topped and can pull back to $875.Netflix (NFLX) has formed one of its strongest Sell Signals in the last 15 years. That's the 1M MACD Bearish Cross.
The stock has been trading on a very consistent pattern ever since the 2008 U.S. Housing Crisis and during this multi-year span, the best indicator for a Top has been the 1M MACD forming a Bearish Cross.
As you can see, this month marks the 7th such occurrence since June 2011. All previous formations resulted in the price pulling-back to touch at least its 1W MA100 (red trend-line). Only two times the correction has been bigger that was that first Bearish Cross in June 2011 and the most recent December 2021, which almost hit the 1M MA200 (orange trend-line), the market's ultimate multi-decade Support.
These Top signals match fairly well the Sine Waves, which as you see form somewhat reliable Cycles. Those confirm that Netflix currently stands on a long-term Top. Even the 1M RSI is similar to the Top patterns suggested by the Sine Waves.
As a result, we expect the stock to start a multi-month technical pull-back, with a fair projection of making contact with its 1W MA100 being $875.00. That's our Target.
-------------------------------------------------------------------------------
** Please LIKE 👍, FOLLOW ✅, SHARE 🙌 and COMMENT ✍ if you enjoy this idea! Also share your ideas and charts in the comments section below! This is best way to keep it relevant, support us, keep the content here free and allow the idea to reach as many people as possible. **
-------------------------------------------------------------------------------
💸💸💸💸💸💸
👇 👇 👇 👇 👇 👇
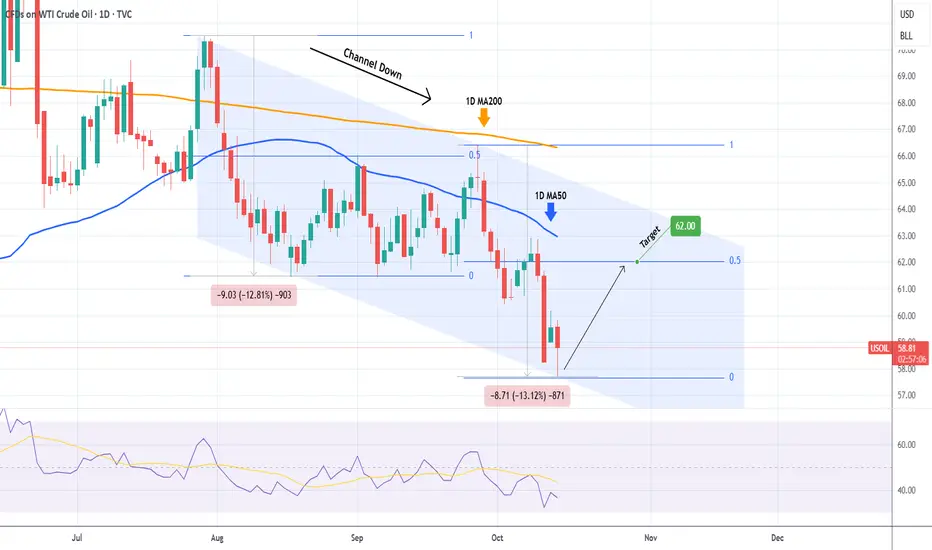
WTI OIL hit the Channel Down bottom. Buy Signal.WTI Oil (USOIL) has been trading within a Channel Down since the July 30 High and today it hit its bottom (Lower Lows trend-line). The decline from the recent Lower High was around -13%, similar to the previous Bearish Leg.
When that bottomed (Lower Low), it rebounded towards its 1D MA50 (blue trend-line) and peaked (Lower High) marginally above the 0.5 Fibonacci retracement level. As a result, we expect a new Bullish Leg to start now, with our Target at $62.00.
-------------------------------------------------------------------------------
** Please LIKE 👍, FOLLOW ✅, SHARE 🙌 and COMMENT ✍ if you enjoy this idea! Also share your ideas and charts in the comments section below! This is best way to keep it relevant, support us, keep the content here free and allow the idea to reach as many people as possible. **
-------------------------------------------------------------------------------
💸💸💸💸💸💸
👇 👇 👇 👇 👇 👇
CADCHF FREE SIGNAL|LONG|
✅CADCHF traded into a refined demand level, showing bullish intent with strong rejection wicks. A move toward 0.5715 liquidity highs is expected as price rebalances inefficiency. Time Frame 2H.
—————————
Entry: 0.5704
Stop Loss: 0.5697
Take Profit: 0.5715
Time Frame: 2H
—————————
LONG🚀
✅Like and subscribe to never miss a new idea!✅

SILVER Will Keep Growing! Buy!
Hello,Traders!
SILVER shows Smart Money accumulation from the horizontal demand area, with bullish displacement suggesting price will tap into the 5,280$ liquidity pool next. Time Frame 1H.
Buy!
Comment and subscribe to help us grow!
Check out other forecasts below too!
Disclosure: I am part of Trade Nation's Influencer program and receive a monthly fee for using their TradingView charts in my analysis.

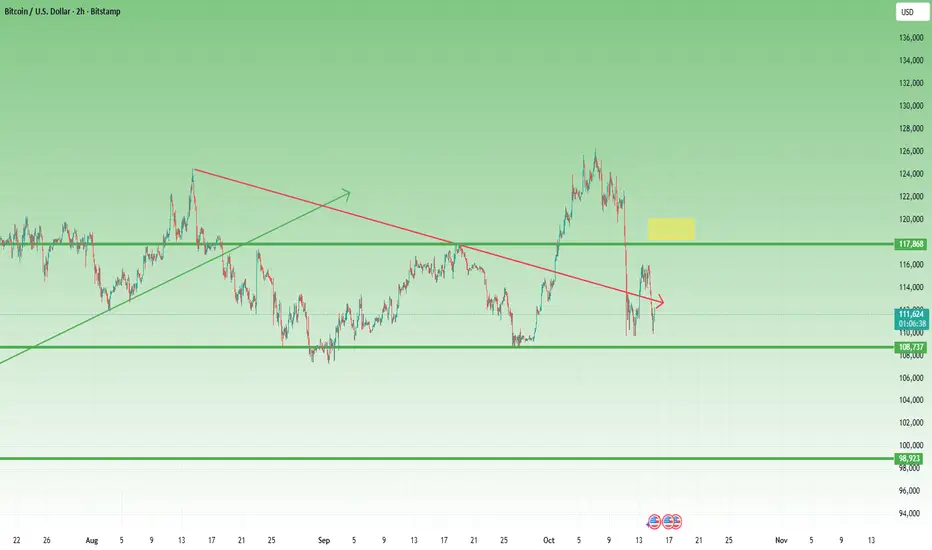
Why This BTC Price Action Doesn’t Inspire ConfidenceIn my yesterday’s analysis, I raised a rhetorical question: I s Bitcoin in a corrective rebound, or are we witnessing a genuine upside reversal?
Even in my Sunday educational post, I mentioned that the whole “ great reset, now we go up ” narrative doesn’t resonate with how I view trading.
At the time of writing, BTC is down again around 112K, after touching once more the 110K support zone — almost like a second chance for those who missed the first dip.
However, this kind of price action is far from encouraging in my opinion.
________________________________________
Technical Picture
• The price reversed before the 118K resistance, forming what can now be viewed as a lower high.
• If the 110K level breaks, the next obvious target remains 100K, both from a psychological and technical perspective.
________________________________________
Trading Plan
My plan is to sell preferably around the recent high, aiming to position with the broader structure rather than chase short-term fluctuations.
BTC still needs to prove it can sustain an uptrend — until then, rallies look like selling opportunities rather than the start of a new bull leg.