Rare Sell Opportunity on Bitcoin , target 114KBitcoin is currently approaching the 124,000 – 124,500 zone, which represents its all-time high and the strongest resistance level the market has ever seen.
From a technical perspective, this zone provides a golden and rare opportunity to enter a short trade, based on the following:
Price reaching an unprecedented all-time high.
Clear overbought signals on momentum indicators (RSI – MACD).
High probability of a significant profit-taking move from these levels.
🎯 Trading Plan:
Short entry: 124,000 – 124,500
Main target: 114,000
Stop-loss: Above 125,000
⚠️ This is not financial advice, but rather a personal technical analysis based on current market conditions.
Signalservice

Bitcoin Harmonic Pattern , Target 105,000On the daily chart of Bitcoin, we can see the formation of a Gartley Pattern, one of the most well-known Harmonic Patterns. These patterns rely on Fibonacci Ratios and are typically used to anticipate a trend reversal after a strong move either upward or downward.
Recently, Bitcoin has reached a very important resistance zone between $120,000 – $121,000. The completion of the Gartley pattern in this zone increases the likelihood of a bearish correction.
Factors supporting a downside move:
Harmonic Pattern – Gartley: Completion at resistance provides a reversal signal.
PRZ (Potential Reversal Zone): Located near $120K.
Technical Indicators:
RSI shows overbought conditions, suggesting buying pressure is weakening.
MACD is close to a bearish crossover, another negative signal.
Volume: Buying volume is declining at recent highs, which often signals a distribution phase by large players and institutions.
📉 Support Levels:
The main target for the pattern is $105,500, a strong support level where price previously rebounded.
🎯 Trading Plan (Expected Scenario):
Potential Entry Zone: Between $120,500 – $121,000 (near resistance).
Targets (Take Profit):
TP1 = $114,000
TP2 = $110,200
TP3 = $105,500 (main target).
Stop Loss: Daily close above $121,800.
✅ Conclusion:
Bitcoin is currently at a very critical level, with the Gartley pattern completing right at resistance, combined with weakening technical indicators and declining volume. This supports the idea that the market may enter a short-to-medium term bearish correction with gradual downside targets ending near $105,500.
At the current zone, this is not considered a safe buying opportunity. Instead, it looks more like a selling opportunity or a case for waiting until price corrects to more favorable levels.
👍 Don’t forget to boost this trading idea if you found it helpful,
and follow me for more daily crypto insights and trade signals.
⚠️ Please note:
This is not financial advice – I’m only sharing my personal trades.
Always do your own research before taking action.
Best of luck 🌹

New ATH, Same Fragility – Why I’m Still Selling Gold RalliesYesterday’s Picture
Gold opened the month with strength, pushing into uncharted territory and printing yet another all-time high, just shy of the 3900 figure. However, momentum faded quickly, and the market corrected lower, currently holding around the 3860 support zone — roughly 300 pips under the peak.
2. Key Question
Has the correction already played out, or are we just at the beginning of a deeper move?
3. Why I See More Downside Ahead
• Fragile bids: Looking back just two sessions, Tuesday’s sharp intraday selloff highlighted how quickly buyers can step aside at these stretched levels.
• Short-term technicals: Price is still above immediate support and the rising trendline, keeping the structure bullish on paper — but this doesn’t erase the vulnerability.
• Risk/reward misbalance: Buying directly into support after a fresh ATH might look attractive, but the risk of a sharp drop outweighs the potential reward.
• Bigger picture context: Even if gold spikes once more to marginal highs, the corrective leg is unlikely to be over — in fact, it may only be starting.
4. Trading Plan
My strategy remains unchanged: sell rallies. I’ll be watching for short-term strength to fade, especially around intraday resistance zones. For me, chasing longs here is not worth the exposure.
5.Final Thoughts
The market remains technically bullish until support breaks, but under the surface, gold is fragile. From my perspective, the real move is still to the downside — and patience will pay off. 🚀

GBP/USD – Friday’s Call Delivered, Now Watching 1.3450 Sell Zone1. Market Recap
In Friday’s analysis, I mentioned that while my 1.3200 medium-term target remains intact, a correction from the 1.3330 zone support was highly likely.
The market delivered exactly that, reversing by around 100 pips since then.
2. Current Setup
Price is now climbing back toward my sell zone above 1.3450. This area is critical for short-term positioning.
3. Trading Plan
• For shorter-term traders: look for sell entries above 1.3450, with targets toward the 1.3330 support zone.
• For swing and medium-term traders: hold positions for a potential extension toward 1.3200.
4. Risk Management
The scenario is invalidated if GBP/USD manages to stabilize above 1.3500, which would suggest stronger bullish momentum.

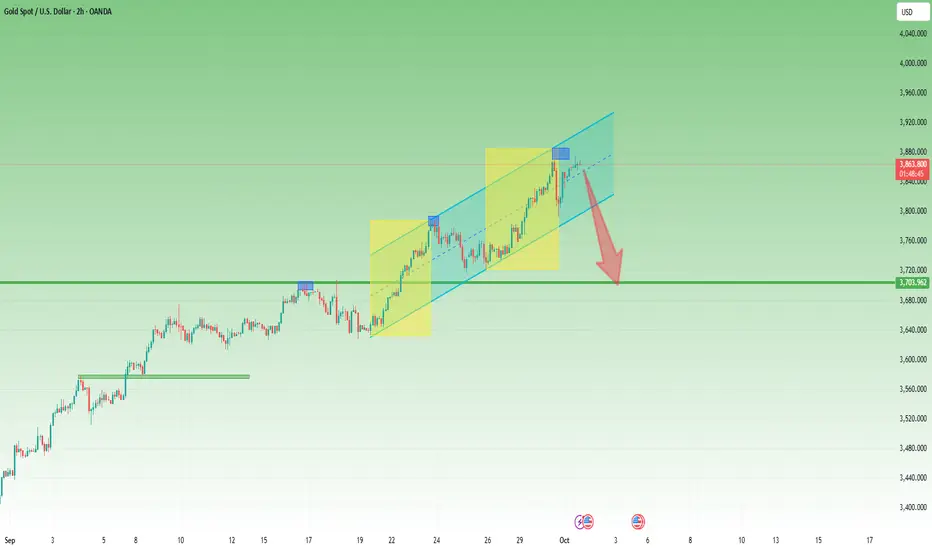
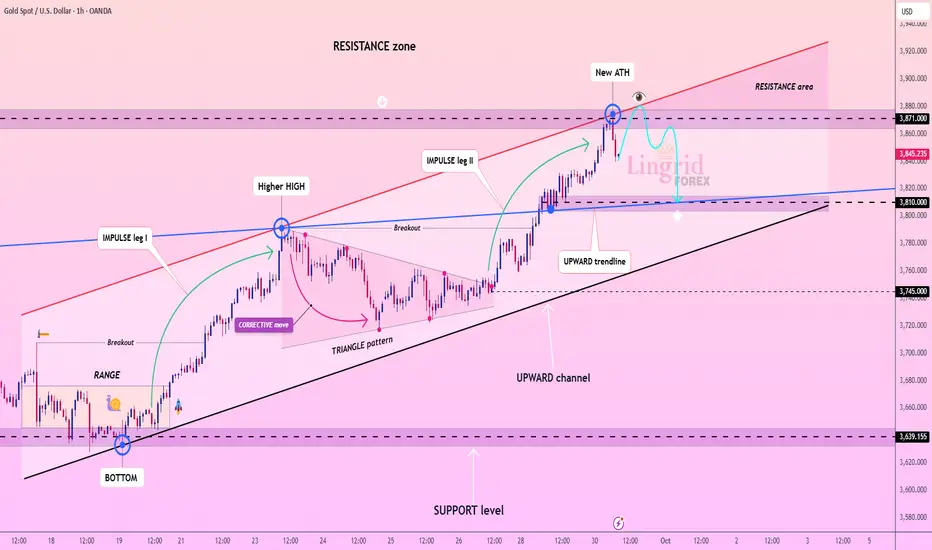
Lingrid | GOLD Channel Breakout: Bullish Rally ContinuesThe price perfectly fulfilled my previous idea . OANDA:XAUUSD continues to show strong bullish structure after breaking out of the consolidation zone and retesting support. Price action is riding the upward channel with higher highs and a clean A-B-C movement confirming the trend continuation. As long as buyers defend the 3,850 zone, the next objective lies toward 3,950 inside the resistance zone. The overall momentum favors trend extension with potential new highs if the breakout sustains.
⚠️ Risks:
Failure to hold above 3,850 could trigger a pullback toward 3,800.
Unexpected USD strength from macro data may cap gold’s upside.
A reversal signal within the resistance zone could limit the bullish breakout.
If this idea resonates with you or you have your own opinion, traders, hit the comments. I’m excited to read your thoughts!

Lingrid | AUDUSD Compression Phase Expansion ExpectedFX:AUDUSD has rebounded strongly from the 0.6523 support zone, forming a bottom and reclaiming the upward trendline. Price action is now consolidating inside an ascending triangle near 0.6620, signaling building bullish pressure. A sustained move above 0.6630 resistance would confirm continuation toward higher levels. Momentum remains favorable as long as 0.6600 holds as support.
⚠️ Risks:
Failure to hold 0.6600 could lead to a retest of the 0.6523 support area.
Breakdown of the ascending triangle may shift bias back to bearish.
Macro-driven USD strength could cap upside momentum despite the local structure.
If this idea resonates with you or you have your own opinion, traders, hit the comments. I’m excited to read your thoughts!

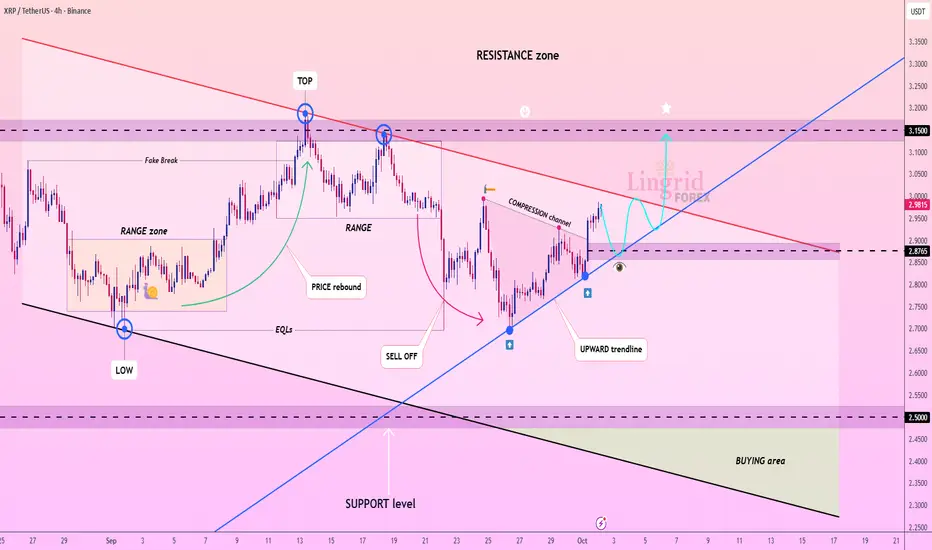
Lingrid | XRPUSDT Channel Break - Upside Momentum PotentialBINANCE:XRPUSDT has rebounded from the 2.8765 zone, aligning with the upward trendline and breaking free from compression structure. Price action now presses toward resistance with the potential to retest the 3.15 area, where prior tops have formed. A sustained hold above 2.90 would strengthen the bullish case for continuation into the resistance zone. Momentum remains constructive, but the structure shows buyers need confirmation at higher levels.
⚠️ Risks:
Rejection below 2.90 could trap longs and lead to a pullback toward 2.50.
Compression breakdown may trigger renewed bearish momentum.
Broader market weakness could cap upside despite local bullish structure.
If this idea resonates with you or you have your own opinion, traders, hit the comments. I’m excited to read your thoughts!
3830: The Line Between Bullish Control and a Waterfall Drop1. Recap of Yesterday’s Key Move
Yesterday was a decisive day for Gold traders, and it perfectly confirmed what I have been pointing out since Monday: at these elevated levels, Gold is extremely vulnerable.
After printing yet another All-Time High overnight, the yellow metal sold off aggressively for nearly 5 hours straight, with losses amounting to almost 800 pips.
Importantly, the bounce came exactly from the 23 September ATH level and by the end of the session, bulls managed to step in and regain control.
________________________________________
2. Overnight Price Action
Overnight, the asian session was once again bullish – Gold reached a fresh ATH at 3875, only to retreat slightly, which for now can be classified as nothing more than a shallow correction.
Despite the recovery, what matters is not the new high, but the fragility revealed during yesterday’s sell-off. Momentum looks stretched, and price action confirms the market’s increasing instability.
________________________________________
3. Technical Outlook
From a structural point of view:
• Price is still contained within the upper bullish channel.
• Bulls have also managed to reclaim the median line, suggesting they are still in control.
• However, the 800-pip collapse proved that even in such a strong uptrend, cracks are starting to show.
Key levels to watch:
• 3830 → if this level breaks, the market could trigger a waterfall of selling.
• 3785-3790 → support that held before, but I believe this time it won’t survive.
• 3700 → the logical corrective target if 3780 is breached.
________________________________________
4. Trading Mindset & Strategy
Yesterday, I couldn’t sell into the initial drop — and that’s fine. Such a move was more about timing luck than pure skill. No frustration, because the analysis was right: fragility is here.
From now on, my plan is clear:
• I’ll be looking for structured patterns with larger targets.
• Minimum: +1000 pips setups.
• Stretch target: +1500 pips.
________________________________________
5. Conclusion
Gold remains in bullish mode on the surface, but yesterday’s sell-off clearly revealed how fragile and overstretched the trend has become.
If 3830 fails, that could be the decisive moment when bulls finally lose control and the long-awaited correction accelerates.
Until then, I will stay patient and disciplined, waiting for the market to provide a clean pattern with a strong risk/reward setup. 🚀
GBPJPY – Calm Before the Storm: 200-Pip Range About to Break1. Market Context
For the past 6 weeks, GBPJPY has been trapped in a narrow 200-pip range between 200.50 and 198.50. This is unusual for such a volatile pair, and historically, when GBPJPY compresses like this, the eventual breakout tends to be explosive.
________________________________________
2. Distribution or Accumulation?
In my view, this is not healthy consolidation but rather distribution. The market looks heavy, and every test of support adds pressure on the downside.
________________________________________
3. Technical Perspective
• The pair is pressing against support.
• A clean break below here opens the door for an immediate 300-pip drop.
• For a larger swing move, the downside target extends much deeper – towards the 188.00 zone, which is the next major support level.
________________________________________
4. Trading Bias
As long as 200.00 holds as resistance, my bias remains bearish.
The longer the range persists, the bigger the breakout that will follow — and in this case, I believe it will be to the downside.
________________________________________
5. Conclusion
GBPJPY has been unusually quiet, but pressure is building. Once support breaks, the move could be fast and violent, in classic GBPJPY style.

Lingrid | AUDCAD Resistance Rejection Short OpportunityFX:AUDCAD faced a strong rejection from the resistance area at 0.9218 and is now turning lower. Price action shows that after a breakout run supported by the upward trendline, momentum failed near the highs, signaling exhaustion. If sellers maintain control below 0.9200, the market is likely to test the 0.9160 level, with potential extension toward 0.9132. The broader structure suggests a corrective phase inside the channel, aligning with bearish bias.
⚠️ Risks:
A recovery above 0.9218 could invalidate the bearish outlook.
Strong AUD performance from macro data might lift the pair again.
Global risk-on sentiment could dampen CAD demand and push price back higher.
If this idea resonates with you or you have your own opinion, traders, hit the comments. I’m excited to read your thoughts!

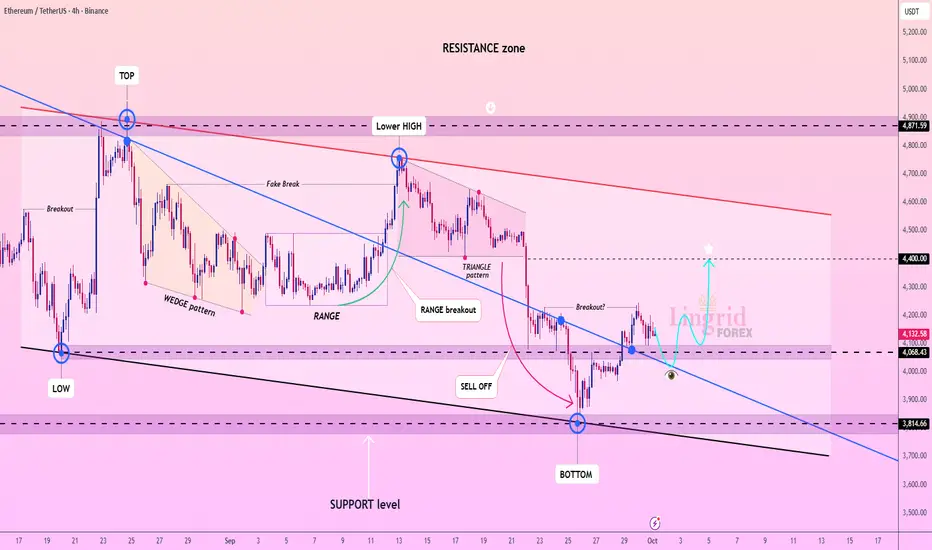
Lingrid | ETHUSDT Structure Break - Potential Bullish SetupBINANCE:ETHUSDT recently found support near 3,815 after a sharp selloff and is now stabilizing above the bottom structure. Price action shows a sequence of lower highs within a descending channel, but the latest rebound hints at a possible reversal. A move toward 4,400 is viable if buyers sustain momentum above 4,000–4,100. The broader context still reflects medium-term weakness unless resistance near 4,300 breaks.
⚠️ Risks:
Failure to hold 4,000 could trigger another retest of 3,815 support.
Macro uncertainty and BTC volatility may weigh on ETH’s recovery.
A rejection near 4,400 could resume the broader downtrend.
If this idea resonates with you or you have your own opinion, traders, hit the comments. I’m excited to read your thoughts!
Daily ETH Signal: Sell Now , target 4000ETH is currently showing signs of strength as it tests the key resistance level around 4150.
the price retest the level
My Personal Short Setup
Entry : Sell Now from current Price 4153
can wait for Price 4180
🎯 Target 1: 4059
🎯 Target 2: 3961
❌ Stop-loss: 4250
👍 Don’t forget to boost this trading idea if you found it helpful,
and follow me for more daily crypto insights and trade signals.
⚠️ Please note:
This is not financial advice – I’m only sharing my personal trades.
Always do your own research before taking action.
Best of luck 🌹

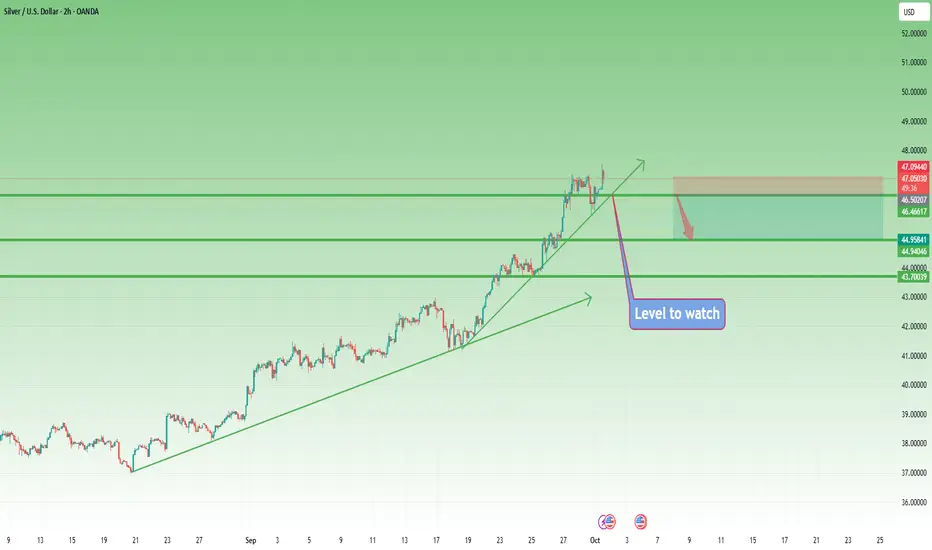
Silver Analysis – Multi-Year Highs but Correction LoomsSeptember has been a remarkable month for Silver, with prices running from the 40 zone all the way to 47.50, marking an impressive 20% gain and printing a new multi-year high.
Just like Gold, the long-term trend remains strongly bullish – no doubts there.
However, also like Gold, the recent rally looks overstretched, and history tells us that sharp corrections often follow such aggressive moves.
Yesterday, after touching above 47, Silver sold off hard and dipped to an intraday low of 45.78. Bulls quickly stepped back in, and overnight the market managed to print new highs around 47.57.
For now, the price remains elevated, but with correction looming, I believe the bearish side will eventually prevail in the short-term.
🔑 Technical Perspective:
• Key support to watch: 46.80.
• If this level fails to hold, we could see a stronger sell-off than yesterday’s, with the most appropriate near-term target sitting around 45.00.
🚀 As always, the market needs to confirm, but at these elevated levels, caution is warranted for late buyers.
Lingrid | EURUSD Previous Day High Resistance Short OpportunityFX:EURUSD is recovering from the recent bottom near 1.1645 after support zone rejection. Price action is moving towards the resistance area around 1.1760, aligned with the upward trendline and previous day high. A rejection at this zone could send the pair back toward 1.1680 support. Broader structure suggests a corrective rally within a bearish framework, leaving downside risks intact unless bulls reclaim higher resistance.
⚠️ Risks:
Break above 1.1760 may shift momentum toward 1.1875.
Strong USD data could accelerate selling pressure.
Unexpected ECB commentary may create volatility against the current bias.
If this idea resonates with you or you have your own opinion, traders, hit the comments. I’m excited to read your thoughts!

Daily Bitcoin Signal: Sell Now , target 110,500Bitcoin is currently showing signs of strength as it tests the key resistance level around 113,000.
A confirmed 1H candle breakout this zone could trigger fresh bearish momentum, opening the door for lower targets in the short term.
My Personal Long Setup
Entry : Sell Now from current Price 112,900
🎯 Target 1: 111,900
🎯 Target 2: 110,600
❌ Stop-loss: 115,500
👍 Don’t forget to boost this trading idea if you found it helpful,
and follow me for more daily crypto insights and trade signals.
⚠️ Please note:
This is not financial advice – I’m only sharing my personal trades.
Always do your own research before taking action.
Best of luck 🌹

Gold – Straight Up, Straight Question1. Yesterday’s Move Recap
Like everyone else these days, I’m trying to make some sense of Gold’s move. Let’s be honest: even if you were extremely bullish, you wouldn’t have expected this kind of vertical line in the past 6 weeks or so.
The market is clearly overextended, and while momentum is impressive, technical traders know what usually follows such parabolic moves.
2. Key Question
Is Gold about to enter a much-needed correction, or can this euphoric rally defy gravity for longer?
3. Technical Observations
• Since the 2700 ATH zone in September, Gold has been carving out a repeating rhythm:
o Monday: explosive new ATH push
o Tuesday: spikes and volatility
o End of the week: corrective drop
• The last strong move (Friday the 19th → Wednesday the 23rd) measured around 1600 pips.
• If we project a similar extension from last Friday’s start, the measured move points toward 3885–3890 — right at the top of the newly formed channel.
This zone is not a certainty but an interesting confluence of measured move symmetry and technical channel resistance.
4. Why I Expect a Correction
• Gold has recently shown a tendency to correct after Wednesday.
• We are already in stretched territory with limited room for new buyers at these levels.
• Corrections are not only natural but necessary for healthy continuation.
5. Trading Plan
For me, the only trade that makes sense here is shorting spikes into resistance — anticipating a strong correction. I’m currently flat, but if we see exhaustion signs near 3885–3890, I’ll consider positioning short. The same strategy worked well last time,so...
6. Closing Thought
Patterns don’t always repeat perfectly, but they rhyme. If Gold follows its recent script, a midweek top followed by correction wouldn’t surprise me at all. 🚀

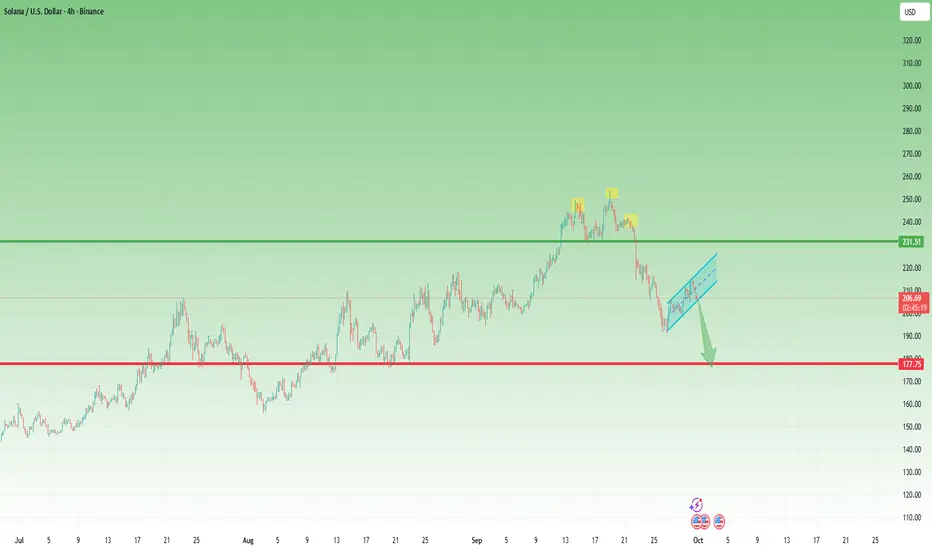
Solana: From 254 Highs Back to the 200 Line – What’s Next?At the end of August, I wrote that as long as 190 remained intact, Solana had room to rise toward 250, and I suggested a buy around the 200 level. That trade worked beautifully, with price reaching as high as 254.
From there, Solana started to roll over. At first, it looked like a normal correction, but the picture changed after a weak bounce attempt. Price broke decisively below 230, and the recent low was set right back at 190.
Currently, Solana is recovering once again. However, the structure of this bounce looks corrective in nature, forming what appears to be a bearish flag.
🔑 Key levels to watch:
• A break below the flag’s support – and more importantly below 200 – would likely trigger another leg down.
• In that case, the market could head toward a 175–180 major support zone, which is the next critical area for buyers to defend.
Until then, the bias remains cautious: Solana must prove it can break free from the corrective structure before bulls can regain control. 🚀
Lingrid | GOLD Price Surge Cooling Short-Term PullbackThe price perfectly fulfilled my previous idea . OANDA:XAUUSD has printed a new ATH near 3,870 after completing two strong impulse legs within the upward channel. Price action is showing signs of exhaustion at the resistance zone, suggesting a short-term retracement phase is underway. A pullback toward 3,800 support is possible before any fresh attempt higher. The broader structure still favors bullish continuation as long as the channel trendline holds.
⚠️ Risks:
A sustained breakout above 3,870 could invalidate the retracement outlook.
U.S. economic data could shift sentiment abruptly.
Rising Treasury yields may cap gold’s upside momentum in the near term.
If this idea resonates with you or you have your own opinion, traders, hit the comments. I’m excited to read your thoughts!
Lingrid | EURJPY Trendline Violation Downside MoveThe price perfectly fulfilled my previous idea . FX:EURJPY has reached the resistance zone near 175.000 after a strong upward channel move from the bottom at 171.130. Price action shows consolidation just below the top, with a corrective projection suggesting a pullback. If the pair fails to hold above 174.500, a decline toward 173.150 support could unfold since it broke and closed below the upward trendline. Broader picture suggest that market reached previous year high that may lead to short-term pullback.
⚠️ Risks:
Breakout above 175.000 would invalidate the pullback and extend bullish momentum.
Unexpected ECB or BoJ policy comments could trigger sharp volatility.
Stronger yen flows from risk-off sentiment may accelerate downside pressure.
If this idea resonates with you or you have your own opinion, traders, hit the comments. I’m excited to read your thoughts!

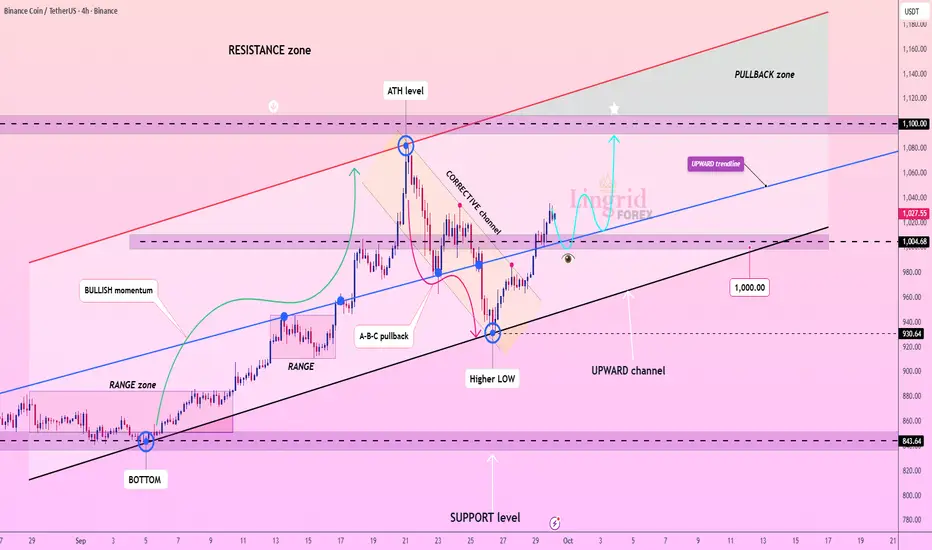
Lingrid | BNBUSDT Targeting ATH Level After PullbackThe price perfectly fulfilled my previous idea . BINANCE:BNBUSDT is trading inside an upward channel after a corrective pullback from the ATH level near 1,080. Price action shows a rebound from a higher low around 1,000, confirming structural support. If buyers defend the 1,000–1,010 zone, momentum could extend toward the pullback area at 1,100+. Broader context supports bullish continuation as long as the channel trendline holds.
⚠️ Risks:
Failure to maintain above 1,000 could invite deeper correction toward 930 support.
Strong USD strength or negative market sentiment may weigh on upside.
Macro-driven volatility around regulatory or Binance-related news could trigger sharp moves
If this idea resonates with you or you have your own opinion, traders, hit the comments. I’m excited to read your thoughts!
Daily Bitcoin Signal: Sell , target 110KBitcoin is currently showing signs of strength as it tests the key resistance level around 113,500.
A confirmed 1H candle breakout this zone could trigger fresh bearish momentum, opening the door for lower targets in the short term.
My Personal Long Setup
If the price breaks and closes a 1H candle under 113,500, I will enter a sell position.
🎯 Target 1: 112,000
🎯 Target 2: 110,000
❌ Stop-loss: 115,200
👍 Don’t forget to boost this trading idea if you found it helpful,
and follow me for more daily crypto insights and trade setups.
⚠️ Please note:
This is not financial advice – I’m only sharing my personal trades.
Always do your own research before taking action.
Best of luck 🌹

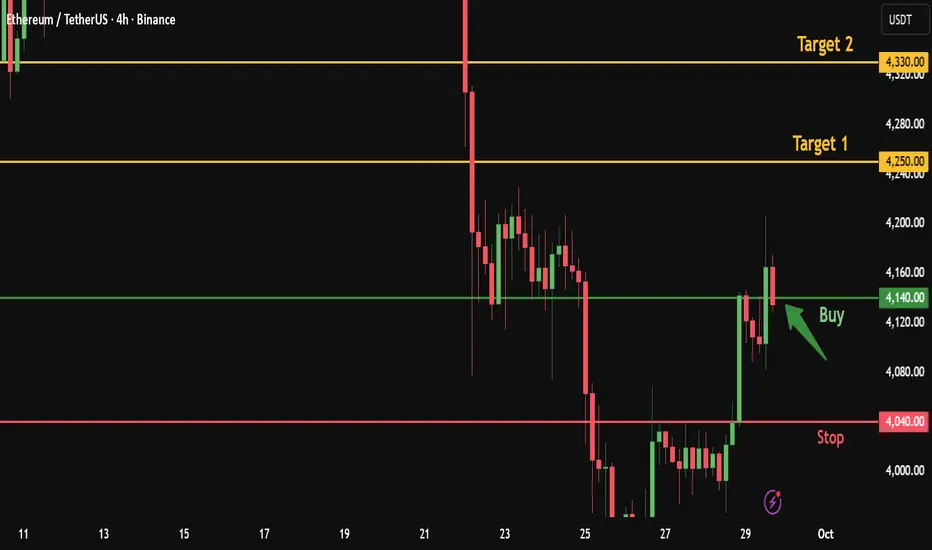
Ethereum Quick Buy from Broken Resistance – Targeting 4330After Ethereum broke the 4140 resistance with a bullish 4H candle and reached 4205, the price has now retested the broken resistance at 4140.
This level acts as a strong entry point for a long position, aiming for higher targets.
Here’s my personal trade plan:
✅ Entry : Buy from current price 4140
🎯 Target 1: 4250
🎯 Target 2: 4330
Stop-loss: 4040
👍 Don’t forget to boost this trading idea if you found it helpful,
and follow me for more daily crypto insights and trade signals.
Please note:
This is not financial advice – I’m only sharing my personal trades.
Always do your own research before taking action.
Best of luck 🌹
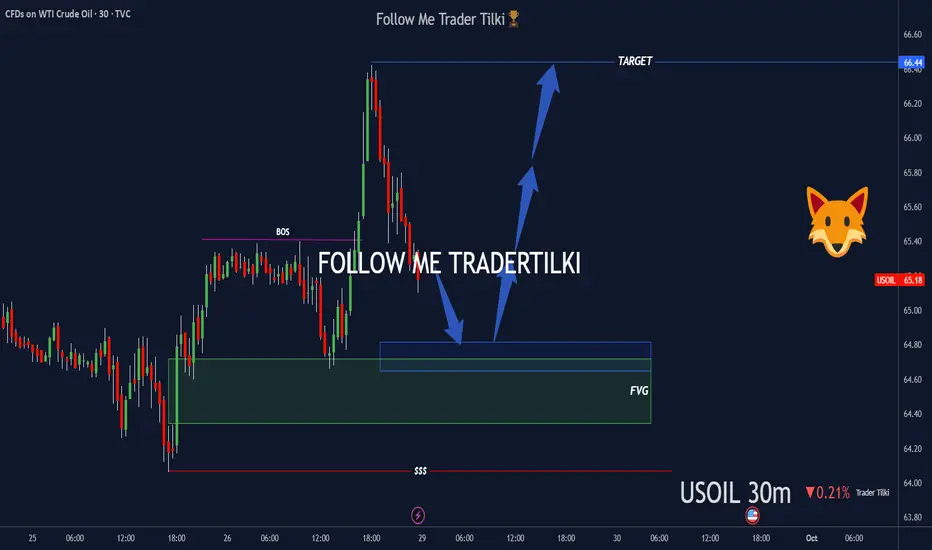
30-minute USOIL Key Buy Zones AnalysisHello Guys,
I’ve prepared a USOIL analysis for you.
I’m watching two buy zones on USOIL:
🔹 First buy zone: 64.70
🔹 Second buy zone: 64.35 or 64,00
From these levels, I’ll definitely open buy positions and take my shot.
🎯 Target level: 66.40
Every like is my biggest motivation to keep sharing these analyses.
Thanks to everyone supporting me!