FET: Still on My Radar, Still Looking BullishA few weeks ago, I pointed out that FET is one of the alts firmly on my radar and that I was looking to add more to my bag. The market has delivered exactly what I wanted to see:
• The coin reinforced support just above 0.55, proving that buyers are very active at this level.
• From there, FET has started to rise again, showing constructive price action
This is in line with my broader outlook from the Total Excluding Top 10 analysis , where I argued that acceleration to the upside could be the next big move for alts.
Trading Plan
For FET specifically, the picture is clear:
• As long as 0.55 holds, dips should be treated as buying opportunities.
• The next logical target in such a breakout scenario is 1 USD, which is both a round psychological level and a strong resistance from the past.
🚀 Strategy: Buy dips against 0.55. Targeting 1 USD in the coming wave.
Signalservice

Lingrid | BNBUSDT Trend Continuation Pattern Completed. BuyBINANCE:BNBUSDT is trading within a strong upward channel after rebounding from the 865 support zone, confirming bullish momentum. The chart shows a sequence of higher lows and a sustained climb along the trendline, highlighting the strength of buyers. Price is now targeting the 932 level, with potential extension toward the 970 resistance area if momentum holds. As long as the upward channel remains intact, the probability favors continuation rather than reversal. A rejection at mid-channel could still provide consolidation before the next leg higher. Broader structure suggests that bulls are preparing to challenge overhead resistance zones.
💡 Risks:
A break below 865 would invalidate the bullish channel and expose downside toward 748.
Upcoming CPI data could boost USD strength, weighing on crypto market sentiment.
A sudden shift in Fed guidance or risk-off sentiment in equities could stall the breakout attempt.
If this idea resonates with you or you have your own opinion, traders, hit the comments. I’m excited to read your thoughts!

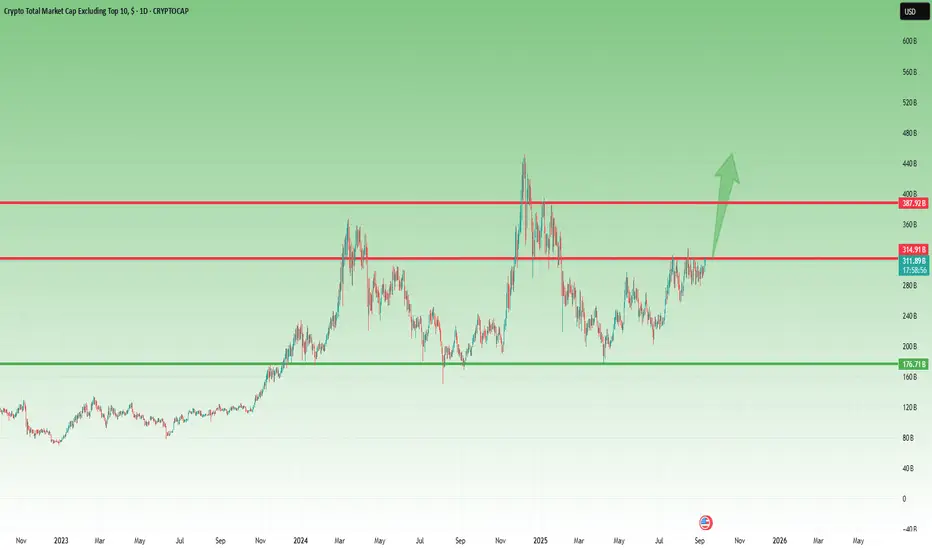
Smaller alts, a constructive outlookThe Big Question: Will We Finally See Moves on Alts?
The past month – or rather the past 6 weeks – has been nothing short of frustrating for altcoin traders. Most individual charts looked stagnant, choppy, or simply lacked momentum. But zooming out to the Total chart, the picture is much clearer, and the answer looks like a confident YES .
What the Chart Tells Us
• After the December 2024 top, we witnessed a deep correction, which finally bottomed on 7 April, during the infamous tariff mania .
• From there, an initial leg up developed, reaching resistance around the 300B mark.
• The correction that followed was healthy: it established a higher low, confirming that the bottom was not just a dead cat bounce.
• The next attempt pushed even deeper into resistance, creating a higher high – a strong bullish sign.
• Since the end of July, things have turned even more interesting: the market has been pressing hard into resistance, and we could even argue the formation of a continuation Head & Shoulders setup.
Where We Are Now
At the time of posting, the Total chart is testing resistance at ~310B once again. The more this level gets tested, the weaker it becomes. A breakout from here doesn’t just look possible – it looks almost unavoidable .
What to Expect Next
When that resistance finally breaks, the tension built up over months of sideways action – and the frustration of traders who have been waiting for more than half a year – will likely unleash a strong acceleration.
In my view, we could easily see a 50% rally, taking the Total chart back to the December 2024 highs.
🚀 The stage is set. All that’s missing is the trigger.
Bitcoin’s Triple Test: 110K Options Wall, 105K Liquidity Barrier
Bitcoin is currently navigating through a volatile zone crowded with critical levels. Here’s what I’m tracking closely:
Key Levels to Watch
$110K Options Wall
A dense cluster of open options layers at this zone, signaling potential sell pressure from smart money if breached.
$105K On-Chain Liquidity Barrier
Heavy order flow and visible support orders are stacked here — failure to defend this zone may trigger a breakdown.
$95K Lifeline Support
A psychological base zone with historical significance that could act as the last line of defense for bulls.
What These Signals Mean
A firm hold above $110K could propel BTC into a new breakout phase — possibly toward $118K+.
A dip below $105K might trigger a swift pullback as liquidity dries up.
Breach under $95K could indicate a deeper correction zone, realigning market sentiment.
My View
I track liquidity dynamics and order flow activity, not just charts — these levels are where real capital meets psychology.
The question:
Are bulls strong enough to defend $110K, or are we gearing for a liquidation cascade toward $105K or lower?
✅ Write a comment with your favorite altcoin hit the like button, and I'll provide my analysis in the reply
My analyses are personal opinions, not trade setups.
Thank you for your support, and I wish you successful trades 🌹

WCT: short-term trade from a Strong Support Zone
BINANCE:WCTUSDT
In this green zone, large buy orders from whales and market makers were detected for WCT, totaling 3 million tokens.
This area also represents a very strong support level for the price.
WCT has exhausted its recent downtrend and is showing signs of being oversold on technical indicators, which signals a potential upward correction.
Entry Method:
A buy entry can be made in in the green zone where whale orders and liquidity are concentrated.
✅ Entry Zone : 0.2850 to 0.2810
Targets:
🎯 TP1: 0.2808
🎯 TP2: 0.2939
Note: If you wish, you can hold for larger targets,
but these are quick targets for those who prefer short-term trades.
Good luck and may you always be profitable!
please note :
this opportunity is not financial advice — it reflects only my personal opinion.
PLEASE always do your own research before trading
A 10-year veteran in crypto. I hunt for hidden gems and deliver concise opportunities directly. Follow for high-value insights.
Thank you 🌹

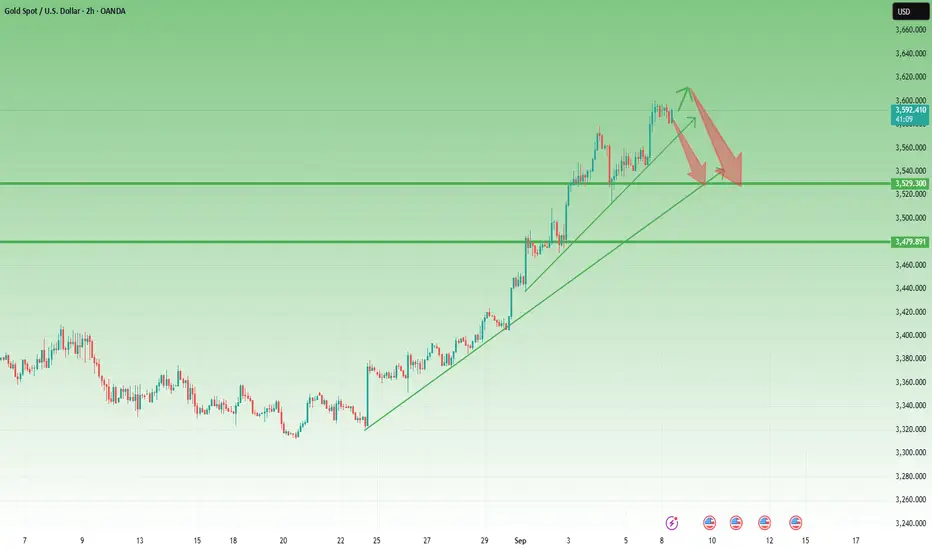
Fearless Bulls, Straight-Line Rise – But Mean Reversion CallsLast week Gold bulls were fearless – we witnessed three all-time highs within a single trading week. The market closed on Friday just below 3600, locking in an impressive 1,500 pips weekly gain. There is no doubt: the trend remains firmly bullish.
But let’s add some perspective. Even if XAUUSD were to drop 1,000 pips from current levels, that move would count as a minor correction within the dominant bullish trend. That’s how extended this rally has become.
📌 Another element supporting the correction scenario is the parabolic nature of the latest move. From the 3300 zone, the rally has been almost a straight vertical line, leaving gold strongly overextended and far away from the mean. Markets rarely sustain such deviation without at least a temporary pullback.
🔑 Trading Plan: While acknowledging the risks of counter-trend setups, I will look for short opportunities. In my view, there is more room to the downside than upside in the short term.
Target for correction: 3530 confluence support zone.
As always, the trend is still bullish, but corrections are part of the game. A disciplined trader must know when to step aside – and when to take the contrarian shot. 🚀
Gold can continue to rise if it retraces support levelGold has been hitting new highs recently, primarily driven by expectations of a Federal Reserve rate cut and risk aversion stemming from tariffs and the US economic outlook.
Last Friday, the unexpected NFP data pushed gold prices above the 3,600 mark.
Overall, we still underestimated the upward potential of gold and the impact of multiple data that are bullish for gold.
Because of the surprise of NFP data, the market is now evaluating whether the interest rate cut in September will be 25 basis points or 50 basis points, which will inevitably intensify the bullish sentiment. Therefore, in terms of strategy, we are mainly long, and the pullback support is an opportunity.
Gold re-entered the 3,600 level at the open today, trading around 3,620. Next, we will focus on two key levels: 3,600 and 3,580.
The Fibonacci retracement of the 3,510-3,622 uptrend shows that 3,600 is at 0.786, while 3,580 is at 0.618, both of which represent previous highs and support levels. Therefore, as long as it falls back to these two positions and stabilizes today, you can enter the market and go long on gold.
However, remember one thing, once it falls below 3580, don't go long.
DXY Analysis – Are Bad News Already Priced In?Since Trump entered the White House, the U.S. Dollar has taken a hard hit against its major counterparts, losing more than 10% overall.
But looking closer at the chart, we see a different story: since the April low around 97.80, the DXY has been stuck in a range-bound pattern, with the exception of July’s dip that was quickly reversed.
Lately, the USD has faced strong headwinds:
• Two weak NFP reports in a row.
• The Fed hinting at rate cuts.
• A constant flow of bearish headlines.
And yet, the Dollar did not collapse to fresh lows — instead, it simply revisited the same levels as before. This is a classic market signal that bad news may already be priced in.
From a technical standpoint, August was nothing but an annoying tight range:
• Support around 97.50.
• Resistance near 98.50.
Now, although the index looks like it’s breaking lower, I suspect this is another false breakdown, one that could be reversed quickly. If that plays out, the stage is set for a push higher — potentially to the 100 zone, a clean 3% rise from current levels.
Such a move would naturally translate into pressure on the majors:
• EUR/USD could slide back toward 1.14.
• GBP/USD could retreat near 1.35.
For now, I’m watching closely for reversal signals. The market has punished the USD for months, but if sellers are exhausted, the Dollar may surprise to the upside. 🚀

Silver | H4 Double Top | GTradingMethod
🧐 Market Overview:
All my variables have been met.
Some of the variables I look for are as follows:
- RSI divergence
- Lower volume on top 2 (In this case JOLTS came out, which causes an exception to the volume rule)
- Attack candle closes in range
Opened a short position on Silver.
📊 Trade Plan:
Risk/Reward: 3.9
🎯 Entry: 41.29
🛑 Stop Loss: 41.67
💰 Take Profit 1 (50%): 39.93
💰 Take Profit 2 (50%): 39.34
💡 GTradingMethod Tip:
Sometimes news events (like JOLTS) can disrupt normal volume behavior. That’s why it’s key to use multiple variables together, not rely on just one signal.
🙏 Thanks for checking out my post!
Make sure to follow me to catch the next idea and please share your thoughts — I’d love to hear them.
📌 Please note:
This is not financial advice. This content is to track my trading journey and for educational purposes only.

Lingrid | GOLD Weekly Market Outlook: Fed Cut Bets Drive Rally ?OANDA:XAUUSD surged Friday after disappointing payroll data showing just 22K jobs added versus 75K expected, solidifying Fed rate cut expectations at 87.8% probability for September's meeting. The precious metal has already hit record highs above $3,500, gaining over 30% year-to-date as weakening labor conditions fuel aggressive easing bets.
The 4-hour chart reveals gold touched above the $3,600 resistance zone with bullish momentum intact. If the market pulls back then there's 38.2% fibo retracement level to consider. Overall gain of 4.75% in one week suggests minor consolidation might occur before targeting the upper resistance around $3,650. The ascending channel remains unbroken, supporting continued upward movement.
The broader perspective shows gold emerging from a prolonged consolidation phase, with the recent breakout confirming a major $3,500 level. Gold initially demonstrated its first impulse leg, then moved sideways for four months, and is now in the process of forming its second impulse leg, which will end at around $3,660.
Some economists now debate whether the Fed might deliver a jumbo 50-basis-point cut given consecutive weak employment reports, which could propel gold toward the $3,660-3,700 correction zone upper boundary. Key support lies at $3500-3530, while sustained weakness could test the major trendline near $3,450.
If this idea resonates with you or you have your own opinion, traders, hit the comments. I’m excited to read your thoughts!

Lingrid | EURUSD Upward Continuation Following Support RejectionFX:EURUSD is pushing higher within an established upward channel after rebounding strongly from the support zone. The structure shows consolidation breakouts followed by impulse legs, reinforcing bullish momentum. As long as price holds above the 1.1700 support, the setup favors further gains toward the upper resistance. This move aligns with the broader channel trajectory targeting 1.1788 near the resistance zone.
📉 Key Levels
Buy trigger: Rejection 1.1700 with sustained momentum
Buy zone: 1.1700 – 1.1710 accumulation area
Target: 1.1788 zone
Invalidation: Breakdown below 1.1700 support
💡 Risks
A sudden USD rebound driven by CPI data could weigh on EURUSD.
Failure to hold above the 1.1700 pivot would invalidate the bullish structure.
ECB policy tone shifts or stronger US yields may dampen bullish momentum.
If this idea resonates with you or you have your own opinion, traders, hit the comments. I’m excited to read your thoughts!

Lingrid | BTCUSDT Bottom Pattern Complete - Long Opportunity?BINANCE:BTCUSDT broke above a corrective channel after multiple rejections near the support zone. The chart shows a descending structure with repeated lower highs and lows, guided by the downward trendline. However price broke and closed above it. the market potentially bottomed around $108,000 support level. As long as price holds this support, a rebound toward $117,300 becomes the next potential move. The broader picture suggests a retest of resistance if momentum shifts upward from the current zone.
📉 Key Levels
Buy trigger: Hold above $110,000 support
Buy zone: $108,000–$110,000 accumulation area
Target: $117,300 resistance zone
Invalidation: Breakdown below $108,000
💡 Risks
Failure to hold $108,000 support could trigger deeper losses.
Macroeconomic factors (Fed rate decisions, inflation data) may pressure sentiment.
Sustained strength in the dollar index could cap bullish continuation.
If this idea resonates with you or you have your own opinion, traders, hit the comments. I’m excited to read your thoughts!

ETH to $5,000 - Whales Are Withdrawing & Storing in Cold WalletsEthereum , After ETH failed to break the strong support around $4,000 – $4,100,
a double bottom pattern has formed, signaling the beginning of a potential major rally toward $5,000.
What strengthens this bullish outlook is the recent on-chain and exchange data:
Ethereum balances on major exchanges like Binance and Coinbase have dropped significantly.
Between August 23 and September 5:
Around 700,000 ETH left Binance
Around 900,000 ETH left Coinbase
In total, exchange reserves dropped by more than 2.6 million ETH over the last two months.
This massive decline in ETH reserves usually means that investors are moving coins into private wallets for long-term holding — an accumulation signal, not selling.
When exchange supply shrinks while demand remains steady (or increases), it often triggers a Supply Shock, pushing prices higher.
What does this mean?
➡️ Big players and whales are withdrawing ETH into cold storage.
➡️ This reduces the immediate sell-side liquidity and opens the door for a potential Supply Shock.
With lower supply and strong demand (especially with Ethereum upgrades and growing institutional interest), the natural outcome is: higher prices.
🎯 Logical next target = $5,000
Reminder:
The market is always driven by supply, demand, and whale behavior. That’s why liquidity flow is often more important than any indicator.
Question for you:
Do you see this exchange outflow as a clear sign of an upcoming rally?
Or do we still need confirmation on the chart first
✅ Write a comment with your favorite altcoin hit the like button, and I'll provide my analysis in the reply. Trading is simpler with the right coaching.
My analyses are personal opinions, not trade setups.
Thank you for your support, and I wish you successful trades 🌹

Lingrid | AUDUSD Bullish Continuation Potential The price perfectly fulfilled my previous idea . OANDA:AUDUSD is consolidating inside an upward channel after rejecting resistance near 0.6600. The structure shows a corrective pullback into the 0.6515–0.6520 zone while holding above the rising support trendline. If buyers defend this zone, price could extend back toward 0.6560. Momentum remains bullish as long as the higher-low structure is respected.
📉 Key Levels
Buy trigger: Rebound from 0.6520 support
Buy zone: 0.6515–0.6520
Target: 0.6560
Invalidation: Break below 0.6482
💡 Risks
A breakdown below 0.6482 would signal bearish reversal against the channel.
USD macro data surprises may trigger volatility against the bias.
Global risk sentiment shifts could weaken AUD momentum.
If this idea resonates with you or you have your own opinion, traders, hit the comments. I’m excited to read your thoughts!

Lingrid | DOGEUSDT Sideways Movement: Accumulation PhaseBINANCE:DOGEUSDT is pressing within a descending structure after repeated rejections from the resistance trendline. However the market consolidated near channel border. Price action shows lower highs and lower lows forming inside a clear downward channel, but overall trend remains sideways. As long as the 0.2000 support holds, a potential rebound into the 0.2420–0.2670 zone could unfold. Momentum remains compressed, but a break of structure could trigger a sharper bullish response.
📉 Key Levels
Buy trigger: Break above the descending trendline and confirmation above 0.2200
Buy zone: Accumulation around 0.2000–0.2100
Target: 0.2420–0.2670 zone
Invalidation: Breakdown below 0.2000
💡 Risks
Sustained weakness in overall crypto market could drag DOGE lower.
Failure to defend the 0.2000 support may trigger deeper downside.
Broader macro headwinds and low liquidity could increase volatility.
If this idea resonates with you or you have your own opinion, traders, hit the comments. I’m excited to read your thoughts!

Silver | H1 Head and Shoulders | GTradingMethodHello Traders.
Welcome to today's trade idea by GTradingMethod.
🧐 Market Overview:
I’m watching silver closely for a potential short setup. Price action suggests a possible head and shoulders formation, but I’m still waiting for confirmation from key variables before committing. For example:
- I’d like to see the current 1H candle close within my range
- Lower volume on the right shoulder compared to the left.
📊 Trade Plan:
Risk/reward = 3.0
Entry price = 40.88
Stop loss price = 41.14
Take profit level 1 (50%) = 40.17
Take profit level 2 (50%) = 39.77
💡 GTradingMethod Tip:
Patience is a trading edge. Waiting for confirmation before entering means fewer trades, but higher-quality ones.
🙏 Thanks for checking out my post!
Make sure to follow me to catch the next idea and please share your thoughts – I would like to hear them.
📌 Please note:
This is not financial advice. This content is to track my trading journey and for educational purposes only.

Lingrid | GOLD Employment Data Play - Long OpportunityOANDA:XAUUSD is climbing inside an upward channel, bouncing steadily from support and pushing through recent resistance with bullish momentum. The structure shows higher highs and higher lows, confirming the trend continuation bias. A clean hold above 3,500 keeps the path open for another push higher. Momentum favors retesting the resistance zone, where a breakout could unlock more upside potential.
📉 Key Levels
Buy trigger: Break above 3,505
Buy zone: 3,500–3,520 support retest
Target: 3,600–3,615 zone
Invalidation: Break below 3,460 support
💡 Risks
Stronger-than-expected NFP data today could fuel USD strength and pressure gold lower.
Failure to hold the 3,505 support may shift momentum to the downside.
Geopolitical or macro shifts driving risk-on sentiment could reduce safe-haven demand for gold.
If this idea resonates with you or you have your own opinion, traders, hit the comments. I’m excited to read your thoughts!

Lingrid | EURJPY Consolidation Zone Breakout. LongFX:EURJPY is pressing higher after breaking above the recent consolidation range and retesting the breakout level. The pair is holding inside an upward channel structure, with higher lows supporting bullish momentum. As long as price sustains above 172.50, continuation toward the 174.00 resistance looks likely. A broader bullish pattern remains intact, favoring further upside if the breakout holds.
📉 Key Levels
Buy trigger: Sustained hold above 172.50
Buy zone: 172.50 – 172.70
Target: 174.00
Invalidation: Break below 172.00
💡 Risks
A sharp reversal in yen strength due to risk-off sentiment could weigh on bullish continuation.
ECB or BoJ policy updates could trigger volatility against the technical setup.
Failure to hold above 172.50 may force a retest of deeper support near 172.00.
If this idea resonates with you or you have your own opinion, traders, hit the comments. I’m excited to read your thoughts!

Lingrid | TONUSDT Approaching Psychological Level. Potential BuyOKX:TONUSDT is trading inside a downward channel after repeated rejections at the 3.73–3.75 resistance zone. The structure shows a corrective pattern with a recent breakout attempt that failed to gain momentum. As long as price hovers near the 3.00 level, liquidity pool below and support demand may provide a potential springboard. A rebound from this area could trigger a surge back toward the 3.50 zone.
📉 Key Levels
Buy trigger: rejection 3.00 with volume confirmation
Buy zone: 2.97–3.00 support demand
Target: 3.35 resistance zone
Invalidation: Sustained drop below 3.00
💡 Risks
Breakdown of support below 3.00 could extend losses toward the 2.80–2.85 range.
Broader market weakness in Bitcoin or Ethereum may cap recovery attempts.
Macro factors, such as regulatory news or liquidity shifts, could increase volatility.
If this idea resonates with you or you have your own opinion, traders, hit the comments. I’m excited to read your thoughts!

S&P500 | Daily Double Top | GTradingMethodHello Traders.
Welcome to today's trade idea by GTradingMethod.
🧐 Market Overview:
I’ve opened a short on the cash500 (S&P 500) at 6521. All GTradingMethod variables have been met, which means this trade setup qualifies under my system.
Additional confluences suggesting weaker buying strength include:
- RSI making lower highs while price pushed higher highs.
- Volume tapering off toward the latter part of the rally.
- MACD on sell signal
The only hesitation is that money flows have not decreased in the later stages of this move — but rules are rules. My edge is probability-based, so when my variables align, I must take the trade consistently.
📊 Trade Plan:
Risk/reward = 9.2
Entry price = 6520
Stop loss price = 6544
Take profit level 1 (50%) = 6370
Take profit level 2 (50%) = 6215
💡 GTradingMethod Tip:
A high RR doesn’t make a trade safer — it simply reflects how far the market could move relative to your risk. Always focus on process and probability, not just the potential payout.
🙏 Thanks for checking out my post!
Make sure to follow me to catch the next idea and please share your thoughts - I would like to hear them.
📌 Please note:
This is not financial advice. This content is to track my trading journey and for educational purposes only.

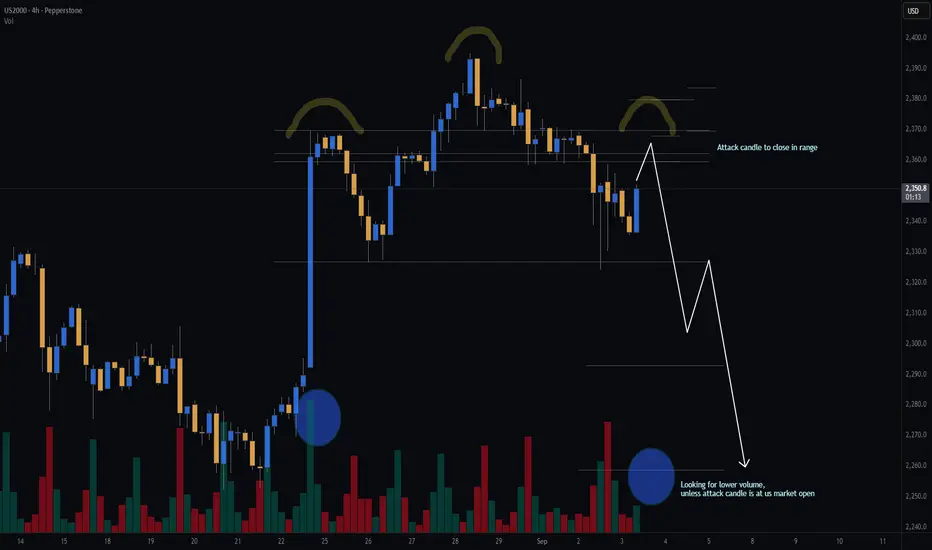
Russel 2000 | H4 Head and Shoulders | GTradingMethodHello Traders.
Welcome to today's trade idea by GTradingMethod.
🧐 Market Overview:
Since April 2025, this rally has been powering higher, leaving little room for pullbacks. But momentum is starting to show cracks — indicators are flashing signs of exhaustion. This doesn’t mean a sharp drop is guaranteed; markets often pause and drift sideways to shake off overbought pressure.
What I’m watching closely now is whether a head and shoulders pattern takes shape. If price steps into and closes in my entry zone, it could mark the start of a deeper pullback, but confirmation is key before jumping in.
📊 Trade Plan:
Risk/Reward: 3.9
Entry: 2,359.6
Stop Loss: 2,379.7
Take Profit 1 (50%): 2,292.9
Take Profit 2 (50%): 2,258.7
💡 GTradingMethod Tip:
Patience is a trading edge. Waiting for confirmation keeps you aligned with probability and protects you from unnecessary losses.
🙏 Thanks for checking out my post!
Make sure to follow me to catch the next idea and please share your thoughts - I would like to hear them.
📌 Please note:
This is not financial advice. This content is to track my trading journey and for educational purposes only.
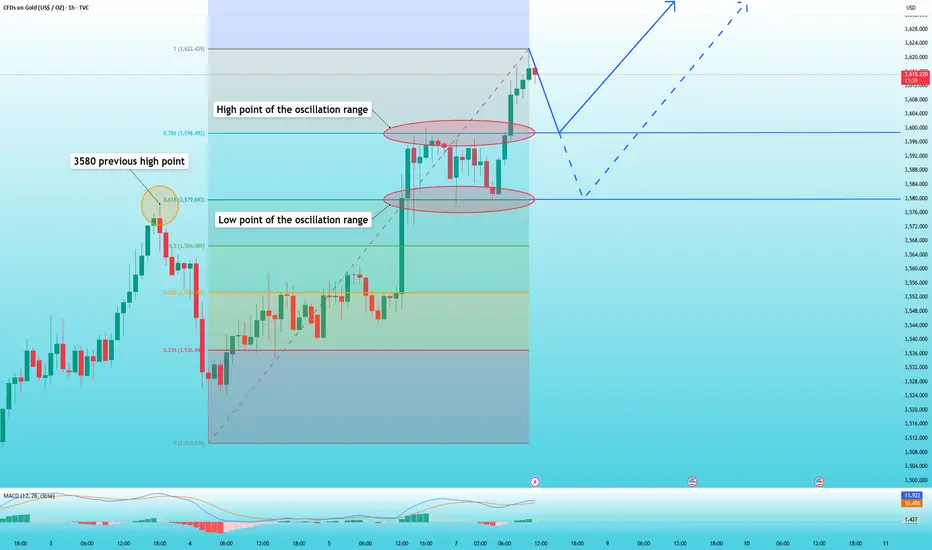
XAUUSD Analysis – Buyers Keep Stepping InIn yesterday’s analysis, I mentioned that Gold looked overstretched, with high chances of a continuation of the correction after the recent 3579 ATH.
During the day, price rejected my selling zone twice, and once more overnight. However, buyers kept stepping in, forming higher lows and pushing price back toward the 3560 resistance zone. This behavior signals upward pressure.
If this resistance finally breaks, the probability of seeing yet another ATH towards 3600 increases significantly.
For now, I’m out of the market, with but looking to buy if buying pressure persists

Rebound or Trap? Why I’m Selling RalliesYesterday’s Move
After printing a fresh ATH, profit-taking started late in the New York session. This was followed by stronger selling pressure during the Asian hours, which dragged the price overnight down to 3510. Currently, we see a rebound, with price trading around 3530.
Key Question
Is this rebound the start of a recovery—or just a pause before another leg down?
Why I Expect the Correction to Continue
- The market sold off 650 pips from the new ATH, confirming a local top.
- Momentum becomes fragile after 2k pips rise in just 10 days
- Selling pressure could easily return, especially if buyers struggle to hold above 3550.
Trading Plan
I’ll be looking to sell rallies against the recent top, targeting first the 3500 psychological level, and then the 3470 technical confluence support.
