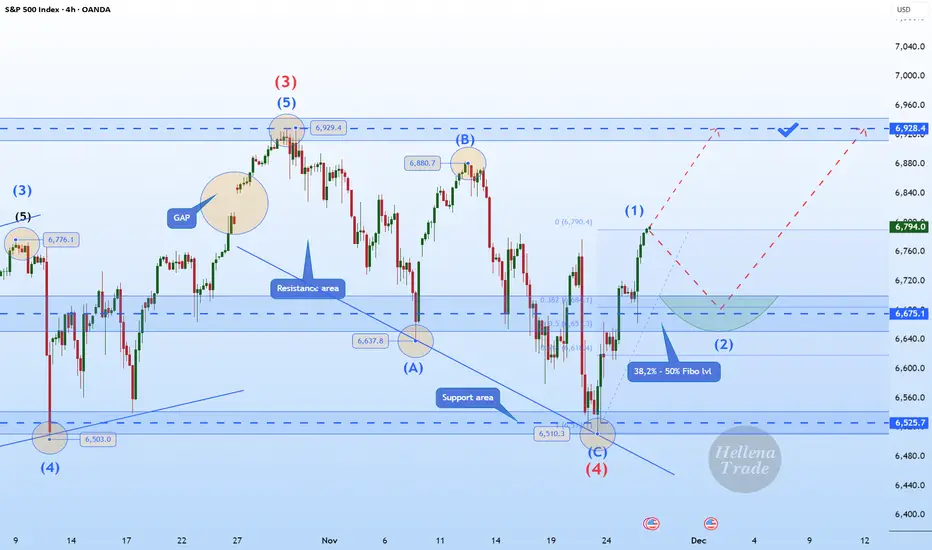
Hellena | SPX500 (4H): LONG to MAX of wave "3" of 6928.Colleagues, we continue the previous scenario of upward movement in the impulse “12345”.
I expect a small correction in the middle order wave “2” approximately to the area of 38.2%-50% Fibonacci levels (6675).
Then I expect a continuation of the upward movement to the maximum of the wave "3" of the higher order 6928.4.
It is possible that the first wave may be stretched, which may mean a correction-free movement to the target.
Fundamental Context.
Market sentiment remains cautiously bullish ahead of this week’s US data releases. Investors continue to price in a softer Fed policy path for 2026, which supports the equity market after the recent correction.
US Treasury yields remain under pressure, and the latest macro indicators — especially labor market cooling and weaker business activity components — reinforce expectations of an economic slowdown. This backdrop typically favors equity upside as markets look ahead to potential policy easing.
Manage your capital correctly and competently! Only enter trades based on reliable patterns!
Signalservice
XAUUSD: Buy on a pullback to 4190After last Friday’s strong and continuous rally, gold remains firmly in a bullish formation. However, it’s important not to overlook the potential risk of a corrective pullback.
On the 4-hour chart, prices are approaching the previous highs, and gold is currently trading near an upper-wick zone, suggesting increasing selling pressure. At this stage, chasing the upside is no longer an optimal strategy, as the risk of a near-term retracement continues to rise.
A more prudent approach would be to wait for a pullback before re-entering long positions.
From the 1-hour chart, the nearest meaningful support lies in the $4,200–$4,190 zone, which represents both a psychological round-number level and an area close to previous swing highs. If the $4,200–$4,190 support range holds, it would provide an opportunity to resume long positions in alignment with the broader uptrend.
Trading Plan:
Buy: $4,200–$4,190 zone
Take Profit 1: $4,230
Take Profit 2: $4,250
Stop-loss: Adjust based on individual capital and risk tolerance

XAGUSD: Bullish Wave 5 Setting a Path Toward 56.000?Hey Realistic Traders!
"Silver Riding Gold’s Momentum, New ATH in the horizon?"
Let’s dive into the technical analysis to answer the question and see what the chart is really telling us.
Technical Analysis
On the daily chart, OANDA:XAGUSD has once again rebounded around the EMA200, with repeated bounces reinforcing the strength of its broader bullish trend. During Wave 4, Silver consolidated within a falling wedge pattern, a corrective formation that typically appears as downside momentum weakens within a larger uptrend. A breakout from this pattern signals renewed bullish pressure and often marks the beginning of Wave 5 in Elliott Wave theory.
Following the breakout, price action supports the case for a developing impulsive Wave 5. The bullish Marubozu candlestick indicates stronger buying interest, while the MACD golden cross adds confirmation to the bullish bias. Together, these signals strengthen the view that momentum is shifting back in favor of the bulls.
Based on Fibonacci projections, Wave 5 may extend toward the 1.0 Fibonacci ratio, aligning with the second upside target near 56.000. Before reaching that level, price may encounter the historical resistance zone around the first target at 54.082, where a temporary pullback could occur.
This bullish wave count remains valid as long as price stays above 49.216. A move below this level would invalidate the potential formation of Wave 5 and shift the outlook back to neutral.
Support the channel by engaging with the content, using the rocket button, and sharing your opinions in the comments below.
Disclaimer: "Please note that this analysis is solely for educational purposes and should not be considered a recommendation to take a long or short position on Silver

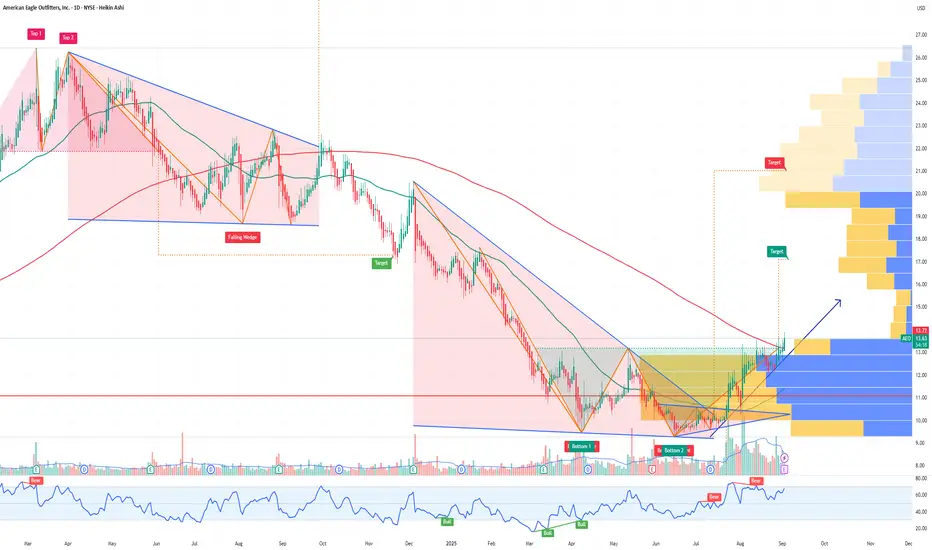
AEO American Eagle Outfitters Options Ahead of EarningsAnalyzing the options chain and the chart patterns of AEO American Eagle Outfitters prior to the earnings report this week,
I would consider purchasing the 15usd strike price Calls with
an expiration date of 2027-1-15,
for a premium of approximately $3.25.
If these options prove to be profitable prior to the earnings release, I would sell at least half of them.
Lingrid | LINKUSDT Pullback Then Bearish ContinuationBINANCE:LINKUSDT perfectly played out my previous trading idea . Price is approaching the 14.00 resistance band, a zone where the downward trendline and previous structural ceiling intersect. The pair is forming a corrective pullback into this confluence after its recent lower-low formation, and momentum is already showing signs of fading. Price remains inside the broader downward channel, keeping the higher-timeframe bias firmly bearish despite short-term relief rallies.
If sellers maintain pressure below 14.00, it is positioned for a continuation move toward the deeper liquidity pocket sitting near 11.75. This aligns with the broader trend structure, where repeated bearish extensions have followed each rejection at the descending trendline.
➡️ Primary scenario: rejection holds → continuation toward 11.75.
⚠️ Risk scenario: a breakout and close above channel would invalidate the bearish setup.
If this idea resonates with you or you have your own opinion, traders, hit the comments. I’m excited to read your thoughts!

XAUUSD: Pullbacks to support levels present entry opportunitiesThere’s no need to panic over gold’s pullback—the retracement is healthy and provides a better opportunity to re-enter long positions.
From the daily chart, gold remains firmly in a bullish structure this week. The rally during the Asian session followed by a corrective pullback is a normal consolidation move and does not change the overall bullish trend. It’s important to recognize that this is a retracement, not a reversal.
On the 1-hour chart, the key support zone is $4,142–$4,150, a level that has been repeatedly validated in previous sessions. Therefore, as long as gold’s pullback holds above this zone, I believe the bullish outlook remains intact.
Trading Plan:
Buy at: $4,142–$4,150
Take Profit 1: $4,170
Take Profit 2: $4,200
Stop-loss: Based on individual risk tolerance

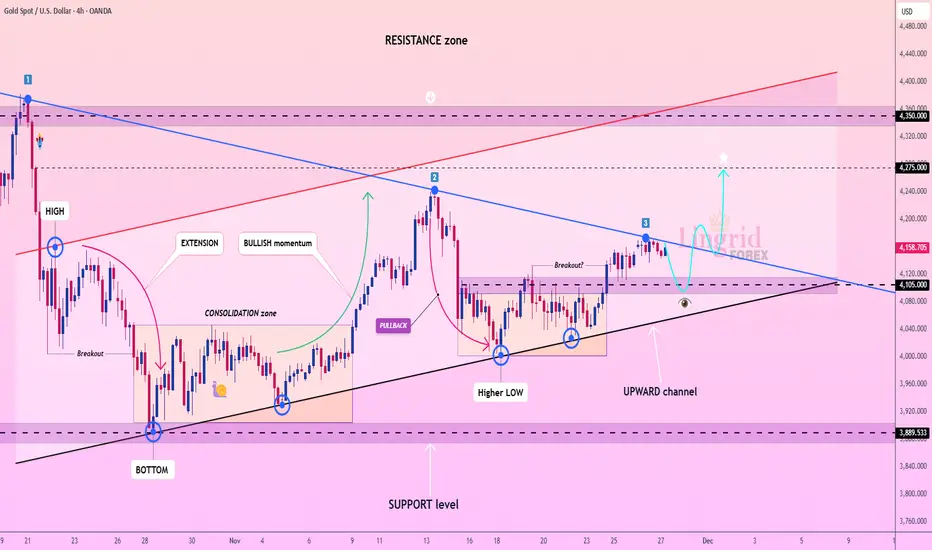
Lingrid | GOLD Trendline Break - Price AccelerationOANDA:XAUUSD is testing the downward trendline for the third touch, a historically significant point where price often attempts a breakout. The market structure has been steadily building higher lows from the 3,900 support level, while buyers continue to defend the bottom of the upward channel. Current consolidation just above 4,100 suggests accumulation rather than exhaustion, especially after price already produced a clean rebound from the channel floor.
If TVC:GOLD breaks and holds above major trendline, momentum may accelerate quickly toward 4,275, the mid-resistance barrier inside the broader supply zone. A successful continuation above this mark opens the way for a deeper squeeze, where major liquidity sits. With USD volatility cooling and safe-haven demand stabilizing, the bullish scenario remains favorable as long as price maintains bullish structure.
➡️ Primary scenario: breakout above trendline → continuation toward 4,275.
⚠️ Risk scenario: failure at trendline → drop back toward 4,000 support.
If this idea resonates with you or you have your own opinion, traders, hit the comments. I’m excited to read your thoughts!
Lingrid | AUDUSD Channel Top Rejection ExpectedFX:AUDUSD has reached the upper boundary of its descending channel, aligning with the weekly-high zone near 0.6540, where price has repeatedly failed to break higher. It is showing early signs of exhaustion after a clean pullback into resistance, with candles losing momentum right at the confluence of the trendline and the upper channel edge — a zone that historically triggers sell-offs. The recent recovery leg appears corrective, keeping the broader bearish trend structure intact.
If sellers defend 0.6540, price is primed for a continuation lower toward 0.6484. The pattern remains bearish as long as price stays below trendline resistance and fails to establish new higher highs.
➡️ Primary scenario: rejection from 0.6540 → decline toward 0.6484.
⚠️ Risk scenario: a breakout above channel would shift momentum into a bullish corrective phase.
If this idea resonates with you or you have your own opinion, traders, hit the comments. I’m excited to read your thoughts!

Lingrid | TONUSDT Retracement Short OpportunityOKX:TONUSDT is climbing into the 1.700 resistance zone, where the downward trendline and the previous-week low (PWL) converge — a classic confluence that often produces bearish reactions. Price is recovering from the lower-low at 1.450, but the structure remains decisively bearish as the pair continues to trade inside a well-defined downward channel. The current pullback shows slowing momentum, suggesting buyers may be running out of steam as the market nears supply.
If price rejects the 1.700 zone, downside pressure is likely to resume with the target at 1.500, where the buying area aligns with the channel floor. Bears maintain structural advantage as long as price stays beneath the trendline and fails to close above 1.700.
➡️ Primary scenario: rejection from 1.700 → drop toward 1.500.
⚠️ Risk scenario: breakout above channel would signal a bullish shift and open room for a corrective rally.
If this idea resonates with you or you have your own opinion, traders, hit the comments. I’m excited to read your thoughts!

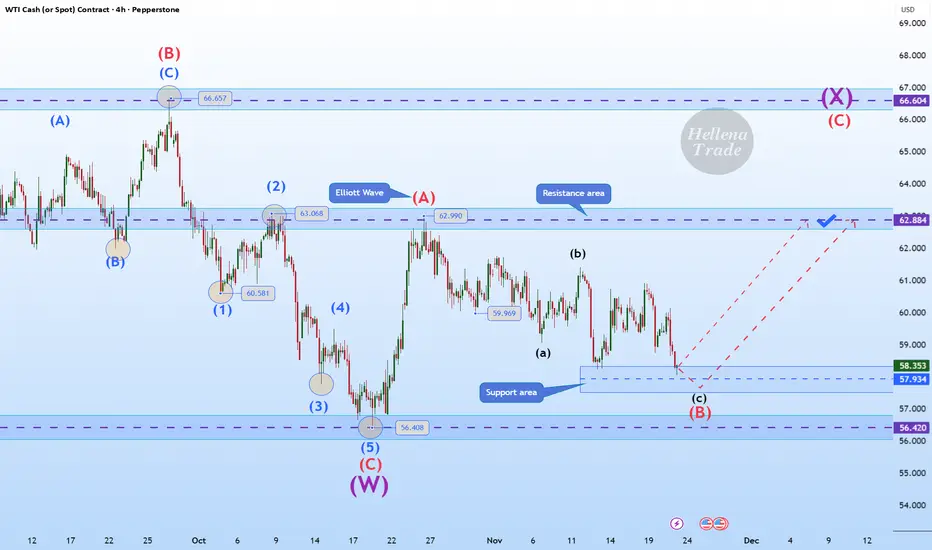
Hellena | Oil (4H): LONG to the area of the maximum of wave “A”.Colleagues, the past forecast has not been canceled, but I see some changes and therefore feel it is necessary to make a fresh forecast.
Apparently, the corrective wave “B” has extended to the area of 57.930. This is quite close to the low of wave “C” at 56.408 and the price should not update it, otherwise there will be a full-fledged break of the structure.
In connection with the above, I think that the price is already completing the downward movement and I expect the resumption of the upward movement at least to the area of the maximum of wave “A” - 62.990.
Manage your capital correctly and competently! Only enter trades based on reliable patterns!
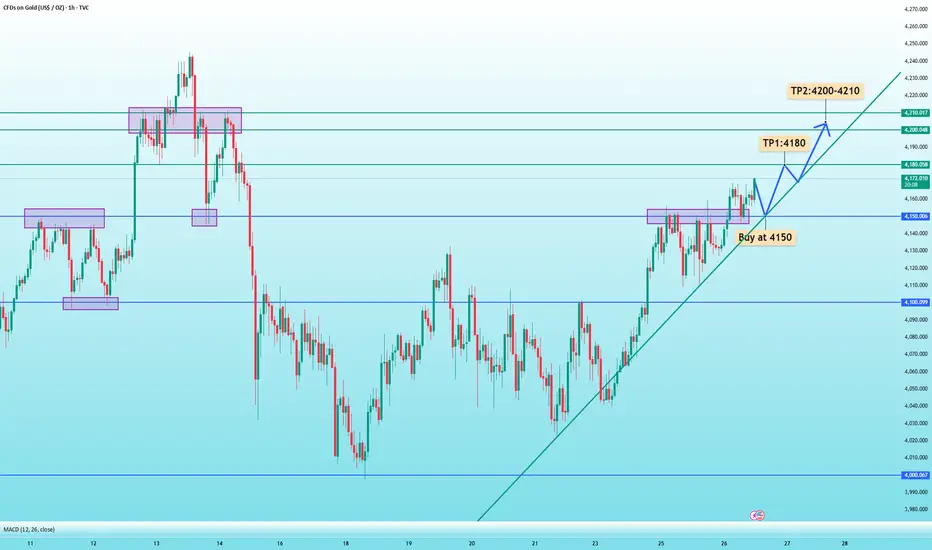
XAUUSD: 4150 is key; buy if it pulls back but doesn't break thisShifts in Global Geopolitical Dynamics:
The global landscape is undergoing noticeable changes, with recent developments showing a clear de-escalation in the Russia–Ukraine situation. This easing of geopolitical tension has placed upward pressure on gold under some constraint, meaning bullish sentiment should not be taken for granted. Entering long positions on pullbacks to support levels would be a more prudent approach.
Today, gold successfully held above $4,150, turning this former resistance into new support. As such, the $4,150 level becomes the key trading pivot for the day.
From the 1-hour chart, as long as prices hold above $4,150, there remains potential for gold to retest $4,180, and possibly challenge the previous highs around $4,200–$4,210.
Trading Strategy:
Buy at $4,150
Target 1: $4,180
Target 2: $4,200–$4,210
Stop-loss: Around $10, adjusted based on individual risk tolerance
Key Data to Watch:
U.S. Initial Jobless Claims (weekly)
U.S. Durable Goods Orders (September, MoM)
Gold & Silver- Very strong finish of the year? (charts say so)It has been an exceptional year for gold bulls. With more than 60% growth year-to-date, the metal has delivered one of its strongest yearly performances in the past two decades.
Even though I’m primarily a short-term trader — rarely holding positions for more than one or two days — it’s impossible to ignore the bigger picture.
The macro-structure is sending a very clear message.
So let’s skip the fluff and dive straight into the charts.
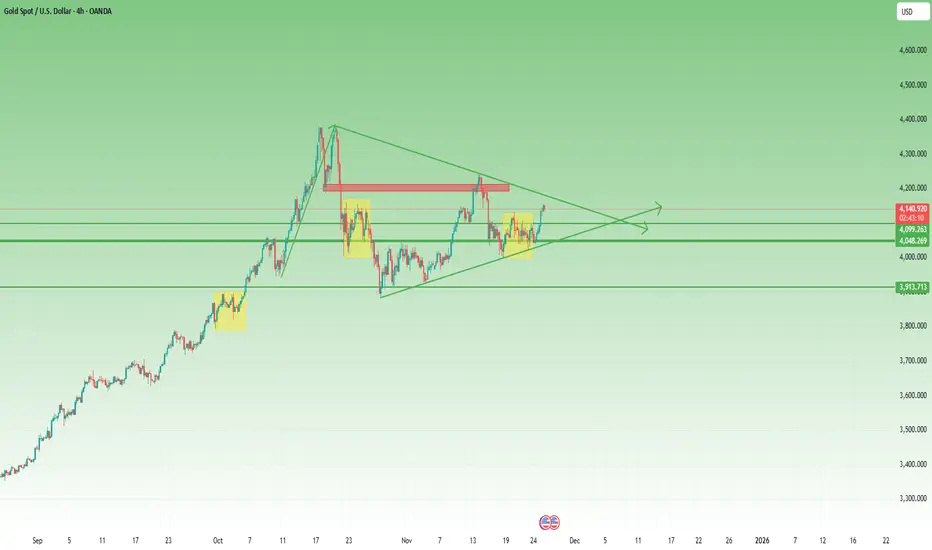
1. XAUUSD: A Violent Range that Formed Something Very Clean
After printing a new all-time high just below 4400, gold collapsed nearly 5,000 pips, only to recover 3,500 pips in a similarly aggressive fashion.
Despite the day-to-day volatility — with 1,000-pip daily swings becoming normal — the structure has settled into a remarkably clean pattern:
A symmetrical triangle.
This pattern is typically a trend continuation structure, and given that the dominant trend is unquestionably bullish, the implication is obvious.
Recent bullish evidence:
- Price broke decisively above 4100
- Short-term structure flipped bullish
- The market is now consolidating tightly just under the descending trendline of the triangle
The most probable scenario?
👉 An upside breakout.
A confirmed break above this compression would target:
- 4250 – the next major resistance
- 4500 – psychological level
- 4700 – the full measured move of the triangle (approx. 5000 pips)
Of course, all eyes remain on the ATH zone, but structurally, the path of least resistance is still up.
2. XAUEUR: Same Pattern, Same Message
XAUEUR is forming an almost identical symmetrical triangle, with a measured target of roughly 4,000 pips if the breakout is confirmed.
When multiple major gold crosses deliver the same structure, it usually means one thing:
➡️ The underlying metal, not the currency pair, is driving the move. (and, as I said at least 5 times by now, STOP LOOKING AT DXY!!!!)
3. XAUGBP: Slightly Behind, but Still Bullish
XAUGBP also reflects the same pattern, though price is currently sitting ~200 pips below the descending resistance line.
Still, the structure remains bullish as long as the market holds its higher-low sequence.
4. XAUJPY: Even More Bullish
Unlike the symmetrical structures above, XAUJPY has formed an ascending triangle since its ATH.
Ascending triangles carry an even stronger bullish bias, showing that demand absorbs every pullback with increasing strength.
This chart is arguably the most aggressively bullish of the group.
5. Gold Futures: Breakout Already in Motion
Gold futures show the same broader pattern — but with one notable difference:
The trendline is already broken.
This makes futures the “leading chart,” often hinting at what spot XAUUSD may do next.
Outlook: When All Stars Align
When XAUUSD, XAUEUR, XAUGBP, XAUJPY, and Gold Futures all point in the same direction, the message is difficult to argue with.
Unless gold breaks back below 4050, the bias into year-end remains decisively:
⭐ Bullish.
⭐ Momentum-driven.
⭐ Trend-confirming.
Gold bull trend intact.
6. Silver: Quietly the Stronger Metal
Silver has actually been outperforming gold this year, with price nearly doubling. It is now sitting just under its most recent ATH.
After reclaiming the 50.50 level and establishing it as solid support, the structure is extremely bullish.
A clean break above the ATH would activate a measured move target near 65.
Silver continues to behave like the higher-beta version of gold — and right now, that beta is paying.
BY THE WAY, THIS IS MY PREVIOUS ANALYSIS COVERING GOLD CROSSES FROM 3 MONTHS AGO:

Lingrid | AUDJPY Potential Rebound from Key ResistanceFX:AUDJPY perfectly played out my previous trading idea . Price is moving toward the 102.300 resistance. It is attempting to extend higher but market may drop if it fails to secure a breakout above the previous weekly high (PWH), signaling exhaustion from buyers right at a major confluence area. The pair is now showing early signs of fading momentum.
If this rejection holds, price is likely to rotate downward toward 101.510, which aligns with the local support shelf and the mid-line of the ascending structure. A deeper extension toward remains possible if risk sentiment weakens or if JPY strength accelerates — especially with markets shifting cautiously ahead of key Asia-Pacific data.
➡️ Primary scenario: rejection from 102.300 → decline toward 101.510.
⚠️ Risk scenario: a clean break above 102.300 would invalidate the bearish view and reopen the path toward 103.000 inside the upper resistance channel.
If this idea resonates with you or you have your own opinion, traders, hit the comments. I’m excited to read your thoughts!

Lingrid | DOGEUSDT Bearish Continuation After CorrectionBINANCE:DOGEUSDT perfectly played out my previous trading idea . Price is pulling back toward the 0.1600 resistance band, a level aligning with both the downward trendline and the ceiling of the mid-range structure. The latest pullback completed a textbook retest of the broken support-turned-resistance, with price losing momentum as it approached the confluence zone. Given the persistent bearish channel and inability to break the series of lower highs, sellers are showing signs of regaining control.
If downside pressure holds, COINBASE:DOGEUSD is poised to rotate back toward 0.1350, which sits at the lower boundary of the current channel and the origin of the latest bullish correction. This area also marks the primary liquidity pocket where buyers previously reacted aggressively. Broader sentiment remains weak.
➡️ Primary scenario: rejection from 0.1600 → decline toward 0.1350.
⚠️ Risk scenario: a breakout above channel invalidates the bearish view.
If this idea resonates with you or you have your own opinion, traders, hit the comments. I’m excited to read your thoughts!

BTC Bounce Looks Corrective – Bottom Not In Yet1. Recap of My Last BTC Outlook (5 November)
In the 5th November analysis, I noted that the 106k support zone was under pressure, and if that level failed, the next meaningful target would be 90k — because 100k, despite being psychological, should not offer much after technical break.
That played out perfectly:
- 106k failed
- 100k offered nothing but a small rebound
- BTC dropped straight into the 90k zone
And then continued even deeper, almost touching 80k before rebounding
We’re now trading around 87,500, after a textbook corrective bounce.
2. Is the Bottom In?
➡️ In my opinion, no. Definitely not.
And here’s where I apply my usual contrarian filter:
Whenever I start hearing the same voices saying the same thing —
“Bitcoin bottom is in! Bitcoin up only!”
— I immediately become cautious.
These are the same people who never consider the other side of the market.
A broken compass can show the right direction once in a while, but it’s still broken.
3. Technical Picture – Nothing Bullish Here
- Yes, the bounce from 80k is normal and expected.
- Yes, BTC can easily retrace 10–15k after a large drop.
- But nothing in the current structure suggests a meaningful bottom.
What we have right now is:
- A classic corrective rebound
- Weak impulse
- No break back above of important resistance
- No reversal pattern
- No shift in market bias
It looks exactly like what price should do after a violent leg down — not like a new bull trend.
This is the type of rebound where retail screams “moon,” but professionals simply prepare for another sell.
4. My Outlook – Bearish Until BTC Reclaims 100k With Conviction
My plan is simple and level-driven:
Preferred Sell Zone:
- 92k → This is where I want to sell, ideally on a weak rally
Downside Targets:
- 80k → Recent low and first logical stop
- 75k → Major structural support and second target
Bearish outlook is invalidated ONLY if:
➡️ BTC reclaims 100k with conviction (not a wick, not a temporary spike)
Until that happens, every rally is a potential shorting opportunity.
5. Conclusion – Still Bearish, Despite the Bounce
BTC has done exactly what it was supposed to do:
- Drop to 90k
- Overshoot to 80k
- And bounce in a corrective manner
Nothing about this price action signals a bottom.
If anything, it signals more downside ahead — once the corrective rally into 92k completes.
Bias: Bearish
Approach: Sell rallies
Invalidation: Break and hold above 100k with conviction
Until then, the narrative “bitcoin up only” remains a meme, not analysis. ⚠️

Lingrid | SHIBUSDT Potential Buy After Support Fake BreakBINANCE:SHIBUSDT perfectly played out my previous trading idea . Price is testing lower boundary of the descending channel. The market structure remains bearish overall, but the reaction at support hints at early absorption as the market forms yet another lower low near the key demand zone. If buyers defend the 0.00000741–0.00000767 area, a corrective bounce toward 0.00000890 becomes the likely scenario as liquidity builds beneath the trendline. The broader context still shows a controlled downtrend, but fake breaks at support often trigger short-term relief moves before the trend resumes.
⚠️ Risks:
A clean breakdown below 0.00000741 may open the way toward deeper lows in the support area.
Broader market weakness—especially BTC volatility—could invalidate any developing rebound.
Failure to reclaim the descending trendline may limit upside movement and keep SHIB consolidating near the lows.
If this idea resonates with you or you have your own opinion, traders, hit the comments. I’m excited to read your thoughts!

4100 Zone Protected: Eyes Now on the Symmetrical Trendline📌 Yesterday’s Outlook – What Happened
In my yesterday's analysis, I highlighted that Gold turned bullish the moment price broke above resistance, shifting the entire short-term structure in favor of the buyers. I also mentioned that 4100–4110 is the key zone where bulls should stay active.
During yesterday’s session, the market validated this view:
🔹 Price dipped into 4100–4110 three separate times,
🔹 Each dip was defended aggressively,
🔹 And eventually Gold pushed into a new intraday high.
This shows clear buyer interest and confirms that the zone is currently acting as strong demand.
❓ Key Question Today
Has Gold built enough momentum to break the falling trendline of the symmetrical triangle that started from the all-time high?
This trendline is the major short-term decision area. What happens here will set the tone for the next leg.
📉 Why the Trendline Matters & What Comes Next
Gold is now pressing directly into the falling trendline of the larger symmetrical triangle structure.
This zone is crucial because:
1. It’s the first major dynamic resistance since ATH.
2. A break above it would CLEARLY shift the medium-term bias back in favor of the bulls.
3. Momentum is building — dips are being bought with consistency.
4. Buyers have defended yesterday’s lows multiple times.
If the trendline breaks cleanly, the door opens toward the 4250 zone.
That’s the next logical magnet for price.
📈 Trading Plan – Still a “Buy-the-Dip” Market
As long as yesterday’s lows remain intact, the structure stays bullish.
🟢 Smart play: Buy dips into intraday support levels
🔒 Invalidation: A break below yesterday's low
🎯 Upside focus: Trendline break → 4250
Until the market shows a reason to flip, momentum is in favor of the bulls.
🚀 Let’s see if Gold has the strength to break that trendline today.

Lingrid | GOLD Complex Correction Short SetupOANDA:XAUUSD is testing the 4,150 resistance zone, where price might form a potential fake break. The move stalled right at confluence between the red long-term resistance trendline and the ceiling of the range, signaling possible buyer exhaustion. Price is now slipping back beneath the broken breakout level, suggesting that momentum is shifting back in favor of sellers as intraday structure loses strength.
If bearish pressure continues, TVC:GOLD is positioned to rotate toward 4,095, with the broader correction where the next liquidity cluster sits. As long as price remains capped under 4,160, the downside scenario remains dominant, especially with markets awaiting key USD-driven macro catalysts (PPI) that could strengthen the dollar and weigh further on gold.
➡️ Primary scenario: rejection holds → drop toward 4,095.
⚠️ Risk scenario: a clean breakout above channel flips momentum and opens room toward higher levels.
If this idea resonates with you or you have your own opinion, traders, hit the comments. I’m excited to read your thoughts!

Lingrid | USDJPY Potential Long After PullbackFX:USDJPY perfectly played out my previous trading idea . Market is pulling back into the 155.88–156.00 zone, aligning with the upward trendline. The recent drop forms a clean ABC corrective pattern, and price is stabilizing right at the structural demand area that previously launched a strong bullish impulse toward the highs. Buyers are defending the trendline, showing early signs of absorption after a controlled retracement.
If this support cluster holds, it is positioned for a continuation toward 157.90, which corresponds to the resistance band and the previous higher high. The broader structure remains bullish, backed by higher-low formation and the intact upward channel, while yen fundamentals continue to lean weak due to ongoing BoJ caution.
➡️ Primary scenario: bullish defense at 155.88 → move toward 157.90.
⚠️ Risk scenario: a decisive break below the trendline will lead to channel border retest.
If this idea resonates with you or you have your own opinion, traders, hit the comments. I’m excited to read your thoughts!

Lingrid | EURUSD Bear Market Digging Lower TerritoryFX:EURUSD is trading under the weekly high after rejecting the upward trendline, confirming another lower high inside the broader bearish channel. Price is now slipping toward the mid-range zone, where the breakout failed earlier, showing that buyers are losing control. The upward trendline has already been broken once, and the it is forming a corrective structure that typically precedes a deeper decline.
If momentum stays weak, price may push toward 1.14500, which aligns with the major support area on the 4H chart. Fundamentally, the euro remains under pressure as markets scale back expectations for ECB tightening, while USD strength persists ahead of key U.S. data this week — reinforcing the bearish scenario.
➡️ Primary scenario: continuation lower toward 1.14500 support.
⚠️ Risk scenario: reclaiming 1.15570 and breaking the red trendline would open a bullish correction.
If this idea resonates with you or you have your own opinion, traders, hit the comments. I’m excited to read your thoughts!

Lingrid | GBPUSD Potential Short Above PDH ResistanceFX:GBPUSD is approaching the 1.3132 resistance zone again, aligning with the trendline and previous-day highs. Price is still trading inside the consolidation block but remains capped beneath both the PDH level and the broader resistance band — a structure that typically precedes a bearish rotation. With the upward trendline already broken and retested from below, sellers now have a technical advantage.
If intraday momentum stays weak, the market is likely to roll over toward 1.3070 the support area. Only a clean breakout above 1.3132 would neutralize this setup and shift the bias toward a corrective upswing.
➡️ Primary scenario: rejection holds → move toward 1.3070.
⚠️ Risk scenario: breakout above 1.3132 shifts bias toward a bullish corrective phase.
If this idea resonates with you or you have your own opinion, traders, hit the comments. I’m excited to read your thoughts!

Structure Turns Bullish, Yet Volatility Warns of Traps1. Recap of Yesterday’s Outlook
In yesterday’s analysis, I said very clearly:
➡️ “As long as 4100 resistance is intact, the structure remains bearish.”
And indeed, I followed that bias — I sold the rally around 4075, the trade moved 150 pips in my favor, but without follow-through.
I closed it with an insignificant 30-pip profit, a good decision considering that holding it would’ve led straight into a stop-loss hit.
Price action justified the caution.
2. Has the Structure Shifted?
The key question today:
➡️ Has the market turned bullish?
So far, yes — technically, the structure has shifted.
Why?
- The 4100 resistance was broken strongly, with conviction.
- The breakout wasn’t just a wick; it held.
- Momentum flipped short-term direction
Under normal conditions, this would imply:
➡️ Upside continuation toward 4200.
And the logic is simple:
- What was resistance becomes support.
- So the 4100–4080 zone is now the bullish line in the sand.
3. But This Is Gold These Days… Volatile & Erratic
The problem is not the technicals — the problem is behavior.
Gold recently has been:
- Hysterical in volatility,
- Featuring massive fakeouts,
- Delivering 700–1500 pip swings within hours,
This makes the breakout valid, but not necessarily trustworthy without confirmation.
And here’s the key:
➡️ If Gold drops back under 4080, the structure instantly turns bearish again.
This is why blindly buying the breakout is dangerous.
Patience and confirmation matter more than ever.
4. Technical Outlook – Levels That Matter
Bullish structure (for now):
- 4100–4080 is support
- Above this zone → bullish
- Target → 4200
Bearish trigger:
- Break back below 4080 → failed breakout
- Structure returns bearish
- Possible revisit of 4000, then 3900
Bigger picture:
Gold is still contained in a large triangle formation since the all-time high.
Breakouts inside a triangle are often traps until the triangle itself resolves.
That’s why flexibility is essential.
5. Trading Plan – Short-Term, Flexible, and Level-Based
Because Gold is in a triangle and volatility is intense:
- Trade short-term, not swing positions.
- Look to buy dips into 4100–4080, but only with clear reversal signs.
- Don’t hold bias stubbornly — adapt candle by candle.
Clear plan:
Bullish scenario:
- Buy dips around 4100- 4110 only if reversal signs appear
- Target 4200
Bearish scenario:
- If price falls back below 4080, forget the breakout —
bearish again
- Potential drop toward 4000, then lower
This is one of those moments where discipline beats prediction.
6. Conclusion – Bullish, but With an Asterisk
In summary:
- The breakout above 4100 is real → bullish bias active
- Target: 4200
- BUT the structure remains fragile due to recent volatility
- Below 4080 = bearish again
- Triangle structure adds uncertainty
- Short-term trading and flexibility are essential these days
The trend says bullish, the behavior says be careful.
Lingrid | XRPUSDT Short from Resistance Confluence ZoneBINANCE:XRPUSDT perfectly played out my previous trading idea . Price bounced sharply from the lower low, but price is now approaching a heavy confluence zone around 2.4340, where the upward trendline, the channel border, and the resistance block all meet. This is the same area that previously produced two lower highs, making it a structurally significant turning point. Unless buyers break through this cluster with strong momentum, the rally is likely to fade.
From a market perspective, CRYPTOCAP:XRP remains fundamentally sensitive to risk sentiment and regulatory headlines, while broader crypto flows remain mixed. If sellers defend the 2.4340 region again, the structure favors a continuation lower toward 2.0600.
➡️ Primary scenario: rejection from 2.4340 → move toward 2.0600.
⚠️ Risk scenario: breakout above the confluence flips momentum and opens the path toward 2.83 resistance.
If this idea resonates with you or you have your own opinion, traders, hit the comments. I’m excited to read your thoughts!
